INTRODUCTION
Several recent studies have documented a spatial coincidence of people and biodiversity over large regions (for example sub-Saharan Africa, Balmford et al. Reference Balmford, Moore, Brooks, Burgess, Hansen, Williams and Rahbek2001; East Asia, Ding et al. Reference Ding, Yuan, Geng, Koh and Lee2006; Australia, Luck Reference Luck2007; the Andes, Fjeldså & Rahbek Reference Fjeldså, Rahbek, Mace, Balmford and Ginsberg1998; the Brazilian Cerrado, Diniz-Filho et al. Reference Diniz-Filho, Bini, Pinto, Rangel, Carvalho and Bastos2006; Mexico, Vazquez & Gaston Reference Vazquez and Gaston2006; and Europe, Araújo Reference Araújo2003). These studies have focused on fungi (Pautasso & Zotti Reference Pautasso and Zotti2009), vascular plants (for example Marini et al. Reference Marini, Prosser, Klimek and Marrs2008), butterflies (for example Luck et al. Reference Luck, Ricketts, Daily and Imhoff2004), grasshoppers (Steck & Pautasso Reference Steck and Pautasso2008), ants (Schlick-Steiner et al. Reference Schlick-Steiner, Steiner and Pautasso2008), stream macro-invertebrates (Pautasso & Fontaneto Reference Pautasso and Fontaneto2008), amphibians and reptiles (for example Moreno-Rueda & Pizarro Reference Moreno-Rueda and Pizarro2007), mammals (for example Real et al. Reference Real, Barbosa, Porras, Kin, Marquez, Guerrero, Palomo, Justo and Vargas2003; Moreno-Rueda & Pizarro Reference Moreno-Rueda and Pizarro2009) and birds (for example Hunter & Yonzon Reference Hunter and Yonzon1993; Pidgeon et al. Reference Pidgeon, Radeloff, Flather, Lepczyk, Clayton, Hawbaker and Hammer2007).
Human activities often cause species endangerment and biotic homogenization, through processes such as habitat degradation, land-use change, species introductions, environmental pollution and urbanization (Ford et al. Reference Ford, Barrett, Saunders and Recher2001; Costa et al. Reference Costa, Leite, Mendes and Ditchfield2005; You et al. Reference You, Xu, Cai and Vasseur2005; Clergeau et al. Reference Clergeau, Croci, Jokimäki, Kaisanlahti-Jokimäki and Dinetti2006; Venter et al. Reference Venter, Brodeur, Nemiroff, Belland, Dolinsek and Grant2006; Araújo & Rahbek Reference Araújo and Rahbek2007). At a local level, human settlements are often associated with an increased presence of human-adapted species (Blair Reference Blair1996; McKinney Reference McKinney2006), although patches of semi-natural habitats in urbanized areas may still contain high numbers of other species. Roughly speaking, the more numerous people are in a certain region, the higher their potential impact on that region's biodiversity (McKinney Reference McKinney2001; Brown & Laband Reference Brown and Laband2006; Rondinini et al. Reference Rondinini, Chiozza and Boitani2006; Luck Reference Luck2007). This presupposes that other things are kept equal, most notably environmental awareness (de Groot & Steg Reference de Groot and Steg2007), per person consumption of local resources (Collins et al. Reference Collins, Kinzig, Grimm, Fagan, Hope, Wu and Borer2000), spatial distribution of human settlements (Pandit & Laband Reference Pandit and Laband2007) and level of technological development.
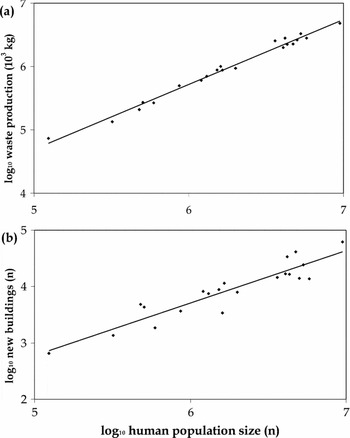
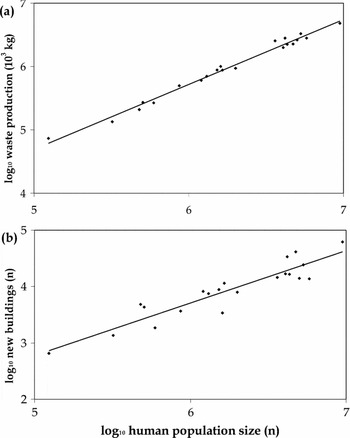
Given that these factors can differ substantially amongst countries (Weidner & Jänicke Reference Weidner and Jänicke2002; Seip et al. Reference Seip, Cobelas, Doledec, Fang, Smith and Vorontsova2005), it is necessary to analyse the spatial correlation between human population size and biodiversity within countries. Single countries are relatively homogeneous in terms of environmental awareness and consumption patterns of their population, as shown for example by the proportional increase of waste production (Fig. 1a) and number of new buildings (Fig. 1b) with increasing regional human population size in Italy. This implies that at this scale of analysis human population size can be a good surrogate variable for other environmental impacts caused by people.
Correlation between (a) waste production in 2005 (103 kg) and human population size in 2006 (n = 21, r2 = 0.99, y = −0.35 + 1.01x, slope standard error [sse] = 0.02, p < 0.001), and (b) number of new buildings in 2004 and human population size in 2006 (n = 21, r2 = 0.86, y = −2.17 + 0.98x, sse = 0.06, p < 0.001) for Italy's regions.
For animals, analyses of the large-scale spatial species-people correlation at the national level have been performed for vertebrates other than fish in Australia (Luck et al. Reference Luck, Ricketts, Daily and Imhoff2004), birds in South Africa, Great Britain and the USA (Chown et al. Reference Chown, van Rensburg, Gaston, Rodrigues and van Jaarsveld2003; Evans & Gaston Reference Evans and Gaston2005; Pidgeon et al. Reference Pidgeon, Radeloff, Flather, Lepczyk, Clayton, Hawbaker and Hammer2007), and mammals in Mexico (Vazquez & Gaston Reference Vazquez and Gaston2006). Only for Australia, Mexico and South Africa has the species-people correlation been related to the current network of protected areas. For South Africa, quarter-degree grid cells next to current protected areas have a higher human density than expected by chance (Chown et al. Reference Chown, van Rensburg, Gaston, Rodrigues and van Jaarsveld2003). For Mexico and Australia, the size of protected areas is inversely related to human population density in those areas, as large protected areas were chosen in areas of lower human population size, which also tend to be areas of lower species richness (Vazquez & Gaston Reference Vazquez and Gaston2006; Luck Reference Luck2007). In Finland, the network of protected areas is unevenly distributed and tends to be biased towards the less populated northern regions (Virkkala & Rajasarkka Reference Virkkala and Rajasarkka2007). However, there is a need for further study of how species-people correlations fit with variations in the presence of protected areas, not just for total species richness of a taxon, but also for subsets of species such as, for birds, breeding, human-avoiding and threatened species.
We investigated the presence of a species-people correlation for birds (total, human-avoiding, human-adapted, breeding and threatened species) across Italy's regions, controlling for variations in area, latitude, percentage of protected area and spatial autocorrelation. In addition, we ran models including land-cover variables such as proportions of agricultural, forest and mountainous areas. Italy is a species-rich and densely populated, yet relatively understudied, country.
METHODS
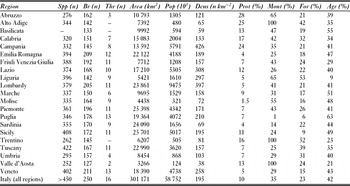
Bird species richness of Italy's regions was obtained from an updated compilation of existing regional bird checklists (Boano et al. Reference Boano, Brichetti, Cambi, Meschini, Mingozzi and Pazzucconi1985; Brichetti & Cambi Reference Brichetti and Cambi1987; Pellegrini Reference Pellegrini1992; Scebba et al. Reference Scebba, Moschetti, Cortone and Di Giorgio1993; Laurenti et al. Reference Laurenti, Paci and Stagnini1995; Grussu Reference Grussu1996a, Reference Grussub; Bocca & Maffei Reference Bocca and Maffei1997; Brunelli & Fraticelli Reference Brunelli and Fraticelli1997; Battista et al. Reference Battista, Carafa, Colonna and De Lisio1998; Niederfriniger et al. Reference Niederfriniger, Schreiner and Unterholzner1998; Fraissinet et al. Reference Fraissinet, Cavaliere, Conti, Milone, Moschetti, Piciocchi and Scebba2002; Bagni et al. Reference Bagni, Sighele, Passerella, Premuda, Tinarelli, Cocchi and Leoni2003; Giacchini Reference Giacchini2003; Pedrini et al. Reference Pedrini, Caldonazzi and Zanghellini2005) (Table 1).
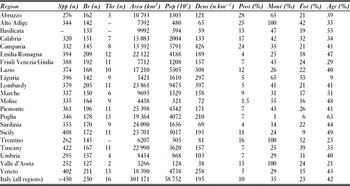
Total (Spp), breeding (Br) and threatened (Thr) bird species, area (km2), human population size (Pop; thousand individuals) and density (Dens; number of people per km2) in 2006, and percentage in 2003 of protected areas (Prot), and in 2005 of mountainous (Mont), forest (For) and agricultural (Agr) areas in each of Italy's regions (see Methods for data sources).
Analyses were subdivided for (1) all species reported (no matter their frequency and season of occurrence: breeding, sedentary, wintering, migrant, vagrant), (2) breeding species and (3) threatened species. It was also investigated how the proportion of (total and breeding) bird species which are normally (4) only and (5) not present in human-modified habitats (based on Sukopp & Werner Reference Sukopp and Werner1982; Dinetti Reference Dinetti1994; Dinetti & Fraissinet Reference Dinetti and Fraissinet2001) varied with human population size. Threatened species were identified following Stattersfield and Capper (Reference Stattersfield and Capper2000). For Basilicata, only the number of breeding species was available. For the Trentino-Alto Adige region, data on the total and the breeding species richness were available for the two provinces (Trentino and Alto Adige).
Human population size in 2006 and the proportions of protected (2003), mountainous, forest and agricultural use (2005) areas were obtained from the Italian National Institute of Statistics (ISTAT) (Table 2). Mountainous areas are defined as regions generally above 600–700 m altitude, forest areas are obtained by the sum of all forest stands of area > 0.5 ha, and agricultural areas comprise effectively cultivated areas (crops, horticulture, grassland and pastures) (Schipani Reference Schipani2008). The proportion of protected areas considered national parks, national reserves, regional parks, regional reserves and other protected areas together, as overall these five types of protected areas provide the same level of protection, the only difference being that national parks and national reserves are regulated and managed at the national level, while the other types depend on local administrations (Maiorano et al. Reference Maiorano, Falcucci and Boitani2008). A visualization of the spatial data is provided in the Appendix (see Supplementary material at http://www.ncl.ac.uk/icef/EC.Supplement.htm).
Maximum, minimum, mean, median and standard deviation of total (Spp), breeding (Br) and threatened (Thr) bird species, area (km2), human population size (Pop; thousand individuals) and density (Dens; number of people per km2) in 2006, and percentage in 2003 of protected areas (Prot), and in 2005 of mountainous (Mont), forest (For) and agricultural (Agr) areas in each of Italy's regions.

The correlation of total, breeding and threatened bird species richness with human population size was analysed on its own and controlling for region area, latitude and percentage of protected area. Additional models were run controlling for three main land-cover variables (proportion of mountainous, forest and agricultural area). Total and breeding bird species richness, region area and human population size were log-transformed prior to analyses to better approach a normal distribution. Analyses were run in SAS 9.1. Spatial autocorrelation was controlled for using mixed models with exponential co-variance structure (Pautasso Reference Pautasso2007). Results from non-spatial and spatial models were qualitatively consistent, but, for simplicity, we only present results which took into account a potential spatial non-independence of data. Spatial non-independence of data occurs if data close to each other tend to resemble each other (see Legendre Reference Legendre1993). It is important to control for spatial autocorrelation, as this factor can lead to misleading parameter estimates (for example Vazquez & Gaston Reference Vazquez and Gaston2006).
RESULTS
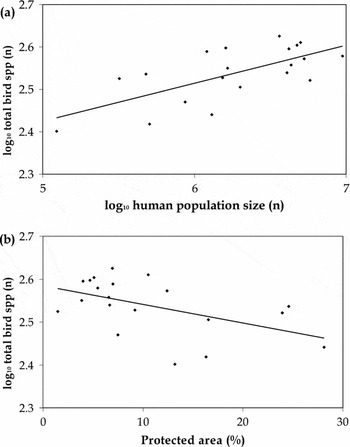
The total number of bird species in a region (spp) was positively correlated with human population size (pop) (Fig. 2a). This correlation persisted when controlling for variations in area (area), latitude (lat) and proportion of protected areas (prot) (n = 20, r2 = 0.63, log spp = 2.00 + 0.09 log pop – 0.01 log area + 0.002 lat – 0.003 prot, slope standard error [sse] = 0.04, 0.08, 0.004, 0.001, p = 0.05, 0.87, 0.70, 0.02). There was no significant association of area and latitude with total avian species richness, but the proportion of protected areas correlated negatively with total avian species richness (Fig. 2b).
Correlation between total bird species richness and (a) human population size (n = 20, r2 = 0.47, y = 1.98 + 0.09x, sse = 0.02, p = 0.001), (b) proportion of protected areas (n = 20, r2 = 0.26, y = 2.58 − 0.004x, sse = 0.001, p = 0.02) for Italy's regions.

There was no evidence that the presence of species that are normally only or typically present in urbanized environments might be responsible for the increase of total bird species richness with human population size, as these species (Apus apus, A. pallidus, Athene noctua, Columba livia, Corvus monedula, Delichon urbica, Hirundo rustica, Passer italiae [replaced by P. hispaniolensis in Sardinia and Sicily], P. montanus, Streptopelia decaocto, Sturnus vulgaris and Tyto alba) were present in all regions. Some of these species are also frequently found outside towns (for example A. noctua and T. alba). Conversely, the proportion of species normally absent from human-modified habitats (which varied between 46 and 62% amongst regions) increased with increasing human population size (n = 19, r2 = 0.47, proportion anthropophobic spp = 11.6 + 7.1 log pop, sse = 1.8, p = 0.001). This result was confirmed when controlling for region area, latitude and proportion of protected area, and in this model the proportion of human-avoiding species declined significantly with increasing proportion of protected areas, thus mirroring the pattern of total bird species richness.
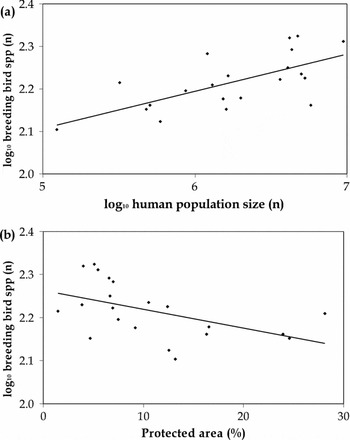
Breeding bird species richness (brspp) increased with human population size (Fig. 3a), but this result was not confirmed when controlling for variations in area, latitude and proportion of protected areas (n = 21, r2 = 0. 72, log brspp = 1.20 + 0.03 log pop + 0.12 log area + 0.008 lat – 0.003 prot, sse = 0.03, 0.07, 0.003, 0.001, p = 0.37, 0.10, 0.03, 0.02). In this case, there was no significant association with human population size. However, breeding bird species richness increased with latitude and decreased with proportion of protected areas (Fig. 3b). There were no significant variations in the proportion of breeding species typically absent from human-modified habitats with human population size and protected area, in a model controlling for variations in area and latitude.
Correlation between breeding bird species richness and (a) human population size (n = 21, r2 = 0.45, y = 1.65 + 0.09x, sse = 0.02, p < 0.001), (b) proportion of protected areas (n = 21, r2 = 0.25, y = 2.26 − 0.004x, sse = 0.002, p = 0.02) for Italy's regions. The first correlation is not significant when controlling for variations in region area and latitude.

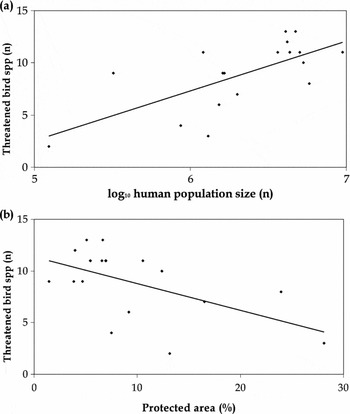
The number of threatened bird species present in a region increased with human population size (Fig. 4a). This result was confirmed when controlling for variations in area, latitude and proportion of protected areas (n = 18, r2 = 0.78, threatened spp = −13.5 + 5.4 log pop −1.4 log area −0.1 lat − 0.27 prot, sse = 1.9, 3.3, 0.2, 0.06, p = 0.01, 0.68, 0.66, 0.001). However, this was not the case when also controlling for total bird species richness (n = 18, r2 = 0.83, threatened spp = −99.8 + 0.5 log pop + 3.2 log area + 0.3 lat −0.12 prot + 32.2 log spp, sse = 1.7, 2.3, 0.3, 0.05, 9.1, p = 0.77, 0.20, 0.37, 0.04 and p < 0.0001, respectively). The last model showed that variations in the threatened bird species richness amongst Italy's regions can be largely explained by variations in overall bird species alone (n = 18, r2 = 0.77, threatened spp = −116.5 + 49.4 log spp, sse = 6.2, p < 0.0001), although there is also a negative association with proportion of protected areas (Fig. 4b).
Correlation between number of threatened bird species and (a) human population size (n = 18, r2 = 0.47, y = −21.3 + 4.8x, sse = 1.3, p = 0.002), (b) proportion of protected areas (n = 18, r2 = 0.31, y = 11.4 – 0.26x, sse = 0.10, p = 0.02) for Italy's regions.

For total, breeding and threatened bird species, these results were confirmed when including in models the proportion of agricultural, forest and mountainous area, which were not factors significantly affecting the three response variables in the models above. These three land-use variables were interrelated: the proportion of forest area (for) increased with proportion of mountainous area (mont) (n = 21, r2 = 0.36, for = 13.3 + 0.26 mont, sse = 0.09, p = 0.007), the proportion of agricultural area (agr) declined with proportion of mountainous area (n = 21, r2 = 0.42, agr = 51.2 − 0.26 mont, sse = 0.08, p = 0.003), and the proportion of agricultural area declined with proportion of forest area (n = 21, r2 = 0.64, agr = 58.7 − 0.78 for, sse = 0.13, p < 0.0001). There was no significant variation of the proportions of mountain, forest and agriculture area with variations in latitude amongst regions.
As for the other correlations between the other independent variables, human population size (pop) increased with region area (area) and did not vary significantly with variations in latitude or proportion of protected areas (n = 21, r2 = 0.76, log pop = −0.29 + 1.31 log area + 0.05 lat + 0.01 prot −0.017 agr −0.012 mont −0.004 for, sse = 0.33, 0.04, 0.01, 0.008, 0.004, 0.006, p = 0.003, 0.19, 0.18, 0.03, 0.01, 0.49, respectively). Human population size also significantly decreased with increasing proportion of agricultural area and of mountainous area, and did not vary significantly with variations in forest area. The proportion of protected area did not vary significantly with variations in human population size, latitude, proportion of agricultural and forest area, but increased with increasing region area and proportion of mountainous area (n = 21, r2 = 0.29, prot = −85.5 + 19.4 log area + 0.34 mont, sse = 6.8, 0.08, p = 0.01, 0.003).
DISCUSSION
The species-people correlation can be considered in various ways, from the perspective of human impacts on biodiversity to how biodiversity copes with human presence. We make no claim of causality, thus we are not arguing that the presence of more human beings is causing more species to be present (although this might not to be excluded a priori if more people meant an increased habitat heterogeneity, which might then enable the coexistence of more species). In order to adopt an impacts-framed approach, baseline data on bird species richness prior to human modification of the landscape would be needed. Such data are unavailable, and in Italy widespread human impacts on flora and fauna go back to at least Ancient Roman times.
Italy is indeed an ancient seat of civilization (Astour Reference Astour1985; Celecia Reference Celecia1997; Malone Reference Malone2003; Pellecchia et al. Reference Pellecchia, Negrini, Colli, Patrini, Milanesi, Achilli, Bertorelle, Cavalli-Sforza, Piazza, Torroni and Ajmone-Marsan2007) and a country with relatively high human population density (more than five times greater than the USA, although roughly half that of England; Pautasso and Weisberg Reference Pautasso and Weisberg2008). At the same time, Italy is situated in the Mediterranean hotspot of plant biodiversity, has a wide range of habitats, from alpine ecosystems to coastal marshes, and hosted many relict patches of woodland during the last glaciations (Caldecott et al. Reference Caldecott, Jenkins, Johnson and Groombridge1996; Cowling et al. Reference Cowling, Rundel, Lamont, Arroyo and Arianoutsou1996; Malcolm et al. Reference Malcolm, Liu, Neilson, Hansen and Hannah2006). From an ornithological point of view, with more than 450 reported species, Italy is one of the most species-rich European countries (Fauna Europaea 2004).
This analysis shows a substantial spatial co-occurrence of people and avian biodiversity in Italy's regions. Moreover, Italian regions with higher proportion of protected areas tend to have fewer avian species than those with a lower proportion of protected territory. The finding of an increase in total bird species richness in Italy's regions with increasing human population size is consistent with previous reports from other regions of a positive spatial correlation of people and biodiversity over large spatial scales (for example Araújo Reference Araújo2003; Gaston Reference Gaston2005; Pautasso Reference Pautasso2007). For total bird species richness (comprising not only breeding species but also migrants and vagrants), this positive correlation is robust to variations in area, latitude and proportion of protected areas amongst Italian regions. Mechanisms that have been proposed to explain such a coincidence of high numbers of species and people are essentially of two kinds.
People have probably tended to settle and flourish in areas of more favourable climate, and these regions with longer growing season and energy availability are frequently those where species richness is also higher (Gardezi & Gonzalez Reference Gardezi and Gonzalez2008; Harrison et al. Reference Harrison, Viers, Thorne and Grace2008; Field et al. Reference Field, Hawkins, Cornell, Currie, Diniz-Filho, Guegan, Kaufman, Kerr, Mittelbach, Oberdorff, O'Brien and Turner2009). This follows from the often reported positive relationship between species richness and environmental productivity (for birds, Hawkins et al. Reference Hawkins, Porter and Diniz-Filho2003; Ding et al. Reference Ding, Yuan, Geng, Koh and Lee2006; Koh et al. Reference Koh, Lee and Lin2006; Mönkkönen et al. Reference Mönkkönen, Forsman and Bokma2006; Lepczyk et al. Reference Lepczyk, Flather, Radeloff, Pidgeon, Hammer and Liu2008). Additionally, people have often increased the number of species present in regions of high human presence with species introductions and habitat modifications (Benton et al. Reference Benton, Vickery and Wilson2003; Tait et al. Reference Tait, Daniels and Hill2005; La Sorte et al. Reference La Sorte, McKinney and Pysek2007). However, variation in the main habitat types (mountain, forest and agricultural area) does not seem to play a role in the observed patterns, as none of these proportions was a significant factor in the models of bird species richness as a function of human population size, area, latitude and proportion of protected area.
There is also no evidence that the presence of human-adapted bird species could explain the positive relationship between total bird species richness and human population size, as all Italian regions report the presence of these relatively few species. Similarly, there is no evidence that the presence of human-avoiding bird species might decline with increasing human population size in spite of an overall positive trend, as this category of bird species appears to contribute to that positive trend. The contribution of exotic species to the reported patterns is likely to be negligible, as in this country there are very few introduced bird species, even in urbanized areas (Clergeau et al. Reference Clergeau, Croci, Jokimäki, Kaisanlahti-Jokimäki and Dinetti2006). Currently, 26 exotic bird taxa are reported in Italy, but none of these is abundant or widespread, and only eight species are considered in the national bird checklist (Andreotti et al. Reference Andreotti, Baccetti, Perfetti, Besa, Genovesi and Guberti2001; Gariboldi et al. Reference Gariboldi, Andreotti and Bogliani2004). Only a few of these species are believed to be able to pose a future threat to native bird biodiversity (Leiothrix lutea, Oxyura jamaicensis, Psittacula krameri and Threskiornis aethiopicus).
There is evidence that the increase in overall bird species richness with human population size is not caused by a correlation of breeding species richness with human presence, but by migrant and occasional bird species. Breeding bird species are more affected by detrimental human activities than migrant and vagrant species as they require a more reliable source of resources (Levey & Stiles Reference Levey and Stiles1992). At first sight, there is a correlation between breeding bird species richness and human population size (Fig. 3a), but this is not significant when controlling for region area, latitude and proportion of protected areas; this shows that positive species-people correlations may disappear when controlling for confounding factors. It is possible that a sampling effect may apply to species occasionally sighted; regions with higher numbers of people might have a higher presence of ornithologists and thus a higher chance of rare species being spotted. However, there is independent evidence for birds in Britain and vascular plants in the USA that variations in sampling effort might not explain the observed positive species-people correlations (Evans et al. Reference Evans, Greenwood and Gaston2007; Pautasso & McKinney Reference Pautasso and McKinney2007).
There is also a mismatch between overall and breeding bird species richness in relation to latitude. Whereas overall bird species richness does not vary significantly with latitude, possibly as a consequence of the narrow range of variation in latitude amongst Italian regions (Fattorini Reference Fattorini2006), breeding bird species richness increases significantly with latitude, in contrast to the commonly observed pattern in natural ecosystems (but see Rabenold Reference Rabenold1979). This reversed latitudinal gradient of Italian breeding bird species richness is possibly a consequence of the peninsular shape of Italy (Massa Reference Massa1982; Battisti & Contoli Reference Battisti and Contoli1995). Interestingly, a reversed latitudinal gradient also occurs for the species richness of veteran trees in Italy (Pautasso & Chiarucci Reference Pautasso and Chiarucci2008). For both birds and trees, more northern Italian regions, in spite of the presence of the Alps, are connected to the pool of species which is present in Central Europe, whereas southern regions are isolated from other areas with similar climate by the presence of the Mediterranean Sea. There is no evidence that broad variations in habitat type could play a role in this reversed latitudinal gradient, as the proportions of mountain, forest and agricultural area did not significantly vary with variations in latitude amongst Italian regions. We also did not observe any significant association of breeding bird species richness with the altitudinal range of Italian regions, in spite of an overall trend for this range to increase with increasing latitude.
Both for total and for breeding bird species richness there is a significant decrease with increasing proportion of protected areas. It is unlikely that protected areas are causing a decrease in bird species richness: protected areas have been shown to be successfully preserving the presence of natural habitats in Lombardy, one of the most urbanized Italian regions (Canova Reference Canova2006). Within that region, protected areas have significantly more bird species than control zones in the surroundings, although surrounding land use can have a negative influence on biodiversity inside protected areas (Canova Reference Canova2006). However, our interregional analysis shows that regions with higher proportion of protected areas tend to have fewer bird species. This is likely to be a consequence of the historical choice of areas of relatively low human density for many natural reserves, despite the role of human activities in the preservation of Italian biodiversity (Hall Reference Hall, Agnoletti and Anderson2000; Maiorano et al. Reference Maiorano, Falcucci, Garton and Boitani2007; see also Battisti & Gippoliti Reference Battisti and Gippoliti2004). Less populated areas are of conservation importance because of their wilderness status and the low impact of human activities, but do not tend to harbour more species than regions with higher presence of human settlements. This issue is of relevance to many regions of the world, such as Nepal (Hunter & Yonzon Reference Hunter and Yonzon1993), the USA (Parks & Harcourt Reference Parks and Harcourt2002; McKinney Reference McKinney2005; Hopton & Mayer Reference Hopton and Mayer2006), Australia (Luck Reference Luck2007) and Finland (Virkkala & Rajasarkka Reference Virkkala and Rajasarkka2007). A negative correlation of bird species richness with the presence of protected areas makes it important that the whole landscape be considered for conservation activities, a policy also endorsed in the European Landscape Convention (Dejeant-Pons Reference Dejeant-Pons2006). The positive correlation of total bird species with human population size poses a challenge for such activities, but makes increasing people's awareness of bird biodiversity in Italy easier. A large-scale spatial co-occurrence of people and biodiversity is in this respect an important finding, because conservation efforts are ultimately only supported if the majority of the population has a sufficient environmental education (Turner et al. Reference Turner, Nakamura and Dinetti2004; Miller Reference Miller2005; Dinetti Reference Dinetti2006).
Italian regions with a larger human population size also have a higher number of threatened bird species, but this positive association can be explained by the positive correlation between the number of threatened species and overall bird species richness. Regions with more people have a higher number of threatened bird species because they also have a higher total number of bird species; there is no evidence for a further effect of human population size in addition to that association. Together with the positive association of total bird richness and human population size, this result implies that, over a regional scale, human settlements can coexist with bird biodiversity in this country. In Italy, humans and birds have coexisted for millennia in a mainly agricultural landscape (Bertollo Reference Bertollo2001; Laiolo Reference Laiolo2005; Giupponi et al. Reference Giupponi, Ramanzin, Sturaro and Fuser2006). Although some Italian regions have remarkably high overall human densities (Lombardy, Campania and Lazio have > 300 inhabitants per km2; Table 1), which might translate into a strong human impact on ecosystems, human settlements are concentrated in some areas and scattered in others, thus still providing some room for semi-natural ecosystems even in strongly urbanized regions (Lorenzetti & Battisti Reference Lorenzetti and Battisti2007).
This analysis shows a spatial coincidence of bird biodiversity and human presence using Italy as the study extent, and its different regions as the study grain. Previous studies have documented the co-occurrence of people and habitat patches of conservation value in single Italian regions (such as Lombardy; Bani et al. Reference Bani, Baietto, Bottoni and Massa2002, Reference Bani, Massimino, Bottoni and Massa2006; Canova Reference Canova2006). Other local to intraregional scale studies in Italy, mainly involving lichens, have shown the widespread presence of anthropogenic impacts (Loppi et al. Reference Loppi, Ivanov and Boccardi2002; Nali et al. Reference Nali, Crocicchi and Lorenzini2004; Frati et al. Reference Frati, Caprasecca, Santoni, Gaggi, Guttova, Gaudino, Pati, Rosamilia, Pirintsos and Loppi2006; Giordani Reference Giordani2007). Land-use change potentially has a profound impact on Italy's biodiversity (Gomarasca et al. Reference Gomarasca, Brivio, Pagnoni and Galli1993; Andreone & Luiselli Reference Andreone and Luiselli2000; Maiorano et al. Reference Maiorano, Falcucci and Boitani2006; Falcucci et al. Reference Falcucci, Maiorano and Boitani2007) given the overlap, but also the peculiarities of the fauna and flora in different regions, and the differing levels of human impact.
Rapid urbanization and sprawl following World War II (Rolando et al. Reference Rolando, Maffei, Pulcher and Giuso1997; Zapparoli Reference Zapparoli1997; Sorace Reference Sorace2001; Lorenzetti & Battisti Reference Lorenzetti and Battisti2006; Sorace & Gustin Reference Sorace and Gustin2008), as well as the abandonment of marginal land (Farina Reference Farina1997; Laiolo et al. Reference Laiolo, Dondero, Ciliento and Rolando2004; Rossi et al. Reference Rossi, Pecci, Amadio, Rossi and Soliani2007; Tasser et al. Reference Tasser, Walde, Tappeiner, Teutsch and Noggler2007), are likely to have affected ecosystems throughout the country. There is concern about agricultural intensification in fertile areas and neglect of traditionally cultivated sub-fertile areas. Together with the negative interregional correlation of bird biodiversity and proportion of protected area, the positive correlation of human population size and bird biodiversity suggests that, in order to achieve the European objective of halting biodiversity loss by 2010 (Mace & Baillie Reference Mace and Baillie2007), the current network of Italian protected areas needs to be integrated with more sustainable land-use at the whole landscape level.
ACKNOWLEDGEMENTS
We thank the many people involved in the compilation of bird checklists for Italy's regions, I. Currado, D. Fontaneto, K. Gaston, T. Hirsch, O. Holdenrieder, M. Jeger, M. McKinney, M. Sighele, L. Vazquez, P. Weisberg and M. Zotti for insights and discussions, and M. Boots, L. Canova, C. Celada, R. Donnelly, T. Matoni, C. Thomas and G. Wilson for helpful comments on a previous draft.