Depression is a common mental illness and is considered a major public health issue, affecting approximately 264 million people worldwide according to the WHO(Reference Getie, Ayalneh and Bimerew1,Reference Mejareh, Abdollahi and Hoseinipalangi2) . According to the National Cancer Institute, cancer survivors are defined as individuals who have been diagnosed with cancer, from the time of diagnosis through the balance of life(3). Previous studies(Reference Mejareh, Abdollahi and Hoseinipalangi2,Reference Ostovar, Modarresi and Mohd4,Reference Götze, Friedrich and Taubenheim5) have shown that a significant proportion of cancer survivors suffer from depression. In Southeast Asia, the prevalence of depression among patients with different types of cancers was reported to range from 3 % to 65·5 %(Reference Ostovar, Modarresi and Mohd4). A cross-sectional cohort study found that 17 % of cancer survivors experienced moderate to severe depression 5–10 years after diagnosis(Reference Götze, Friedrich and Taubenheim5). Besides, according to a systematic review covering 183 studies, approximately 27 % of cancer patients suffered from depression(Reference Mejareh, Abdollahi and Hoseinipalangi2). Given these findings, it is necessary to explore modifiable factors associated with depressive symptoms among cancer survivors.
Growing evidence indicates that lifestyle factors play an important role in depression(Reference Kunugi6). It is increasingly recognised that diet and dietary bioactive components are important modifiable factors for various mental disorders, including depression(Reference Jahan-Mihan, Stevens and Medero-Alfonso7). Current studies have shown that low concentrations of essential mineral elements in the body may contribute to the onset or worsening of depression(Reference Majewska and Orywal8). A meta-analysis found that supplementation with multivitamins/minerals (including Ca, Mg, Zn, vitamin D, etc.) has a positive effect on mood and mild mental symptoms in healthy individuals(Reference Long and Benton9). Furthermore, a lack of minerals such as Ca, Mg, Fe and Zn in the daily diet has been reported to be associated with an increased risk of depression and other behavioural disorders(Reference Majewska and Orywal8).
Ca is one of the most important minerals in the human body. Its only source is external intake(Reference Shen, Gu and Liu10,Reference Weaver and Peacock11) (such as diet and Ca supplements), and it is widely found in food such as dairy products, beans and vegetables(Reference Farré12). However, research reported that nearly half of the world’s population does not consume enough dietary Ca(Reference Shlisky, Mandlik and Askari13). Insufficient Ca intake can be associated with a variety of health issues, such as osteoporosis, pregnancy complications, cancers, cardiovascular or cerebrovascular diseases and mental health disorders(Reference Shlisky, Mandlik and Askari13–Reference Du, Hsiao and Ludy15). Therefore, it is important to investigate the potential relationship between Ca intake and related diseases.
Previous studies(Reference Du, Hsiao and Ludy15,Reference Jiang, Yan and Li16) have shown that there may be a link between Ca and mental health, but there is little research on this particular population of cancer survivors. Considering that cancer survivors may face unique challenges including treatment-related appetite changes, gastrointestinal symptoms, endocrine therapy (e.g., aromatase inhibitors), bone health concerns, chronic fatigue, systemic inflammation and psychological burden, all of which may affect both nutritional status and mental health(Reference Götze, Friedrich and Taubenheim5,Reference Shakhshir, Samara and Zahdeh17–Reference Bye, Balstad and Ervik Raaness21) , the overall aim of this study was to explore the association between the estimated total Ca intake and depressive symptoms among cancer survivors in the USA. Specifically, the following research questions were mainly addressed: (1) Is there an inverse association between total Ca intake and depressive symptoms among cancer survivors in the USA? (2) Do lifestyle, chronic diseases or other clinical factors modify the magnitude of this association?
Materials and methods
Data sources and study population
The data from six consecutive National Health and Nutrition Examination Survey (NHANES) cycles (2007–2018) were analysed. In this analysis, cancer survivors were identified based on the question ‘Have you ever been told by a physician or other health professional that you had cancer or a malignancy of any kind?’, and those who answered ‘Yes’ were classified as cancer survivors(Reference Medina, Liu and Cao22). Due to the age limitation in the cancer questionnaire designed in NHANES, the individuals younger than 20 years old and those with missing depressive symptoms data or total Ca intake data were excluded. In addition, those with missing covariates and extremely high total Ca intake values(Reference Shen, Gu and Liu10) (99th percentile; >3290·7 mg/day, n 23) were also excluded. Ultimately, 2204 cancer survivors were included in the study (Figure 1).
The flow chart of inclusion and exclusion process in this study.

The NHANES survey is organised and implemented by the National Center for Health Statistics. All surveys were approved by the Research Ethics Review Board, and written informed consent was obtained from all participants(Reference Bhargava, Lee and Smith23,Reference Nicastro, Bailey and Dodd24) . Since this study used publicly available and anonymous datasets, no additional ethical approval was required.
Depressive symptoms assessment
Depressive symptoms were assessed using the Patient Health Questionnaire-9. It is a screening tool consisting of nine questions that ask participants to rate their depressive symptoms including low mood, sleep disturbances and others over the past 2 weeks, and each question is scored on a scale of 0 to 3, with a total score ranging from 0 to 27(Reference Kroenke, Spitzer and Williams25). In this study, a score of 5 or higher was classified as indication of having depressive symptoms(Reference Kroenke, Spitzer and Williams25–Reference Bigman27). And the severity of depressive symptoms was categorised as follows: none = score 0 to 4, mild = score 5 to 9, moderate = score 10 to 14, moderately severe = score 15 to 19 and severe = score 20 to 27(Reference Kroenke, Spitzer and Williams25,Reference Voelker, Wang and Tang26) .
Total calcium intake
All dietary data in this study were obtained from the 24-h dietary recall in NHANES. Dietary information was collected through two 24-h dietary recall interviews. The first interview was conducted at a mobile examination center, while the second was conducted by telephone interview 3–10 days later(Reference Gahche, Bailey and Potischman28). The data used in this study were from the first 24-h recall. Dietary Ca intake was obtained from the first 24-h dietary recall, which assessed the intake of various nutrients from all foods and beverages consumed by participants in the 24 h prior to the interview(Reference Ahluwalia, Dwyer and Terry29). Information on Ca supplement use was obtained from the dietary supplement questionnaire, which collected data on the types and amounts of dietary supplements consumed during the 24-h period prior to the interview(30). In this study, total Ca intake was defined as the sum of dietary Ca and supplemental Ca.
Covariates
To examine the independent association between total Ca intake and depressive symptoms, we adjusted for potential confounders including socio-demographic characteristics, behavioural factors, health status, serological indicators and cancer-related clinical factors informed by literature(Reference Shen, Gu and Liu10,Reference Bao, Li and Guo31–Reference Yang, Shi and Zeng33) and clinical practice. Socio-demographic factors included age (≥20 years), sex (male, female), race (non-Hispanic White, non-Hispanic Black, Mexican American, other) and education (below high school, high school, above high school)(Reference Francis, Zhang and Witrick34). Marital status was categorised as married (including those living with partner) and unmarried (including widowed, divorced, separated and never married)(Reference Wang, Cheng and Zhang35). Household income was classified into the following four groups based on the poverty income ratio (PIR): poor (PIR < 1), near poor (1 ≤ PIR < 2), moderate income (2 ≤ PIR < 4) and high income (PIR ≥ 4)(Reference Liu, Al-Sayegh and Jabrah36).
Behavioural factors included BMI, smoking, alcohol consumption, physical activity, sleep problems, vitamin D intake, energy intake and caffeine intake. BMI was classified into four groups: underweight (<18·5), normal weight (18·5 ≤ BMI < 25), overweight (25 ≤ BMI < 30) and obese (≥30)(Reference Shen, Gu and Liu10). Smoking status was based on the question ‘Have you smoked at least 100 cigarettes in your entire life?’. Individuals who answered ‘Yes’ were classified as smokers, and those who answered ‘No’ as non-smokers. Alcohol consumption was classified as drinking or non-drinking. For 2007–2016 participants, individuals reporting ≥12 drinks in one year or ≥12 drinks in their lifetime were considered drinkers, otherwise, they were classified as non-drinkers. For 2017–2018 participants, those who reported ever having at least one alcoholic drink were classified as drinkers, and others as non-drinkers. Physical activity was classified into three groups based on the metabolic equivalent task scores: inactive (0 metabolic equivalent task-min/week), insufficiently active (1–599 metabolic equivalent task-min/week) and sufficiently active (≥600 metabolic equivalent task-min/week)(Reference Wei, Min and Xiang37). Sleep problems were estimated through the question ‘Have you ever told a doctor or other health professional that you have trouble sleeping?’. Participants responding ‘Yes’ were classified as having sleep problems, and those responding ‘No’ as not having sleep problems. Vitamin D, caffeine, and energy intakes were all obtained from the first 24-h dietary recall and included both dietary sources and supplements.
Health conditions included hypertension, diabetes, CVD and use of antidepressant drugs. Hypertension and diabetes were both diagnosed based on having been informed by a doctor or other health professional(Reference Shen, Gu and Liu10). CVD was defined as self-reported physician diagnosis of heart failure, coronary heart disease, angina, heart attack or stroke. Use of antidepressants was determined based on participants’ reported prescription medicine use. Participants were asked whether they had taken any prescription drugs in the past 30 days and were required to provide information like drug names(Reference Elmore, Omofuma and Sevoyan38). If participants reported taking any class of antidepressants [selective serotonin reuptake inhibitors, serotonin-norepinephrine reuptake inhibitors, tricyclic antidepressants, etc.], antidepressant use was classified as ‘Yes’; otherwise, it was classified as ‘No’(Reference Meshkat, F Duffy and K Tassone39). Serologic indicators included liver and renal functions, albumin, serum vitamin D and Ca levels. Liver function was estimated by alanine aminotransferase and aspartate aminotransferase, and renal function was assessed by estimated glomerular filtration rate.
Cancer-related clinical factors included cancer types, time since cancer diagnosis and use of antineoplastic agents. Referring to previous studies(Reference Wei, Min and Xiang37,Reference Xie, Liu and Ma40) , we further divided cancer types into more detailed categories including respiratory, digestive, blood and lymphatic, urinary, male reproductive, female genital, breast, thyroid, skin and other cancers based on the medical condition questionnaire, and participants with two or more types were categorised separately as multiple types of cancers. Time since cancer diagnosis was calculated as age minus the year of cancer diagnosis and was further classified as ≤5 years, 6–10 years and ≥11 years. Use of antineoplastic agents was determined based on the self-reported prescription medication use, similar to antidepressants. Participants reporting use of any antineoplastic agent were classified as ‘Yes’, and those reporting no such use were classified as ‘No’.
Statistical analysis
All statistical analyses were conducted using R software (version 4.5.0), and we used the first 24-h dietary recall sample weights (WTDRD1) to account for the complex, multistage, stratified sampling design of NHANES. Continuous variables with normal distributions were presented as means and sds, whereas non-normally distributed variables were presented as medians and interquartile ranges. Categorical variables were presented as frequencies and percentages. For comparisons of characteristics across groups, the Kruskal–Wallis test and one-way ANOVA were used for continuous variables, and the χ 2 test was used for categorical variables. Estimated total Ca intake was categorised into four ranges based on quartiles: Q1 (≤606·5 mg/day), Q2 (606·5–962·5 mg/day), Q3 (962·5–1476·0 mg/day) and Q4 (>1476·0 mg/day). The weighted proportion of participants with one-day total Ca intake below the age- and sex-specific recommended dietary allowance (RDA) among cancer survivors, along with 95 % CI, were calculated using the R survey package, with the RDA derived from the dietary reference intakes established by the Institute of Medicine(Reference For and Calcium41).
The relationship between total Ca intake and odds of depressive symptoms was assessed using univariate and multivariate logistic regression analyses, and four models were constructed: model 1 was unadjusted; model 2 was adjusted for age and sex; model 3 further adjusted for hypertension, diabetes and CVD based on model 2; model 4 adjusted all variables, including age, sex, race, education, income, marital status, history of underlying diseases, antidepressants, BMI, smoking, drinking, sleep problems, physical activity, intakes of vitamin D, caffeine and energy, cancer types, time since cancer diagnosis, antineoplastic agents, alanine aminotransferase, aspartate aminotransferase, estimated glomerular filtration rate, albumin, serum vitamin D and serum Ca levels.
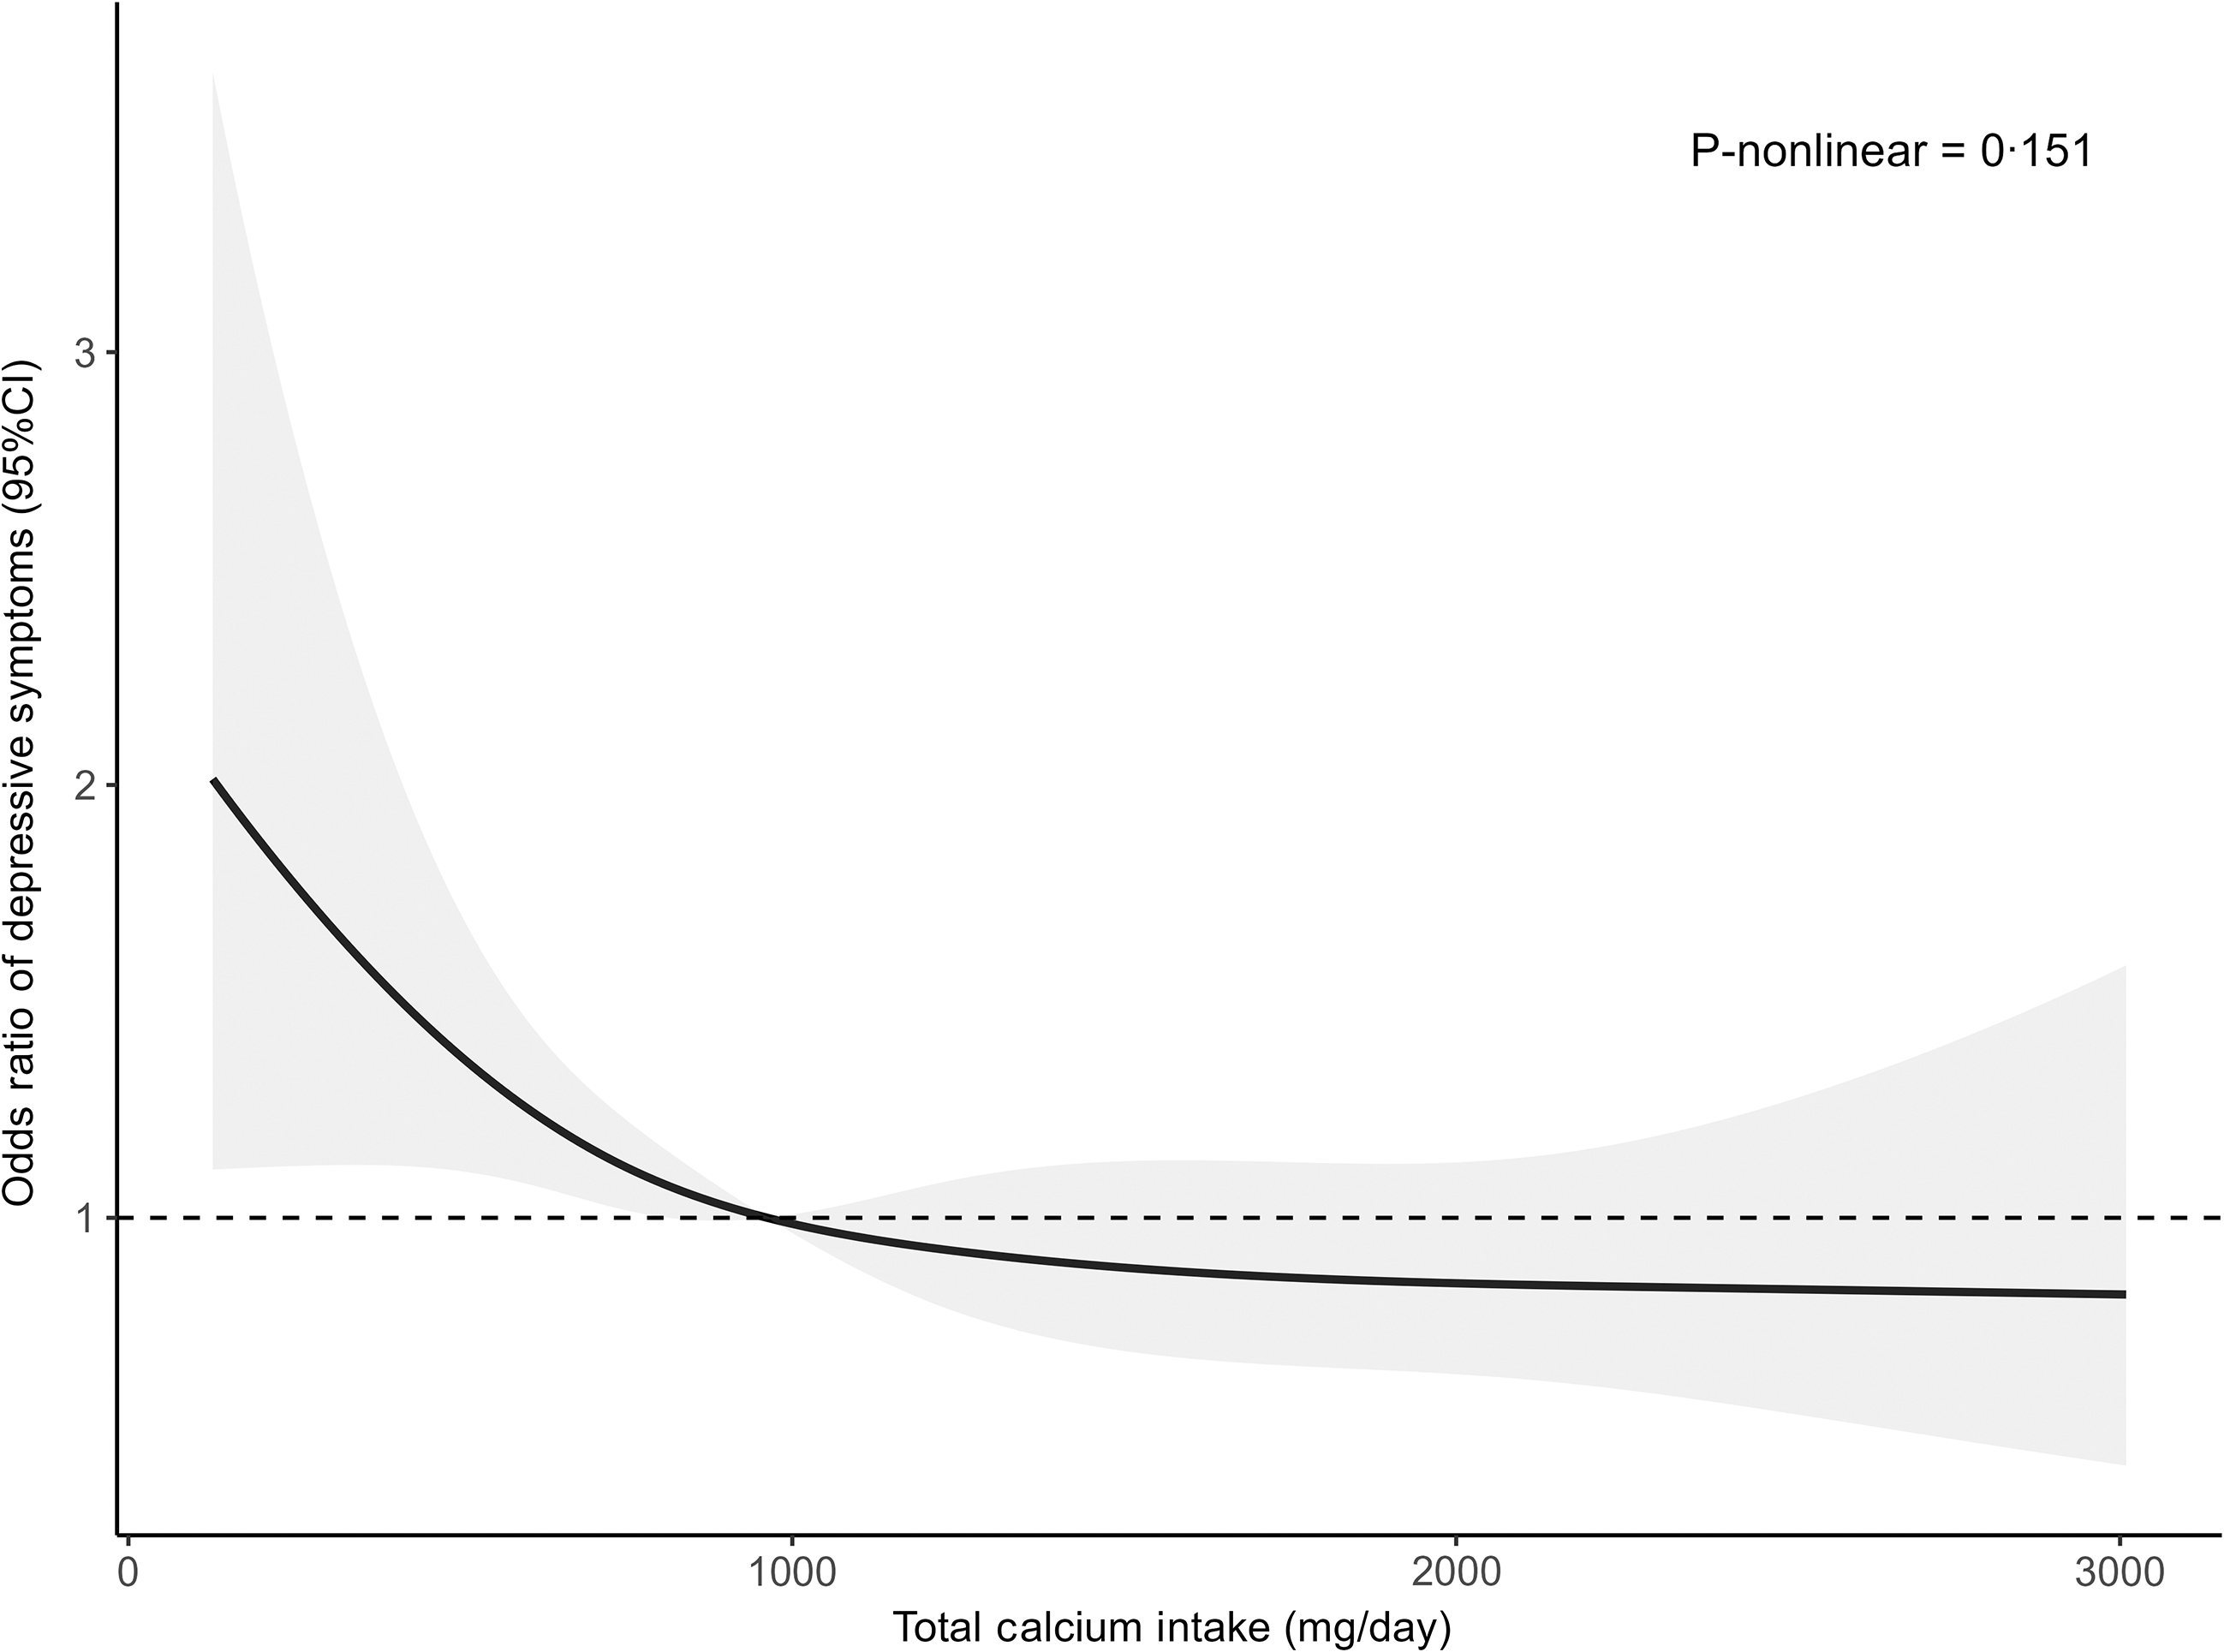
To examine the potential nonlinear association between total Ca intake and depressive symptoms, total Ca intake (mg/day) was modeled as a continuous variable in the restricted cubic spline analysis after adjusting for all confounders. The median total Ca intake was used as the reference value. Knots were placed at the 5th, 35th, 65th and 95th percentiles of the distribution. A two-sided P value < 0·05 was considered statistically significant.
Sensitivity analyses
In addition, we conducted two sensitivity analyses. First, we performed subgroup analyses to explore whether the association between total Ca intake and depressive symptoms varied across different subgroups. Each subgroup was fully adjusted for covariates except for the specific stratification variable. The likelihood ratio test was used to determine whether the difference between models with and without interaction terms was statistically significant. To account for the elevated risk of type I error due to multiple testing in subgroup analyses, we applied Bonferroni correction to the results of the interaction tests. Specifically, the interaction tests involved twenty-one major subgroups, and the corrected significance level was p < 0·0024 (α = 0·05/21). Subgroup analyses were not conducted for certain variables (e.g., alcohol consumption and medication use), as the sample size within a specific subgroup of these variables was insufficient.
Second, to control the confounding effect of menopause on the results, we additionally adjusted for menopausal status. Based on previous literature(Reference Li and Zhang42–Reference Wang, Liu and Zhou44), we used two questions from the NHANES Reproductive Health Questionnaire to assess menopausal status: (1) had regular periods in the past 12 months and (2) reason for not having regular periods. In this study, menopausal status included natural menopause as well as menopause induced by surgery (hysterectomy and oophorectomy), medical conditions, treatments or other causes, but did not include temporary cessation of menstruation due to pregnancy or breast-feeding. Female participants aged ≥55 years were directly presumed to be postmenopausal, regardless of their responses to the two aforementioned questions.
Results
Basic characteristics of the study populations
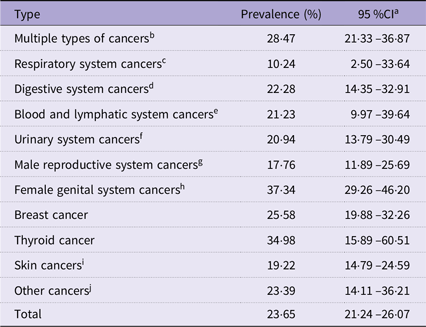
There were 2204 cancer survivors recruited in this study, including 1045 men and 1159 women. The participants were divided into four groups based on total Ca intake, and their basic characteristics are summarised in Table 1. There were statistically significant differences in age, race, education, family income, serum vitamin D and Ca levels, vitamin D intake, liver function, albumin, diabetes, CVD, alcohol consumption, antidepressant use, depressive symptoms, energy intake, cancer types and antineoplastic agents use among the four groups. Lower total Ca intake was more prevalent among individuals with low vitamin D intake, low serum albumin levels, lower household income and diabetes, whereas higher total Ca intake was typically seen in non-Hispanic Whites, those with higher education levels and higher household income. Among all participants, 25·6 % were classified as having depressive symptoms, with moderate to severe depressive symptoms accounting for 9·7 %. After weighted analysis, the prevalence of depressive symptoms among cancer survivors in the US was 23·7 % (95 % CI: 21·2 %, 26·1 %), and cancer types with a higher prevalence of depressive symptoms were female genital and thyroid cancers (Table 2).
Baseline characteristics of participants Grouped by total calcium intake

Table 1. Long description
The table presents baseline characteristics of 2204 cancer survivors grouped by total calcium intake. It includes 17 rows and 14 columns. Column headers are Characteristics, Total Calcium Intake (mg/day), Q1 (n 551), Q2 (n 551), Q3 (n 550), Q4 (n 552), and p-value. Row labels include Age, Serum vitamin D (nmol/L), Serum Ca (mmol/L), Vitamin D intake (ug/day), Caffeine intake (mg/day), ALT (U/L), eGFR, Albumin (g/dL), AST (U/L), Gender Female, Race, Education, Income (PIR), Diabetes Yes, Hypertension Yes, Cardiovascular disease Yes, Smoking Yes, Alcohol consumption Yes, Physical activity (MET), BMI, Under weight, Normal weight, Over weight, Obese, Antidepressant Yes, Sleep problems Yes, Depressive symptoms Yes, Energy intake (kcal/day), Cancer type, Time since cancer diagnosis, Antineoplastic agents Yes. Each row provides median or percentage values for each quartile of calcium intake and p-values indicating statistical significance. Notable trends include variations in age, race, education, income, serum vitamin D and Ca levels, vitamin D intake, liver function, albumin, diabetes, cardiovascular disease, alcohol consumption, antidepressant use, depressive symptoms, energy intake, cancer types, and antineoplastic agents use among the four groups.
Q1a, Ca intake is lower than or equal to 606.5 mg/day.
Q2b, Ca intake ranges from higher than 606.5 mg/day to lower than or equal to 962.5 mg/day.
Q3c, Ca intake ranges from higher than 962.5 mg/day to lower than or equal to 1476.0 mg/day.
Q4d, Ca intake is higher than 1476.0 mg/day.
P-valuee, P value obtained from the Kruskal–Wallis test, one-way ANOVA or the chi-square test.
ALTf, alanine aminotransferase.
eGFRg, estimated glomerular filtration rate (mL/min/1.73 m2).
ASTh, aspartate aminotransferase.
PIRi, the poverty income ratio.
METj, the metabolic equivalent task scores.
BMIk, body mass index.
Prevalence of depressive symptoms across cancer types

Table 2. Long description
A table showing the prevalence of depressive symptoms across different types of cancers. The table has 12 rows and 3 columns. The columns are labeled Type, Prevalence (percent), and 95 % CI. The rows list various types of cancers and their corresponding prevalence percentages and confidence intervals. For example, Multiple types of cancers have a prevalence of 28–47 % with a 95 % CI of 21–33 to 36–87. Respiratory system cancers have a prevalence of 10–24 % with a 95 % CI of 2–50 to 33–64. The table provides detailed data on the prevalence of depressive symptoms for each cancer type.
95 %CIa, 95 % confidence interval.
Multiple Types of Cancersb, two or more types of cancer.
Respiratory System Cancersc, cancers of lung and larynx.
Digestive System Cancersd, cancers of oesophagus, stomach, liver, gallbladder, pancreas, colon and rectum.
Blood and Lymphatic System Cancerse, cancers of blood, leukaemia, lymphoma/ hodgkin’s disease.
Urinary System Cancersf, cancers of bladder and kidney.
Male Reproductive System Cancersg, cancers of prostate and testis.
Female Genital System Cancersh, cancers of cervix, ovary and uterus.
Skin Cancersi, cancers of melanoma, skin (non-melanoma and don’t know what kind).
Other Cancersj, cancers of bone, brain, nervous system, mouth, soft tissue (muscle or fat) and others.
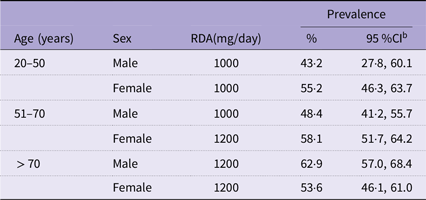
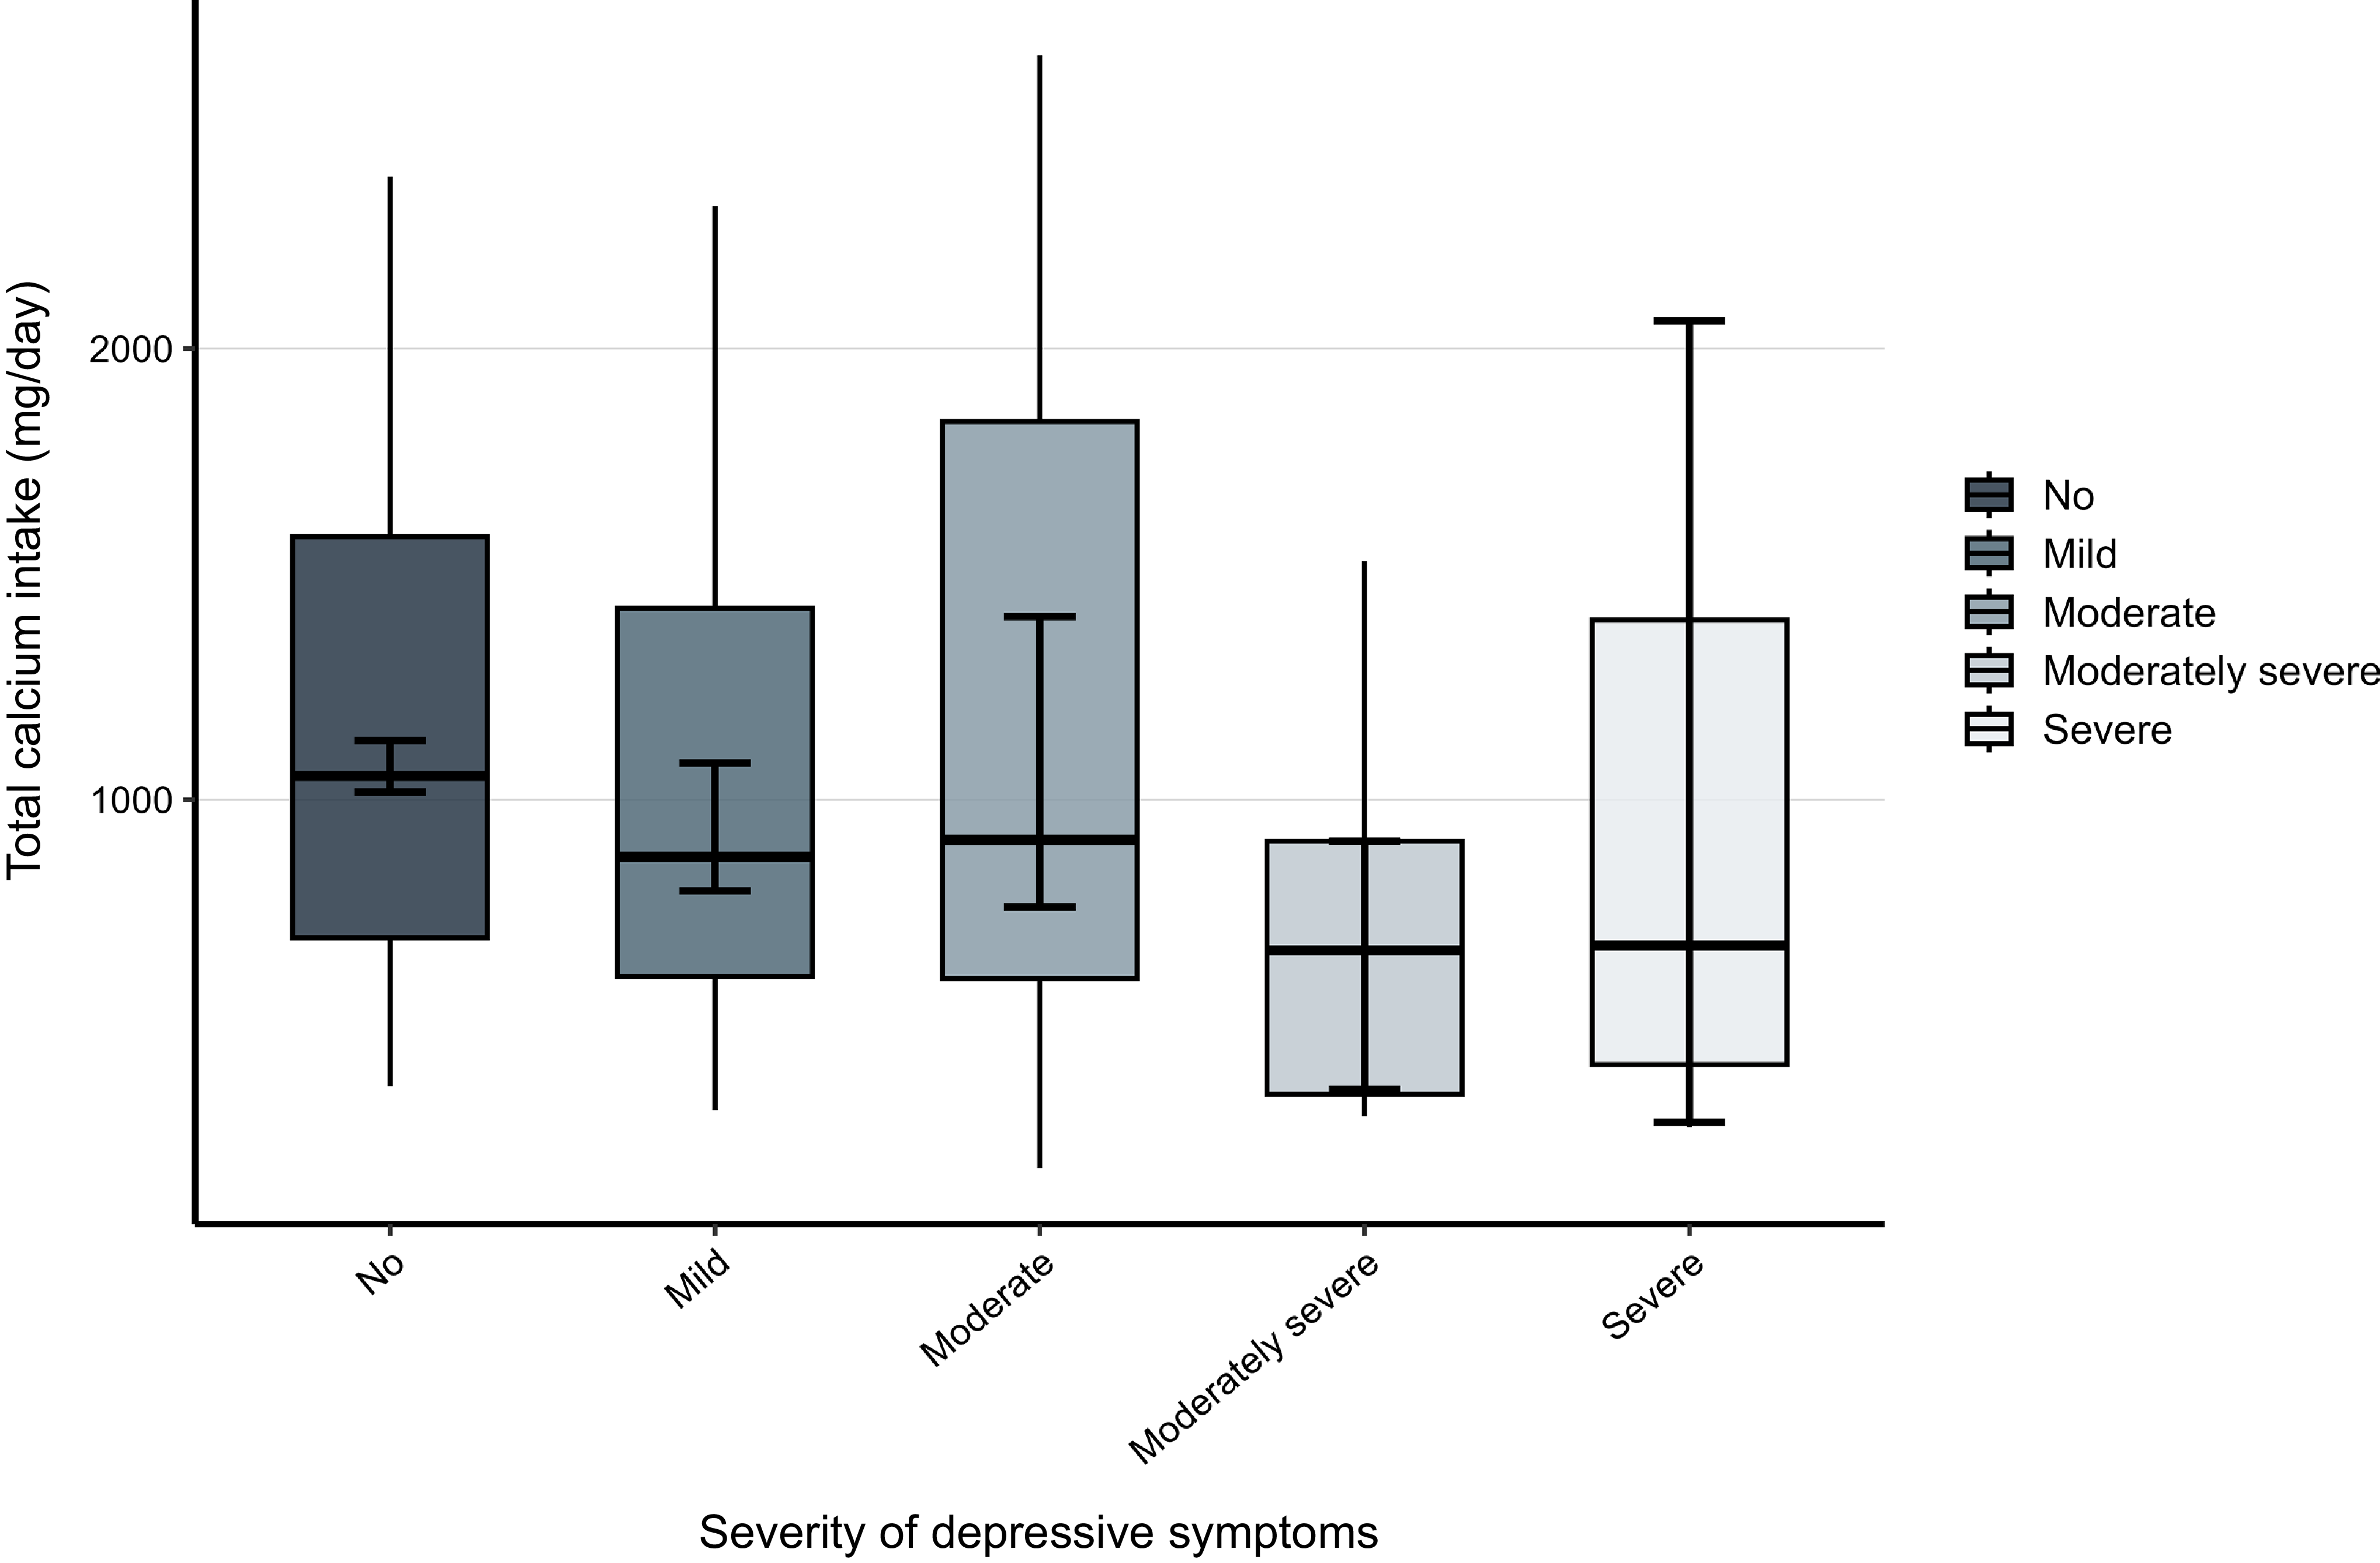
Table 3 presents the proportion of participants with one-day total Ca intake below the age- and sex-specific RDA. After stratifying cancer survivors by age and sex, the proportion of participants with one-day total Ca intake below the RDA was highest [62·9 % (95 % CI: 57·0 %, 68·4 %)] among those aged over 70 years and lowest [43·2 % (95 % CI: 27·8 %, 60·1 %)] among those aged 20–50 years in male cancer survivors, whereas in female survivors, the highest prevalence [58·1 % (95 % CI: 51·7 %, 64·2 %)] was observed in the 51–70 years age group. In addition, total Ca intake among cancer survivors with varying degrees of depressive symptoms was analysed, as shown in Figure 2. With increasing severity of depressive symptoms, total Ca intake showed a declining trend generally. This distribution suggested that there could be a potential correlation between total Ca intake and depressive symptoms among cancer survivors.
Proportion of participants with one-day total calcium intake below the age- and sex-specific RDAa among cancer survivors

Table 3. Long description
A table comparing the proportion of participants with one-day total calcium intake below the age- and sex-specific Recommended Dietary Allowance (RDA) among cancer survivors. The table has 3 rows and 4 columns. Column headers are Age (years), Sex, RDA (mg/day), and Prevalence (%). Row labels include age groups 20-50, 51–70, and over 70, with further division by sex (Male, Female). Each row provides the RDA in mg/day and the prevalence percentage with a 95 percent Confidence Interval (CI). Notable trends include the highest prevalence among males over 70 years (62.9 %) and the lowest among males aged 20–50 years (43.2 %). Among females, the highest prevalence is in the 51–70 years age group (58.1 %), and the lowest is in the > 70 years age group (53.6 %).
RDAa, the Recommended Dietary Allowance from the Dietary Reference Intakes established by the Institute of Medicine.
95 %CIb, 95 % confidence interval.
Distribution of total Ca intake by severity of depressive symptoms.

Total calcium intake is associated with depressive symptoms
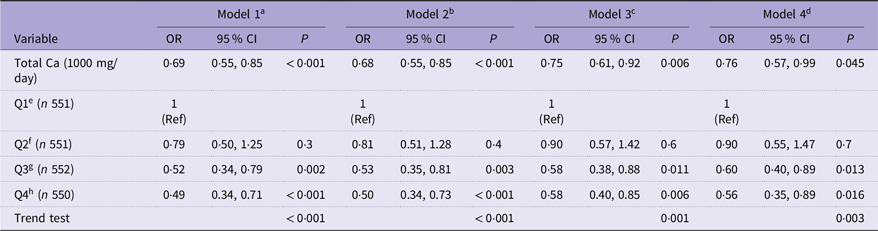
Logistic regression analyses of four models are presented in Table 4. In the unadjusted model, each 1000 mg/day increase in total Ca intake was associated with a 31 % (OR: 0·69, 95 % CI: 0·55, 0·85) lower odds of depressive symptoms. Similar trends were observed in model 2 and model 3. After adjustment for all covariates in model 4, each 1000 mg/day increase in total Ca intake was correlated with a 24 % (OR: 0·76, 95 % CI: 0·57, 0·99) lower odds of depressive symptoms. We further analysed total Ca intake (mg/day) according to quartiles. In model 1, not adjusting for covariates, the odds of depressive symptoms among cancer survivors in Q3 and Q4 were lower by 48 % (OR: 0·52, 95 % CI: 0·34, 0·79) and 51 % (OR: 0·49, 95 % CI: 0·34, 0·71) compared with Q1, respectively (P for trend < 0·001). The same trend was observed in models 2, 3 and 4 after adjusting for covariates, and the trend test was statistically significant.
Association between total calcium intake and depressive symptoms

Table 4. Long description
A table comparing the association between total calcium intake and depressive symptoms across four models. The table has 5 rows and 12 columns. Column headers are Variable, Model 1 OR, Model 1 95% CI, Model 1 P, Model 2 OR, Model 2 95% CI, Model 2 P, Model 3 OR, Model 3 95% CI, Model 3 P, Model 4 OR, Model 4 95% CI, Model 4 P. Row labels are Total Ca (1000 mg/day), Q1 (n 551), Q2 (n 551), Q3 (n 552), Q4 (n 550), Trend test. Row 1: Total Ca (1000 mg/day), 0.69, 0.55, 0.85, < 0.001, 0.68, 0.55, 0.85, < 0.001, 0.75, 0.61, 0.92, 0.006, 0.76, 0.57, 0.99, 0.045. Row 2: Q1 (n 551), 1 (Ref), 1 (Ref), 1 (Ref), 1 (Ref). Row 3: Q2 (n 551), 0.79, 0.50, 1.25, 0.3, 0.81, 0.51, 1.28, 0.4, 0.90, 0.57, 1.42, 0.6, 0.90, 0.55, 1.47, 0.7. Row 4: Q3 (n 552), 0.52, 0.34, 0.79, 0.002, 0.53, 0.35, 0.81, 0.003, 0.58, 0.38, 0.88, 0.011, 0.60, 0.40, 0.89, 0.013. Row 5: Q4 (n 550), 0.49, 0.34, 0.71, < 0.001, 0.50, 0.34, 0.73, < 0.001, 0.58, 0.40, 0.85, 0.006, 0.56, 0.35, 0.89, 0.016. Row 6: Trend test, < 0.001, < 0.001, 0.001, 0.003.
ALT, alanine aminotransferase; AST, aspartate aminotransferase; eGFR, estimated glomerular filtration rate.
Model 1a, unadjusted.
Model 2b, adjusted for age and sex.
Model 3c, adjusted for age, sex, hypertension, diabetes and CVD.
Model 4d, adjusted for age, sex, race, education, income, marital status, history of underlying diseases, antidepressants, BMI, smoking, drinking, sleep problems, physical activity, intakes of vitamin D, caffeine and energy, ALT, AST, eGFR, albumin, serum vitamin D and serum Ca levels, cancer types, time since cancer diagnosis, antineoplastic agents.
Q1e, Ca intake is lower than or equal to 606.5 mg/day.
Q2f, Ca intake ranges from higher than 606.5 mg/day to lower than or equal to 962.5 mg/day.
Q3g, Ca intake ranges from higher than 962.5 mg/day to lower than or equal to 1476.0 mg/day.
Q4h, Ca intake is higher than 1476.0 mg/day.
As shown by the logistic regression, total Ca intake was inversely associated with depressive symptoms among US cancer survivors. To further explore the relationship, we conducted the restricted cubic spline analysis. As total Ca intake increased from low to moderate levels, the odds of depressive symptoms decreased progressively. When total Ca intake exceeded approximately 1000 mg/day, the curve appeared to flatten, which may suggest a possible threshold effect, although the test for non-linearity was not statistically significant (P-nonlinear = 0·151), as shown in Figure 3.
Restricted cubic spline (RCS) analysis of the association between total calcium intake and depressive symptoms. Adjusted for: age, sex, race, education, income, marriage, diabetes, hypertension, CVD, smoking, drinking, physical activity, BMI, serum vitamin D, serum calcium, antidepressant, vitamin D intake, caffeine intake, energy intake, cancer types, time since cancer diagnosis, use of antineoplastic agents, sleep problems, liver and renal functions and albumin.

Sensitivity analyses
First, we performed subgroup analyses. After Bonferroni correction, no significant interactions between total Ca intake and depressive symptoms were observed across all subgroups (all p for interaction > 0·0024) as shown in Figure S1, reflecting the robustness of the main findings. Second, after additional adjustment for menopausal status in the female subgroup, the association between total Ca intake and depressive symptoms persisted without essential change (Table S1).
Discussion
In this research, we used a nationally representative sample from the US population. The results indicated that total Ca intake, including dietary sources and supplements, was negatively associated with depressive symptoms among US cancer survivors aged over 20 years. The association still existed after adjusting for relevant covariates. This study has provided new evidence on the link between nutritional intake and mental health in specific populations.
Our findings align with previous epidemiological evidence. An analysis of NHANES database from the US adults showed that the prevalence of depressive symptoms decreased with higher dietary Ca, after adjustment (OR for the highest dietary Ca intake group compared with the lowest one was approximately 0·80, with P for trend = 0·014)(Reference Shen, Gu and Liu10). Similar inverse associations have been reported in other general population studies(Reference Miki, Kochi and Eguchi45,Reference Bae and Kim46) , while a meta-analysis showed a non-significant inverse association(Reference Li, Lv and Wang47), possibly due to different definitions of variables, depressive symptoms or Ca intake. Notably, most existing studies have focused on the general population, with limited attention to cancer survivors. This gap is important to address because cancer survivors differ fundamentally from the general population. Cancer survivors are at higher risk for both nutritional deficiencies (including Ca) and depressive symptoms, making them a priority population for clinical attention(Reference Bach, Knauer and Graf48–Reference Arifin, Chu and Chen52). While previous studies have shown an inverse association between Ca intake and depressive symptoms in the general population, whether this association holds in cancer survivors remains unknown. Our study confirms that this inverse association also exists among cancer survivors. Moreover, the effect size appears to be larger than that reported in the general population using the same NHANES database (OR for the highest v. lowest Ca intake group: approximately 0·80 in the general population(Reference Shen, Gu and Liu10) v. 0·56 in our study of cancer survivors). Two potential explanations may account for this difference. First, cancer survivors may be more vulnerable to nutritional deficiencies due to treatment-related effects on appetite, absorption and metabolism, making adequate total Ca intake more impactful(Reference de Las, Majem and Perez-Altozano53). Second, certain cancer treatments (e.g., aromatase inhibitors for breast cancer) may disrupt Ca homeostasis and bone metabolism, which may make cancer survivors particularly sensitive to variations in total Ca intake, potentially leading to a stronger observed association with depressive symptoms(Reference Lee, Lee and Kim54,Reference Hou, Xu and Zong55) . However, because the two studies differ in study population, analytical models, and exposure definitions, whether the association is truly stronger in cancer survivors – and what mechanisms might explain such a difference – requires further investigation in future studies designed specifically to compare these populations.
Several factors may explain the observed inverse association between total Ca intake and depressive symptoms in cancer survivors. First, total Ca intake is closely related to Ca homeostasis in the body. Although serum Ca levels are tightly regulated by homeostatic mechanisms (primarily parathyroid hormone and vitamin D)(Reference Wongdee, Rodrat and Teerapornpuntakit56), chronic inadequate Ca intake may lead to negative Ca balance and hypocalcaemia, and over the long term, may further result in secondary hyperparathyroidism and hypercalcaemia(Reference Shokry and Morkos57,Reference Saleh, Jorde and Sundsfjord58) . Previous studies have suggested that alterations in serum Ca concentrations may affect mental health through multiple pathways: (1) Ca is a key ion in the release of serotonin (5-HT) and dopamine (DA), two neurotransmitters strongly implicated in the pathogenesis of depression(Reference Grahame-Smith59–Reference Jaffe61); (2) Ca is involved in the regulation of the hypothalamic–pituitary–adrenal axis, and hypothalamic–pituitary–adrenal axis dysregulation may contribute to stress responses and mood disorders(Reference Belvederi, Pariante and Mondelli62,Reference Waage, Sjaastad and Blom63) and (3) Ca is essential for synaptic remodelling via the calmodulin-dependent protein kinase II and cAMP-response element binding protein pathway, and its deficiency may impair neuronal function, contributing to depressive pathology(Reference Yan, Liu and Ye64,Reference Zhang, Liu and Zhang65) . These mechanisms may be particularly relevant to cancer survivors, given the unique physiological and psychological challenges they face. However, these mechanisms were speculative and not directly tested in this cross-sectional study.
Second, higher total Ca intake, particularly from supplements, may reflect broader health-conscious behaviours, better healthcare access, higher socio-economic status or physician recommendations. Cancer survivors with higher total Ca intake may also engage in other healthy lifestyle practices (e.g., regular physical activity and balanced diet), receive closer medical follow-up or have greater awareness of their nutritional needs during and after cancer treatment, all of which could independently influence mental health. Third, reverse causation cannot be excluded. Depressive symptoms may affect appetite, dietary choices and supplement use. This is particularly relevant in cancer survivors, who often face substantial psychological distress from their diagnosis and treatment, which may in turn reduce appetite and dietary quality, leading to lower total Ca intake. Thus, the direction of the association cannot be determined in this cross-sectional study. Taken together, while the observed inverse association is robust, the underlying reasons remain to be elucidated. Future prospective studies are needed to clarify the nature of this association in cancer survivors.
Our study has some advantages as follows. First, this study utilised data from the NHANES database, which employs a complex multistage probability sampling design to ensure representation and broad applicability. Second, Ca intake was estimated by integrating dietary and supplemental Ca from the 24-h dietary recall, allowing for a more accurate reflection of total Ca intake among participants. Third, this study specifically focused on cancer survivors, a population that has received limited attention in previous research on the association between Ca intake and mental health. In addition, our analyses combining logistic regression and restricted cubic spline indicated that higher total Ca intake was inversely associated with depressive symptoms, suggesting that dietary strategies targeting emotional disorders warrant further investigation.
However, there are still some limitations. First, cancer survivors are a highly heterogeneous population, and our findings may not apply equally to all subgroups. Several factors warrant consideration. (1) Prevalence of depressive symptoms varies across cancer types, and the association between total Ca intake and depressive symptoms may also differ by cancer types. However, due to limited sample sizes for individual cancer types, we were unable to perform stratified analyses by specific cancer types. Although adjustments were made for cancer types, our findings may be more applicable to cancer types with larger sample sizes, such as skin cancers, limiting the generalisability to other cancer survivor groups. (2) We lacked data on cancer stage. Advanced-stage cancer may be associated with greater depressive burden, potentially modifying the association between total Ca intake and depressive symptoms. (3) Although we adjusted for time since diagnosis, whether the association varies by phase of survivorship warrants further investigation in future studies. (4) Our assessment of treatment history was limited to recent antineoplastic agent use and did not capture prior chemotherapy, radiotherapy, surgery, or endocrine therapy, each of which may differentially affect nutrition and mood. Future studies with larger, more balanced samples and detailed clinical data are needed to further examine this association, and such studies should account for the high heterogeneity among cancer survivors. Second, the observational study design precludes the establishment of definitive causality and the possibility of reverse causation cannot be ruled out. Further prospective studies are needed to verify the relationship. Third, despite having adjusted for multiple confounding factors, the influence of other potential variables, especially residual nutritional and behavioral confounders, cannot be completely ruled out. Fourth, assessment of depressive symptoms in this research relied on the Patient Health Questionnaire-9 and lacked other clinical assessments, which could involve some subjectivity. Besides, data of total Ca intake were obtained from a single 24-h dietary recall, which does not fully capture participants’ usual long-term intake and may be prone to within-person variability and recall bias. And there was a temporal mismatch between exposure and outcome measurements: total Ca intake was assessed by a single 24-h dietary recall, whereas depressive symptoms were evaluated over the prior 2 weeks via the Patient Health Questionnaire-9. Such difference may introduce bias, as 1-day intake fails to reflect Ca consumption relevant to depressive symptoms. Last, cancer survivors included in this study were all adults aged 20 years or older limited by the cancer questionnaire in NHANES, which could overlook the risk of depressive symptoms among younger cancer survivors. Despite these limitations, our study provides important epidemiological evidence for exploring the association between total Ca intake and depressive symptoms in cancer survivors.
Conclusion
This study investigated the association between the estimated total Ca intake and depressive symptoms in a population of US cancer survivors. The results showed that higher estimated total Ca intake was associated with lower odds of depressive symptoms among US adult cancer survivors. The present research provides new evidence on the link between nutritional intake and mental health in specific populations. However, the cross-sectional design, the use of a single 24-h recall and the reliance on a screening tool (PHQ-9) for depressive symptoms preclude causal inference. Prospective studies using repeated dietary assessments and clinically validated mental health outcomes are needed to confirm these findings.
Supplementary material
For supplementary material/s referred to in this article, please visit https://doi.org/10.1017/S0007114526108186
Data availability statement
Data described in the manuscript will be made publicly and freely available without restriction at https://wwwn.cdc.gov/nchs/nhanes/Default.aspx.
Acknowledgments
We sincerely express our gratitude to the NHANES database and all the participants in this study.
X.C., X.L. and L.K. designed research; X.C, X.L., L.M., X.Q., P.Q and B.P conducted research; X.C., X.L. and D.L. analysed data; X.C., X.L., X.Q. and L.K. wrote the paper and XC., X.L., X.Z. and Y.H. inspected the process. L.K. had primary responsibility for final content. All authors reviewed and commented on subsequent drafts of the manuscript.
This work was supported by the Chongqing Science and Health Joint Medical Research Project (Grant 2024DBXM002).
All authors declare that there are no conflicts of interest.
This study was conducted according to the guidelines laid down in the Declaration of Helsinki, and all procedures involving human patients were approved by the Research Ethics Review Board (https://www.cdc.gov/nchs/nhanes/about/erb.html), and written informed consent was obtained from all participants. Since this study utilised publicly available datasets, no additional ethical review was required.
All the authors declare that no Gen AI and AI-assisted technologies were used in the creation of this manuscript.