


INTRODUCTION
Political discussions of mass incarceration have often focused on felony convictions and long carceral sentences served in state prison. But misdemeanor criminal cases often carry jail sentences of several weeks or months, and these “short” jail stints can still have substantial impacts on the life course: disrupting housing and employment, as well as family relationships (Kohler-Hausmann Reference Kohler-Hausmann2018; Roberts Reference Roberts2011). This paper asks whether jail sentences arising from misdemeanor cases can also shape political participation, particularly voting.
A substantial political science literature investigates how interactions with the criminal legal system, and incarceration in particular, can cause people to retreat from political participation (Fairdosi Reference Fairdosi2009; Testa Reference Testa2016; Weaver and Lerman Reference Weaver and Lerman2010, Reference Weaver and Lerman2014). But such research has often faced questions of causal identification and has not specifically investigated the effects of jail terms in misdemeanor cases (as opposed to felony cases and longer prison terms). Nor has it fully investigated the possibility of effect heterogeneity by race.
I expect that jail stays arising from misdemeanor convictions will reduce voter turnout for several reasons: first, the “political socialization” processes described by past work (especially Weaver and Lerman Reference Weaver and Lerman2014) could plausibly occur during jail stays as well as during prison time. Even brief jail stays are memorable lessons in interacting with government and might well discourage people from voluntary contact with the state (like voting) in future. Further, jail time can disrupt one’s economic life—employment, housing—in ways that may well make it less feasible for people to vote (Verba, Schlozman, and Brady Reference Verba, Schlozman and Brady1995). I expect these demobilizing effects to be particularly pronounced among African Americans, due to differential exposure to arrest and prosecution: Black citizens are more likely to face scrutiny and arrest, and so Black voters are more likely to be caught up in the legal system (while White arrestees were less likely to vote even before arrest).
This paper brings a causal approach to the question of whether, and for whom, incarceration decreases voter turnout. Relying on random courtroom assignment in a major county court system, I use courtroom variability in sentencing as a source of exogenous variation in jail time. Defendants are randomly assigned to courtrooms, and some courtrooms are more prone to sentencing defendants to jail than others. First-time misdemeanor defendants in Harris County who are sentenced to jail time due to an “unlucky draw” in courtroom assignment are slightly less likely to vote in the next election than their luckier but otherwise comparable peers.
I estimate that jail sentences reduce voting in the subsequent election by about four percentage points. However, this overall estimate conceals starkly different effects by race. White defendants show small, non-significant treatment effects of jail on voting, while Latino defendants show a decrease in turnout due to jail, and Black defendants’ turnout in the next election drops by approximately 13 percentage points. Consistent with my theory of differential arrest exposure leading to racial differences in baseline voting propensities, vote history data shows that Black defendants were much more likely to have voted in the presidential election before being arrested than white defendants.
This paper’s findings are bolstered by the data sources used and the causal identification provided by random case assignment. Unlike survey research on this question, this project relies on administrative records for information about both jail sentences and voting, and so is not subject to misreporting or memory lapses. The instrumental variables approach used here produces causal estimates of the effect of jail on voting for an interesting and important subset of the population, misdemeanor defendants who could hypothetically have received some jail time or none depending on the courtroom to which they were assigned.
Focusing on misdemeanor cases for this analysis has several benefits. The results of this study can be generalized to an extremely large pool of people: millions of misdemeanor cases are filed in the US each year, with hundreds of thousands of people receiving short jail sentences. And the results presented here underscore how important even “minor” criminal justice interactions can be (Roberts Reference Roberts2011). Finally, the focus on misdemeanors allows for a test of demobilization without legal restrictions on voting, as none of the people in my analysis will be legally disfranchised due to their convictions.
This paper presents new evidence that incarceration, even for short periods, can reduce future political participation. These results raise normative concerns, especially given the racial makeup of the incarcerated population and the racial differences I find in jail’s demobilizing effects. The nation’s jails are sites of policy implementation, but they may also have important effects on future elections and the inclusivity of American democracy.
THEORY
Incarceration as a Demobilizing Force
The first goal of this paper is to test whether incarceration reduces voter turnout. Existing studies have proposed mechanisms by which incarceration could deter voters, and in this paper, I test whether jail sentences have a negative causal effect on voting. I depart from previous work on the topic by focusing on misdemeanor cases, which are both common and non-legally-disenfranchising.
There are many reasons to expect that incarceration would deter people from voting, which I loosely group into “political socialization” and “resource” mechanisms. First, Weaver and Lerman (Reference Weaver and Lerman2010, Reference Weaver and Lerman2014) describes a mechanism by which people learn to fear and avoid government through criminal justice interactions, and so do not vote [see also Brayne (Reference Brayne2014)]. Weaver and Lerman (Reference Weaver and Lerman2010) uses survey data that includes questions on various interactions with the criminal legal system—questioning by police, arrest, conviction, incarceration—as well as self-reports of voting and other political attitudes and behaviors. Weaver and Lerman (Reference Weaver and Lerman2014) adds in more survey data, as well as interviews with people experiencing criminal justice contact. Both works find that such contact has substantial negative effects on people’s attitudes toward government and their willingness to participate in politics. This is similar to work on other negative interactions with government, such as applying for welfare (Bruch, Ferree, and Soss Reference Bruch, Ferree and Soss2010; Soss Reference Soss1999), and builds on findings that incarceration is associated with lower levels of political efficacy (Fairdosi Reference Fairdosi2009). Just as earlier work on policy feedbacks highlighted how government programs could empower and engage people, making them more politically active, recent work describes how disempowering or punitive government interactions can deter participation. Weaver and Lerman (Reference Weaver and Lerman2014, 16) describes the learning process of people who have had contact with the criminal legal system: “custodial citizens come to see participation in political life not only as something that is unlikely to yield returns, but as something to be actively avoided.” Although people generally spend less time in county jails than they do in state prison, I still anticipate that the process of learning about government described in this literature could play out in the case of misdemeanor jail terms, resulting in demobilization among potential voters.
Time spent in jail, even for short sentences, could yield powerful “interpretive effects” (Pierson Reference Pierson1993). Weaver and Lerman (Reference Weaver and Lerman2010) points out that carceral experiences can shape both people’s beliefs about the nature of government and their views of themselves as citizens. Jail provides a quick and startling lesson about the nature of government, with intense control over inmates’ day-to-day activities, relatively few amenities or educational programs (even compared to state prisons, in many cases), and high death rates from both health problems and suicide (Irwin Reference Irwin1985; Noonan and Ginder Reference Noonan and Ginder2013). Even a few days in jail may well yield experiences that cause people to “actively recoil from political life” (Weaver and Lerman Reference Weaver and Lerman2014).
The second, and even simpler, family of mechanisms by which incarceration could prevent voting is through the many costs that incarceration imposes. I call this the “resources” story. Even short spells in jail can lead to job loss or major loss of income, loss of housing, and family disruption (Western Reference Western2006). Any of these experiences could also prevent people from voting, consistent with past work on the participation of people with different levels of available resources (Verba, Schlozman, and Brady Reference Verba, Schlozman and Brady1995).
Both of these mechanisms (political socialization and resources) yield the expectation that incarceration decreases voting. However, there is little existing evidence on the question of how jail time in particular (as opposed to police contact, felony convictions, or prison time) affects political behavior. Nonetheless, I think jail is an especially likely place to find such demobilization, perhaps even more so than the prison sentences that arise from felony cases. Misdemeanor cases (and the jail sentences resulting from them) affect a broader swath of people than felony cases, and should be expected to affect more likely voters with little past experience of the criminal justice system. Compared to people facing prison in felony cases, misdemeanants have more to learn about the state from these experiences, and more to lose in their political participation.
But one of the central challenges of prior research on the relationship between incarceration (of any type) and participation is that it is difficult to disentangle the effects of incarceration from confounders such as criminal behavior. Many authors have questioned whether people who engage in criminal behavior and are then incarcerated were likely to vote even if they hadn’t been jailed, imprisoned, or barred from voting via felon disenfranchisement laws (Gerber et al. Reference Gerber, Huber, Meredith, Biggers and Hendry2017; Haselswerdt Reference Haselswerdt2009; Hjalmarsson and Lopez Reference Hjalmarsson and Lopez2010; Miles Reference Miles2004).Footnote 1 Existing research has attempted to address this question using survey self-reportsFootnote 2 and various matching or time-series approaches, but it has proved difficult to demonstrate that incarceration itself causes lower turnout. Weaver and Lerman (Reference Weaver and Lerman2010), for example, uses both matching and a placebo test relying on the timing of cases in order to try to rule out the possibility of estimates being driven by selection bias, while Weaver and Lerman (Reference Weaver and Lerman2014) relies on a panel survey to observe individuals’ turnout before and after they are incarcerated. But Gerber et al. (Reference Gerber, Huber, Meredith, Biggers and Hendry2017) points out the concern that even time-series analyses could be prone to bias if there are time-varying confounders at work (giving the example of a person who “falls in with a bad crowd” and becomes both more likely to face incarceration and less likely to vote). Indeed, Gerber et al. (Reference Gerber, Huber, Meredith, Biggers and Hendry2017) demonstrates that when using administrative records of incarceration and voting and including more covariates to address selection bias, the estimated effect of prison on voting (within a sample of registered voters convicted of felonies) drops to essentially zero. This disagreement about the causal interpretation of past estimates makes the current study’s use of random courtroom assignment apt.
A further challenge faced by past work on incarceration is that many of the mechanisms by which incarceration is thought to reduce voting involve voluntary actions: people decide to stay home on election day due to their past experiences with government. But in practice, looking at the voting behavior of the previously-incarcerated often conflates voluntary actions with legal fact: many people are incarcerated for felony convictions and are ineligible to vote for at least some period of time in most states. In many states, they will be purged from the voter rolls, and so face an additional hurdle to voting. In some states, they will need to apply to be reinstated as voters; in a few, they will most likely remain ineligible for life (The Sentencing Project 2013).
Focusing on misdemeanor defendants allows me to measure voluntary withdrawal from politics, rather than legal restrictions on voting such as felon disfranchisement laws. But misdemeanor cases are also interesting in their own right, and have been understudied. They are extremely common: although exact national counts of misdemeanor cases are not available, one source estimated that there were 10.5 million misdemeanor prosecutions in 2006 (Boruchowitz, Brink, and Dimino Reference Boruchowitz, Brink and Dimino2009), while more recent estimates put the count at 13.2 million such cases yearly (Stevenson and Mayson Reference Stevenson and Mayson2017). And although they carry fewer legal and social consequences than felonies, there are still collateral consequences to misdemeanor convictions, as well as the possibility of jail time, probation, and fines (Howell Reference Howell2009; Roberts Reference Roberts2011).
From the existing literature on incarceration and voting, and this understanding of misdemeanor cases, I derive the first hypothesis of this study: jail sentences will render misdemeanor defendants less likely to vote (all else being equal).
Racial Differences in Incarceration’s Effects
Most existing work on incarceration and voting has focused on the average effect within the population, but there are also reasons to expect that effects could differ by race, which have not received as much attention.
Criminal cases (especially misdemeanors) are subject to concerns about racial discrimination at nearly every stage of the process, from policing to arrest to charging to sentencing. Black men, especially those without college education, are disproportionately likely to be arrested, convicted, and incarcerated (Pettit and Western Reference Pettit and Western2004). There is ongoing debate about how much of the racial difference in arrest and conviction is due to differences in criminal activity and how much is driven by racial discrimination in the criminal legal system. In lower-level crimes, discretionary behavior by police and prosecutors may become especially important, and racial bias could more easily come into play (McKenzie Reference McKenzie2009; Spohn Reference Spohn and Horney2000). In drug cases in some jurisdictions, for example, people of color make up a high proportion of defendants despite not using drugs at higher rates than Whites (Beckett, Nyrop, and Pfingst Reference Beckett, Nyrop and Pfingst2006; Golub, Johnson, and Dunlap Reference Golub, Johnson and Dunlap2007). This disparity is often attributed to greater scrutiny of minority neighborhoods by police and discretionary charging behavior by prosecutors. Looking across all misdemeanor cases, Stevenson and Mayson (Reference Stevenson and Mayson2017) find large racial disparities in exposure to many case types.
A sizable body of academic research, as well as many first-hand accounts in media and literature, documents Black Americans’ disproportionate exposure to policing and arrest. Qualitative studies have described heavy-handed police behavior in minority neighborhoods (Brunson and Miller Reference Brunson and Miller2006; Rios Reference Rios2011), while quantitative studies have analyzed the targeting of Black citizens through traffic stops or programs like New York’s “Stop-and-Frisk” (Antonovics and Knight Reference Antonovics and Knight2009; Gelman, Fagan, and Kiss Reference Gelman, Fagan and Kiss2007; Meehan and Ponder Reference Meehan and Ponder2002). And Eckhouse (Reference Eckhouse2018) highlights the ways in which the distribution of police surveillance across neighborhoods can lead to disproportionate exposure of Black citizens to searches and arrests even in the absence of individual bias.
In a situation of racially-disparate exposure to arrests and misdemeanor charges, we might expect racial differences in defendants’ pre-existing characteristics as well as their post-release voting behavior. If arrest patterns differ by race, Black defendants could differ from White defendants in their pre-arrest voting habits. We might expect that high Black arrest rates could mean that the court system would see a broader swath of the Black community, including many regular voters that could be demobilized by jail time. Conversely, if White residents are less likely to be arrested, the relatively few White defendants that do end up in court might not have been likely voters to begin with (and so could show little demobilization).
This is not the only mechanism that could yield effect heterogeneity: Black misdemeanor defendants sentenced to jail could also experience different treatment in jail than White inmates. Or, Black defendants sentenced to jail could interpret the sentence differently, perceiving the court system’s treatment as more unfair than a White defendant in similar circumstances (Fagan and Meares Reference Fagan and Meares2008; Hurwitz and Peffley Reference Hurwitz and Peffley2005; Tyler Reference Tyler2001; Walker Reference Walker2016). Any of these mechanisms could lead to larger effects for Black than White defendants.Footnote 3 In the “Results” section, I offer some evidence for the disparate-policing mechanism, but do not claim to disprove these other mechanisms.
Because this paper uses administrative records rather than survey responses, I have enough observations to look for racial differences in jail’s effect on voting. I test the hypothesis that Black defendants will show more demobilization than White defendants.
DATA AND METHODS
Misdemeanor Case Data
I use a dataset from Harris County, Texas, of first-time misdemeanor defendants whose cases were filed in the Harris County Criminal Courts at Law between November 5, 2008, and November 6, 2012.Footnote 4 Case records were provided by the Harris County District Clerk’s office. For each person charged with a misdemeanor, I have identifying information (name, birthdate, address, and unique identification number), some demographic data (sex, race, age), a description of the charges faced (the exact charge as well as the charge severity), courtroom assignment, and sentencing outcomes (disposition, any fines/probation/jail).
Harris County is the third largest county in the US, located in the southeast corner of Texas. It contains the city of Houston and is home to over four million people. Its misdemeanor court system is, accordingly, large, with 15 courtrooms hearing about 45,000 cases per year during the period studied. First-time misdemeanor cases filed with the Harris County District Clerk are randomly assigned to one of fifteen courtrooms by a computer program.Footnote 5 Each courtroom in the misdemeanor court system consists of a single judge and a team of prosecutors at any given time; judges face re-election every four years, while prosecutors are assigned to the courtroom by the District Attorney’s office and can remain in the same courtroom for months or years (Mueller-Smith Reference Mueller-Smith2018). Common case types for these courtrooms include driving while intoxicated, theft, possession of small amounts of marijuana, and certain types of (non-aggravated) assault.
Misdemeanor charges in Texas carry penalties of up to one year in jail, along with the possibility of fines or probation. These cases are generally handled with a minimum of courtroom time, as county courts handle scores of misdemeanor cases per courtroom per day. Jury trials are extremely rare, and most defendants plead guilty; see Section 3.4 of the SI for more discussion of case outcomes.
The Harris County defendants dataset includes information on the dispositions and sentences from each case. For this analysis, I focus on the first case or cases faced by a defendant. For people with multiple charges filed the same day, I collapse those observations to calculate whether they received a particular sentencing outcome in any of their cases. Cases filed at the same time for the same individual would be heard by the same courtroom.Footnote 6 For cases with deferred adjudication, I ignore anything that happens after the first sentencing decision. If someone is sentenced to probation, for example, and later ends up being sent to jail because they violated that probation agreement, I do not count this as a jail sentence, only as a probation sentence. I also drop eight cases with clearly impossible sentence lengths (over 100 years), which I attribute to data entry errors. This approach yields a dataset of 113,367 defendants.
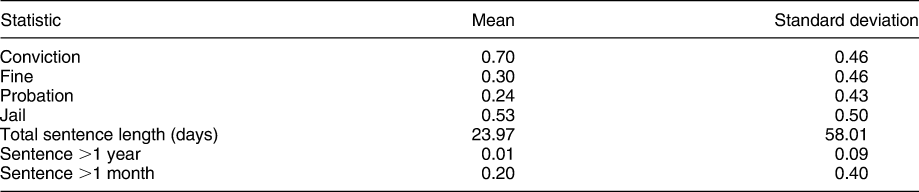
Table 1 presents summary statistics on a range of possible sentencing outcomes. These outcomes are not mutually exclusive: one can receive a jail sentence and be assessed a fine for the same charge. About half of people who face misdemeanor charges in Harris County are ultimately sentenced to some jail time. Even including several implausibly long sentences, the mean sentence is under one month. Conditional on receiving some jail time, the median sentence is 10 days.
Harris County Criminal Sentencing, 2009–12

Merging Court Records to Voting Records
In order to examine incarceration’s impact on voting, I needed to measure voter turnout among all first-time defendants. In the main analysis presented here, voter turnout data comes from the Texas voter file.Footnote 7
Defendants’ court records were linked to the voter file using defendant/voter names and birthdates. I first merged the files by last name, first initial, and birthdate. Then, I adjudicated “ties” between potential matches using string distance: I calculated how dissimilar the first names were in all possible matches and dropped potential matches that fell below a certain distance threshold. Of remaining potential matches, I retained the one where the first names were most similar.Footnote 8
The voter registration and turnout rates in the resulting dataset are low, as one would expect for people who recently faced criminal charges. Roughly a third of the sample showed up as registered voters after the 2012 election, and about 13 percent of them were recorded as having voted in the 2012 general election.Footnote 9
Because names and birthdates could be recorded differently in different datasets or could be shared by multiple people, it is possible that this merge could either under- or over-report the rate of voter registration among previous defendants. An unregistered defendant could be matched to some other person’s voter record (false positives), or a registered defendant could be left unmatched due to name or birthdate errors (false negatives). I follow Meredith and Morse (Reference Meredith and Morse2014) in conducting a permutation test to check for false positives: I add 35 days to each defendant’s actual birthdate and attempt to merge this permuted dataset to the voter file. Finding many matches for this permuted data would suggest that false matches are common. When I permute the birthdates of the actual dataset and attempt to match it to the voter file, fewer than 100 (of over 100,000 defendants) match: a match rate of less than one percent. These results suggest that my actual match rate of roughly one in three of the defendants matching to voter records is unlikely to be driven by incorrect matches.
Assessing the rate of false negatives (missed matches) is more difficult. The fuzzy string matching of first names allows for some small typographical errors across files. However, errors in birthdate or last name, or extreme variation in first names, could certainly result in missed matches. If there were such missed matches, they would likely bias the estimates toward zero, making the results presented in this paper a conservative estimate of the effects of jail on voting.Footnote 10
RESULTS
Preliminary Approach
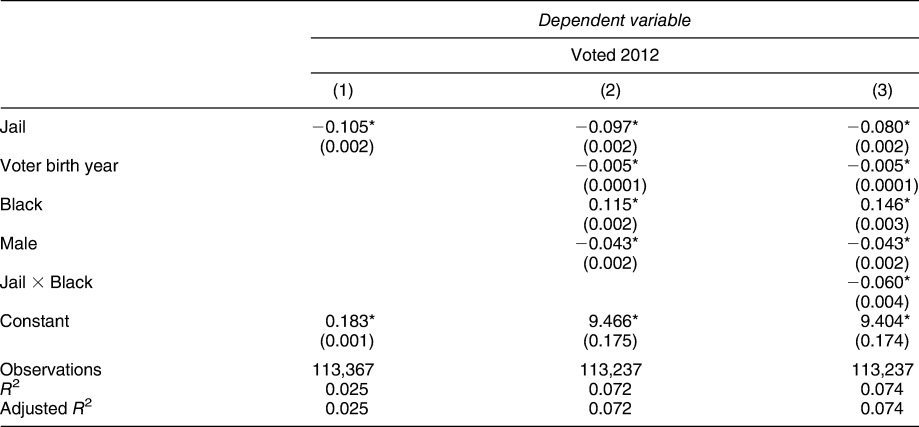
Before using the instrumental variables (IV) approach of the main analysis, I report the simplest specification: ordinary least squares regression of 2012 voter turnout on having been sentenced to jail in the four years prior. The results of this analysis appear in Table 2. These estimates may be biased:Footnote 11 defendants who go to jail are probably different from those who do not go in a number of unobserved ways (Gerber et al. Reference Gerber, Huber, Meredith, Biggers and Hendry2017; Turney Reference Turney2013). But they provide a descriptive understanding of the data, and a baseline for comparison with the IV estimates. And these estimates invite further investigation: the negative coefficient on jail in the first column suggests that jail could be associated with lower voter turnout in the next election, while the interaction term between Black identity and jail in the third column suggests that that negative relationship is more pronounced for Black defendants.
OLS Estimates of Jail’s Effect on Voting

Note: *p < 0.05.
Main IV Results
Hypothetically, one could measure the effect of incarceration on voting by randomly assigning some people to go to jail and others not, and then observing the different turnout behavior between those two groups. This real-world experiment would be deeply unethical for social scientists to run. But the random assignment of cases to courtrooms in Harris County has some things in common with that experiment. Cases are assigned at random to courtrooms that are more or less likely to sentence people to jail. Some defendants would always get jail time, and some would have seen their cases dismissed (or been convicted but not sentenced to jail time) no matter what courtroom assignment they received. But for some subset of those charged—compliers, in the language of Angrist, Imbens, and Rubin (Reference Angrist, Imbens and Rubin1996)—we can imagine a coin flip: if they are assigned to a “harsher” courtroom, they will receive some jail time, but in a “more lenient” courtroom they would not. The instrumental variables design allows me to capture this random variation in sentencing to measure the effect of jail time on voting for these defendants.
I use courtroom assignment to instrument for incarceration (Green and Winik Reference Green and Winik2010; Kling Reference Kling2006; Loeffler Reference Loeffler2013; Mueller-Smith Reference Mueller-Smith2018; Nagin and Snodgrass Reference Nagin and Snodgrass2013). The intuition here is that one can use the part of the variation in jail sentencing that is driven by courtroom assignment (rather than the variation driven by defendants’ underlying differences, such as personal characteristics or offense severity) to measure the effect of jail on voting. This analysis first uses courtroom assignment to predict whether each person in the sample will receive a jail sentence, and then uses those predicted jail sentences to estimate the effect of jail on future voter turnout.
In order for this approach to identify the effect of incarceration on voting, the exclusion restriction must hold. In this case, this means that assignment to a particular courtroom cannot affect voting except through incarceration. In many ways, this seems reasonable: judges are not in the habit of talking about voting during sentencing, and most defendants will spend very little time in the courtroom for a misdemeanor case. However, one possible concern is that other sentencing decisions besides incarceration (such as probation or fines) could also affect voting. If courtrooms that give out more jail sentences are also harsher in their assessment of fines, for example, the estimates presented here could be measuring the combined effect of being sent to jail and also having to pay a fine. I investigate this concern in SI Section 5.Footnote 12
This IV approach also requires several other assumptions to be met. First, courtroom assignment (the instrument) must be truly exogenous, not determined by some defendant or case characteristics. And there must be sufficient courtroom-level sentencing variation: if all courtrooms sentenced defendants in the same way, being randomly assigned to a particular courtroom would not change one’s probability of a jail sentence.
Qualitative evidence suggests that cases are genuinely randomly assigned to courtrooms, with no possibility for “courtroom-shopping.” Random case assignment is a matter of court policy (RULES OF COURT, Harris County Criminal Courts at Law 2013), and a telephone call to the district clerk’s office confirmed that such a system was in place. When this author spoke with staff in the office, they seemed confused that anyone would even ask about the possibility of switching courtrooms, and reiterated the automated process by which the computer system assigns cases to courtrooms. Mueller-Smith (Reference Mueller-Smith2018) also tests for empirical patterns consistent with random assignment in this court system and finds no evidence of random case assignment being subverted.
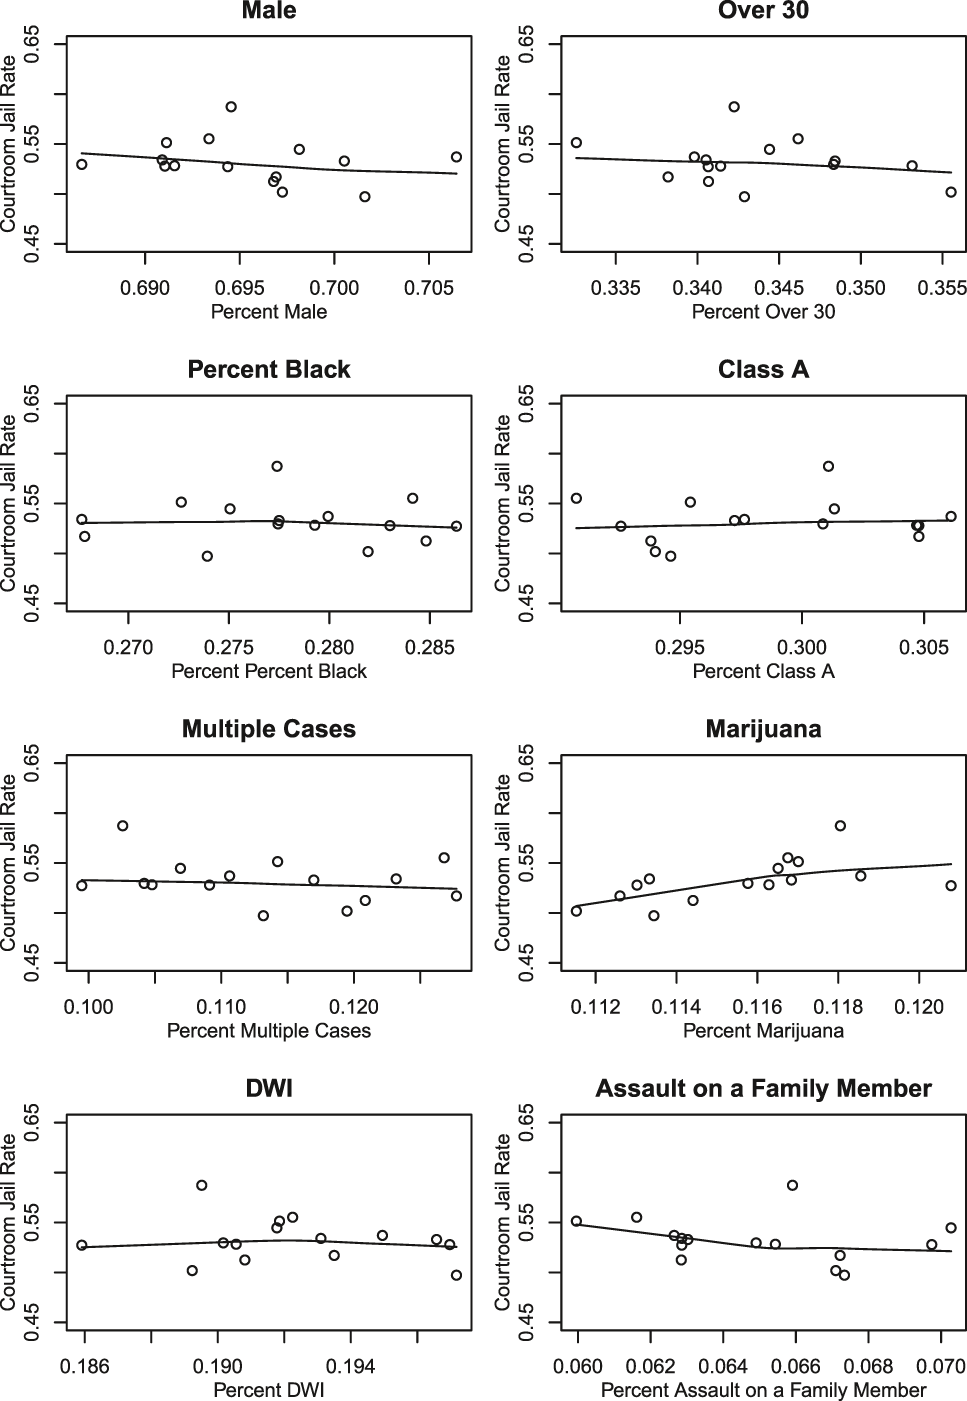
In Figure 1, I plot various pre-treatment characteristics (such as defendants’ age, race, and charges faced) against the incarceration rates of the courtrooms to which they were assigned. If defendants were able to switch courtrooms, we might expect to see courtroom differences in these background characteristics; for example, we might think that less-harsh courtrooms would tend to have whiter or older caseloads, as those defendants might be more able to afford attorneys that could facilitate courtroom-switching. The figure does not suggest any such patterns. Patterns measured at the courtroom level are slightly noisy, but do not suggest systematic differences in courtroom caseloads, whether on defendants’ gender, race, or age, or the severity of the charges faced (Class A or Class B misdemeanors), or whether the defendant was facing multiple charges, or whether charges fell into several of the most-common case types (marijuana possession, DWI, or family assaults). Section 3 of the SI explores balance concerns further, including producing separate scatterplots for Black and White defendants, and exploring whether any small apparent imbalances (as seen for marijuana cases) could be driving the main results. Section 3 of the SI also contains plots demonstrating that courtrooms receive similar proportions of the most common case types across years, as well as a permutation test demonstrating that the age of defendants is distributed as would be expected under random case assignment, and F-tests from regressions of pretreatment covariates onto courtroom and year dummies.
Scatterplots of Pre-treatment Case Characteristics Against Courtroom Incarceration Rates.
Note: Each point represents one misdemeanor courtroom; lines are loess smoothers. Marijuana possession (0-2 ounces), driving while intoxicated (DWI), and assault on a family member are the most common charges in the dataset.

My main IV approach instruments for jail (whether a defendant is sentenced to jail or not) using courtrooms’ incarceration propensity. The instrument is constructed as the courtroom’s mean incarceration rate over any given year: how many of the people who came before that courtroom ended up sentenced to jail?Footnote 13 For example, a person who faced charges in 2011 and was assigned to courtroom 7 would receive a value of 0.50, as courtroom 7 sentenced half of defendants to jail that year. In practice, the incarceration instrument calculated yearly ranges from 0.47 to 0.63, demonstrating that courtrooms display substantial variation in their sentencing decisions.
I recalculate the instruments over time because of concerns that courtroom changes could render a courtroom more or less prone to incarceration. The monotonicity assumption for this IV setup requires that being assigned to a “harsher” courtroom (one with a higher overall incarceration rate) makes one more likely to be sentenced to jail. If courtrooms’ incarceration propensities shift over time, this monotonicity assumption could be violated. For example, Courtroom 3 incarcerated 52% of defendants with cases filed in 2011, while in 2012 it incarcerated only 49% of defendants. Courtroom 6 changed from a 51% incarceration rate in 2011 to 56% in 2012. Looking over this entire period, Courtroom 6 looks like a harsher courtroom. But in cases filed in 2011, defendants were actually slightly more likely to be jailed if they were assigned to Courtroom 3. Recalculating the instruments over time allows courtrooms to change, whether because of personnel changes (new judges or prosecutors entering a courtroom) or within-person behavioral shifts. Section 3.3 of the SI presents specifications intended to guard against several other violations of the monotonicity assumption, such as the possibility that courtrooms may have above-average incarceration rates for some types of criminal charges but below-average rates for other charges.
Results
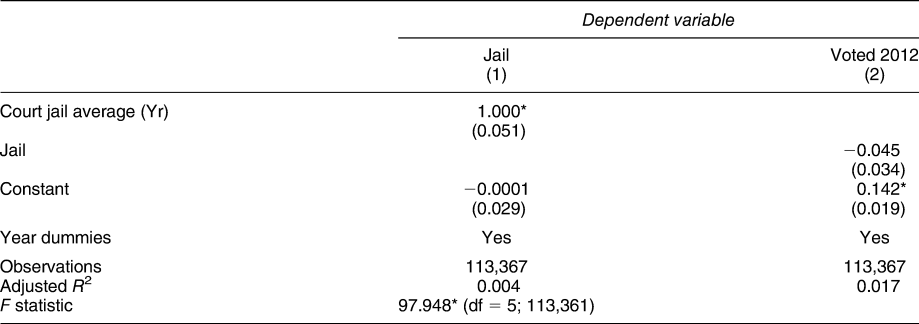
Table 3 presents 2-stage least squares (2SLS) results from this approach. The first column presents the first-stage regression of jail sentences onto the courtroom-jail-rate instrument, demonstrating that the instrument is relevant. The first-stage F-statistic is large, suggesting that concerns about weak instruments are not merited (Stock, Wright, and Yogo Reference Stock, Wright and Yogo2002). The second column presents the 2SLS estimates of jail’s effect on voting, estimated for all defendants. The negative coefficient suggests that a jail sentence decreases one’s probability of voting in the 2012 election by four percentage points, though it is imprecisely estimated in this simple specification.Footnote 14 This estimate provides some evidence for the first hypothesis, that jail sentences reduce voter turnout in the subsequent election, though it cannot rule out the possibility that jail has no effect on turnout.
Jail Sentences on 2012 Voting

Note: *p < 0.05.
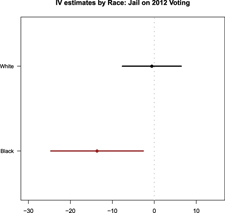
Next, I split the sample to explore whether the deterrent effect of jail differs by race. Figure 2 presents 2SLS estimates of the effect of jail on voting for Black and White defendants separately (table in SI Section 1). The estimates are strikingly different. The treatment effect of jail on voting for Black defendants is substantively and statistically significant, about 13 percentage points’ decrease in voter turnout.Footnote 15 The estimate for White defendants is small (one-tenth of a percentage point) and statistically indistinguishable from zero. The SI (Section 4.2.8) presents a model including both groups of defendants and interacting race with jail to test whether these effects are significantly different from one another, and they are statistically distinguishable. Black defendants and White defendants respond to jail sentences differently. One possible interpretation of these racial differences is as evidence of overpolicing and criminalization of Black citizens, which I explore further in the “Vote History” section.
Jail’s Effect on Voter Turnout (2SLS Estimates), by Race of Defendant.
Note: A coefficient of −0.13 indicates a turnout decrease of 13 percentage points (among compliers).

Harris County’s court database includes a “defendant race” variable that only indicates whether a defendant is Black, White, Asian, Native American, uncategorized, or “other.” This database classifies Hispanic defendants as White, so the above analysis discussing “White” defendants includes both Hispanic and non-Hispanic White defendants. However, in Section 6.2 of the SI, I discuss an approach using surname matching to identify Hispanic defendants. Hispanic defendants (as identified by surname, undoubtedly with some errors) do seem to show a negative effect of jail on voting, but I cannot say for certain that there is a difference in responses between Hispanic and non-Hispanic White defendants.
In the SI, I also present results from a longer time range (Section 6.1). They provide preliminary evidence that these effects may persist beyond a single election cycle.
Interpretation
These estimates are not of the average treatment effect of jail on voting for all defendants; instead, they represent a local average treatment effect (LATE) for “compliers” (Angrist, Imbens, and Rubin Reference Angrist, Imbens and Rubin1996). While some people would have received a jail sentence regardless of courtroom assignment, and others would never have been sent to jail, we can think of compliers as the defendants whose jail sentencing outcome depends on the courtroom to which they are assigned—had they been sent to a different courtroom, their case might have turned out differently. The instrumental variables approach estimates the effect of jail time among this (unobserved) subset of defendants.
This local effect is interesting from a policy standpoint. The people who are being jailed and ultimately deterred from voting in this study are not repeat serious offenders who are being incarcerated out of concern for public safety. They are first-time misdemeanants who may face some jail time, or may not, because a computer randomly assigned them to face one judge or another. That judges’ exercise of sentencing discretion in these minor cases has such large downstream effects on voting is both surprising and troubling. However, the fact that this study’s estimates are drawn from a specific pool of compliers does not mean that they cannot be generalized to a broader set of defendants. If compliers are similar to other people facing charges on characteristics that shape voting propensity, and they experience jail and the court system as equally arbitrary and degrading, the effects measured here should be generalizable to many other defendants.Footnote 16 I discuss the generalizability of these results further in the “Substantive Importance” section.
These are causal effects of jail on voting, but they do not identify the precise mechanism by which this demobilization occurs. I interpret these results as a measure of individuals choosing to withdraw from political participation after being jailed. As discussed above, this could happen because their time in jail taught them to avoid government and decreased their sense of personal efficacy, per Bruch, Ferree, and Soss (Reference Bruch, Ferree and Soss2010), Weaver and Lerman (Reference Weaver and Lerman2014) and others.
A slightly different mechanism is resource-related: rather than convincing voters to avoid government, it could produce many practical barriers to voting. We know that incarceration (even in short stints) can lead to job loss, family disruption, and housing and economic challenges. And although misdemeanor convictions carry fewer legal sanctions than felonies (for example, they do not bar people from voting), they still can carry collateral consequences like restricted access to public benefits or occupational licenses.Footnote 17 It is possible that individuals still believe in the value of voting [contrary to the theory of Weaver and Lerman (Reference Weaver and Lerman2014)], but that they find it too difficult to vote when they are dealing with other problems (Verba, Schlozman, and Brady Reference Verba, Schlozman and Brady1995).
Either mechanism would speak to the lasting impact of jail on people’s lives and political engagement, even in the absence of legal restrictions on voting. But the two mechanisms (jail socialization and resource constraints) are slightly different, and I cannot thoroughly distinguish between them with the data at hand. In Section 1.3 of the SI, I present some preliminary findings that suggest the mechanisms may reach beyond economic disruption. I use tax appraisal data to identify a subset of defendants who own their own homes, and find that they actually show a larger demobilizing effect of jail than the main sample. Given that these defendants should be partially shielded from some of the most extreme and immediate economic outcomes of jail (such as eviction and homelessness), that they show an even larger effect of jail on voting suggests that political socialization may be at work (Weaver and Lerman Reference Weaver and Lerman2014). However, the relatively small size of the sample here (6,000 homeowners) means that these analyses should be approached with caution.
There are two other possible mechanisms that I find less likely. First, would-be voters might still want to vote, but mistakenly think they were ineligible. For this to explain the above results, they would need to know that an arrest did not make them ineligible, but think that jail time served for a misdemeanor barred them from voting.Footnote 18 Prior research has shown that there is substantial misinformation among ex-felons about voting eligibility and that notifying them of their right to vote can boost turnout in some cases (Meredith and Morse Reference Meredith and Morse2015). But Drucker and Barreras (Reference Drucker and Barreras2005)’s survey of adults with a history of criminal justice involvement did not show substantially more misinformation around past jail terms than around past arrests. It is possible that misinformation is in play, but I do not think it is likely to drive all of the results presented here.
Another apparent possibility is that would-be voters were still in jail at the time of the election, but this is unlikely. The vast majority of these defendants would have been free at the time of the 2012 election regardless of the sentence they received, as most misdemeanor jail sentences in this data last a week or two.Footnote 19 Dropping all cases filed in 2012 yields similar results and rules out this possibility for nearly all defendants.
A related mechanism would be re-arrest: if people sentenced to jail become more likely to be re-arrested, the next election might find them in jail due to another set of charges or barred from voting due to a new felony conviction. This does not appear to be the case in this dataset. In additional analysis in Section 1.4 of the SI, I examine felony convictions or additional jail time that occurs after the first case but before the 2012 election (using the same IV setup as in the main analysis with these new outcome variables). I find no evidence that people sentenced to jail in their first cases become significantly more likely to be convicted of a felony or sentenced to jail in a second case prior to the 2012 election. This is somewhat contrary to existing work that has found recidivism effects from jail sentences, but I believe this is due both to the nature of the sample (first-time defendants, not all criminal defendants) and to the brief time frame of my analysis (people charged in 2011, for example, would have had little time to serve a jail sentence, be released, and then be re-arrested prior to the 2012 election).Footnote 20
Voter History
The results presented in the previous section show very different effects of jail on Black and White defendants. This could be due to differing arrest patterns by race, with Black citizens more likely to face arrest than White ones. If Black people face elevated risks of arrest across the board, then Black voters could be more likely to get swept into the criminal justice system. It is possible that zealous policing tactics in Black neighborhoods mean that there are a higher proportion of regular voters among Black defendants than White defendants. In this section, I look for evidence of such a difference.
I use data on voting in prior elections, as recorded in the Texas voter file. As noted above, this file has complete voter turnout data for all registrants as of the 2012 election. But prior election data may be less complete, as voters could have voted in those earlier elections but then been purged from the voter file for various reasons (such as inactivity or death). This file provides a conservative measure of turnout in 2008, in the sense that anyone who is reported as voting in 2008 almost certainly did, but some people who did vote may not appear as voters in the data. Barring complex patterns of voter purging (such as White voters being disproportionately likely to be dropped from the voter file after having voted in 2008),Footnote 21 this data provides a useful test of whether Black defendants are more likely to have been voters before their arrest.Footnote 22
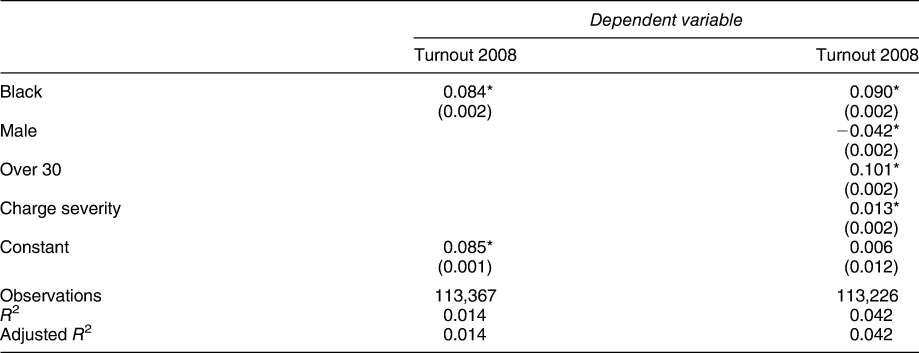
Table 4 presents descriptive regression results that allow us to compare previous voter turnout across race. Black defendants are more likely to have voted in 2008, before their arrests, than White defendants. The estimated difference, of about eight percentage points, is substantial: in the full dataset, 11% of defendants had voted in 2008. Black defendants are nearly twice as likely as White defendants to have voted prior to their arrest. This difference underscores the racial differences in exposure to the criminal justice system that have been pointed out by Pettit and Western (Reference Pettit and Western2004) and others. White people are less likely to be arrested overall, and arrests are confined mainly to people who do not regularly vote. But with more police presence and higher scrutiny of Black neighborhoods, Black people are more likely to be arrested. With such high arrest rates, the pool of arrestees includes not only socially-isolated, civically-detached people, but also more politically-engaged people. Black voters get arrested and charged, and so it is possible for them to be demobilized by jail.
Differences in Pre-arrest Voter Turnout by Race

Note: *p < 0.05.
This table does not prove deliberate discrimination on the part of police or prosecutors; I do not have data to assess why arrest rates differ. And this section’s analysis is not as well-identified as that in the previous section. The IV estimates of jail’s effect on voting (for both Black and White defendants) are well-identified causal effects. The evidence presented here about why the effects differ does not rule out other possible mechanisms. However, it is consistent with a narrative in which targeted policing brings many Black defendants into court, including some voters (so they can be deterred), while lower arrest rates among Whites mean that the White defendant pool rarely includes voters (so there is little demobilization, because the people jailed were unlikely to vote anyway). These differences in vote history persist even when adjusting for other defendant characteristics, such as age, gender, and charge severity.
Substantive Importance
The main results point to a large decrease in voter turnout for Black defendants sentenced to jail. The question remains of how substantively important this effect is, and how many voters could actually be deterred by jail terms. This question has two components: first, how might the Local Average Treatment Effect (LATE) estimated for compliers in this sample generalize to the rest of the sample, or to defendants outside Harris County? And second, how many first-time misdemeanor defendants, in Harris County and nationwide, could face demobilization from jail sentencing?
Generalizing LATE
There is limited covariate data available to compare compliers in the sample to the full sample, though an analysis in Section 6.4 of the SI attempts to loosely characterize the complier population.
An indirect approach to generalizing the LATE here would be to find an entirely different identification strategy, either by finding another instrument with a different complier population, or by using a different design entirely. In Section 1.6 of the SI, I present a different set of estimates based on case timing (comparisons of people arrested before and after the election) and find treatment effects that are comparable in magnitude to the local estimates presented here. In particular, White defendants do not show large or significant demobilizing effects from jail, as I find in the main analyses, while Black defendants show large, significant demobilization (on the order of ten percentage points). That a completely different research design finds an average treatment effect that is similar to the LATE estimated here should bolster our confidence in the generalizability of these results beyond the population of compliers for this design.
On the question of how Harris County defendants differ from those in other jurisdictions, there is little concrete data available. There is no national source of data on misdemeanor cases and jail sentencing (Boruchowitz, Brink, and Dimino Reference Boruchowitz, Brink and Dimino2009). Qualitative reports suggest that the experience of going to jail in Harris County is not atypical for local jails anywhere in the country, though the Harris County jail system is particularly large.
Eligible Population
If we think the LATE estimated from the Harris County sample can be reasonably applied beyond compliers, the question remains: how many people could be affected? I examine this question first for Harris County, then make some nationwide estimates.
In Harris County, the sample of Black defendants consists of about 30,000 Black first-time misdemeanor defendants whose cases were filed between the 2008 and 2012 election, of whom just over 16,000 were sentenced to jail. If the LATE estimated above holds for all of these defendants, then roughly 2,100 Black defendants were deterred from voting in 2012 due to jail sentences received in the four years prior. This is a significant number of voters for local elections, even in a large county. In the November 2012 election, for example, two of the judgeships in the Harris Civil Courts at Law (different from the Criminal Courts at Law discussed in this paper) were on the ballot. These were both tight elections: the Republican candidate for Courtroom 1 won the race by under 4,000 votes. If we assume that most Black voters in Harris County vote for Democrats, the decision of several thousand Black voters to stay home could sway tight elections like this one. And even without reversing election outcomes, the withdrawal of thousands of Black voters from the electorate could lead to different patterns of representation and policy outcomes (Griffin and Newman Reference Griffin and Newman2005).
It is harder to know how many people could be affected by misdemeanor jail sentences nationally. There is little national data on misdemeanor charges or jail sentencing, so I present a back-of-the-envelope calculation based on two approaches: one using jail admissions data from the Bureau of Justice Statistics and another extrapolating from Harris County data. The assumptions made are discussed in the SI (Section 6.5).
Estimates of the affected population (Black first-time misdemeanor defendants sent to jail during this presidential election cycle) range from 765,000 to 1.2 million depending on the data used. If they faced the same rates of demobilization estimated in the main analysis (a drop of 13 percentage points), this would mean somewhere between 100,000 and 156,000 Black Americans stayed home from the polls in the 2012 election due to jail sentences served during that election cycle.Footnote 23 These are loosely estimated quantities, but they suggest that a staggering number of Black potential voters stayed home in 2012 due to misdemeanor jail sentences. Even if we used a much smaller effect estimate (also consistent with the results presented here, given uncertainty), these would translate into substantial numbers of voters being demobilized, and major racial disproportionality in that demobilization.
CONCLUSION
Jail sentences arising from misdemeanor cases decrease voter turnout in the next election, especially for Black defendants. These estimates carry a causal interpretation and are consistent with a story of behind-bars “political socialization.” Further, jail sentences disproportionately deter Black voters, suggesting that seemingly minor criminal cases could have major racial implications for democratic representation. A further analysis of pre-arrest voter histories indicates that Black defendants were far more likely to have been voters before they were arrested. This evidence supports my theory of racially-disparate demobilization effects being driven by racial disparities in exposure to policing: Black voters face a high risk of arrest (while White defendants are unlikely to be voters), allowing for more demobilization among Black defendants.
Although this analytic setup depends on a criminal court system with random assignment to courtrooms, the results generalize beyond Texas’ county courts. In court systems with only one judge or without random assignment, we can imagine that small differences in a judge’s mood or calendar could lead to sentencing variation that deters voting. And even in the absence of such arbitrary variation—even in cases where multiple judges would likely agree on the jail sentence imposed—the result that jail deters voting could well hold. The “compliers” in this IV analysis differ from the general defendant population in that they fell into a realm of sentencing uncertainty (though they themselves might not know this). But to the extent they are similar to other defendants on characteristics that drive voting propensity, the effects identified for these compliers should hold for many other defendants as well. In this case, the impact on voter turnout could be massive: misdemeanor cases are incredibly common across the country, and hundreds of thousands of short jail terms are given out each year.
As noted above, the jail sentences distributed to misdemeanor defendants in Harris County are usually quite short: most range from a few days to several weeks. That these sentences shape voter turnout in the next election is quite striking. That the effect may persist through multiple election cycles implies that such sentences could have large effects on voter turnout. If some voters simply drop out of the electorate for years after receiving such a sentence, then the political effects of sentencing could build up over time.
Finally, jail’s disproportionate effect on Black turnout has serious implications for the makeup of the electorate. African Americans are already disproportionately represented in the criminal justice system. A larger estimated effect for Black defendants (in addition to their being more likely to face such jail terms) means that demobilization will be even more pronounced for Black voters. In areas with extremely high levels of criminal justice contact, this could lead to substantial drops in voter turnout. As noted above, the persistence of jail’s effect on voting mean that misdemeanor sentencing could be producing lower Black turnout in such areas for years to come.
SUPPLEMENTARY MATERIAL
To view supplementary material for this article, please visit https://doi.org/10.1017/S000305541800093X.
Replication materials can be found on Dataverse at: https://doi.org/10.7910/DVN/TWVXKZ.




Comments
No Comments have been published for this article.