Introduction
The sensitivity of lichens to phytotoxic gases (mainly SO2 and NOx) underlies their use in assessing and monitoring the effects of atmospheric pollution (Hawksworth & Rose Reference Hawksworth and Rose1970; Richardson Reference Richardson1993). Lichen biomonitoring is often used to integrate instrumental data on atmospheric pollution (Nimis et al. Reference Nimis, Castello and Perotti1990; Giordani et al. Reference Giordani, Brunialti and Alleteo2002; Pinho et al. Reference Pinho, Augusto, Branquinho, Bio, Pereira, Soares and Catarino2004; Giordani Reference Giordani2007) and for developing forecasts in connection with human health (Cislaghi & Nimis Reference Cislaghi and Nimis1997). Lichen diversity is also used for long-term biomonitoring in both small-scale (Nimis et al. Reference Nimis, Castello and Perotti1990; Loppi et al. Reference Loppi, Frati, Paoli, Bigagli, Rossetti, Bruscoli and Corsini2004; Giordani Reference Giordani2007) and large-scale surveys (Nimis et al. Reference Nimis, Lazzarin, Lazzarin and Gasparo1991; van Dobben & DeBakker Reference van Dobben and DeBakker1996; Bennett & Wetmore Reference Bennett and Wetmore1999; Frati & Brunialti Reference Frati and Brunialti2006; Giordani Reference Giordani2006; Giordani et al. 2014 Reference Giordani, Calatayud, Stofer, Seidling, Granke and Fischera ; Matos et al. Reference Matos, Geiser, Hardman, Glavich, Pinho, Nunes, Soares and Branquinho2017).
Species richness and abundance are the most commonly considered components of biodiversity (Purvis & Hector Reference Purvis and Hector2000). However, because biodiversity is a multidimensional concept, it cannot be sensibly reduced to a single number. Ecological data matrices carry more information on numerous important ecological phenomena which are often overlooked, including beta diversity and nestedness (Podani et al. Reference Podani, Ricotta and Schmera2013). In particular, beta diversity was originally defined to describe variation in communities as a response to complex environmental gradients or patterns (Whittaker Reference Whittaker1960), which is often the final goal of biomonitoring studies. Yet lichen communities are mainly analysed in terms of alpha diversity and/or by means of abundance descriptors (Nimis et al. Reference Nimis, Scheidegger and Wolseley2002), with few studies assessing beta diversity (Nascimbene et al. Reference Nascimbene, Benesperi, Brunialti, Catalano, Dalle Vedove, Grillo, Isocrono, Matteucci, Potenza and Puntillo2013, Reference Nascimbene, Lazzaro and Benesperi2015; Giordani et al. 2014b, Reference Giordani, Rizzi, Caselli, Modenesi, Malaspina and Mariotti2016). Beta diversity could provide insights into the mechanisms and drivers influencing species turnover and replacement in lichen communities. These aspects could be easily exploited in repeated biomonitoring campaigns, such as for studying substratum re-colonization related to the decreasing impact of air pollutants. Moreover, beta diversity could be effectively used in spatio-temporal biomonitoring studies to elucidate how spatial variation changes through time, or conversely how and why the temporal variation differs from site to site (Legendre & Gauthier Reference Legendre and Gauthier2014).
The way in which beta diversity is defined and quantified remains extremely controversial (e.g. Whittaker Reference Whittaker1960, Reference Whittaker1972; Legendre et al. Reference Legendre, Daniel Borcard and Peres-Neto2005; Baselga Reference Baselga2010; Podani & Schmera Reference Podani and Schmera2011). In the current study, we adopted the method proposed by Podani & Schmera (Reference Podani and Schmera2011) which calculates three complementary indices that measure similarity (S), species replacement (R) and differences in richness (D) for all pairs of sites by partitioning pairwise gamma diversity into three additive components. According to this approach, beta diversity is expressed as the additive result of R and D. We aimed to investigate the utility of the relationship between the alpha and gamma diversity components (R, D and S), together with that of beta diversity (R+D) and similarity, for assessing complex variation in epiphytic lichen communities along a changing pollution scenario. We hypothesized that beta diversity (R+D) and similarity are efficient indicators of pollution trends at both spatial and temporal scales. In particular, we separated the effects of spatial versus temporal variation in the gamma diversity components (R, D and S), taking into account short-, intermediate- and long-term reference periods. Our results are expected to inform researchers and managers of the timescales required for detecting changes in air quality in long-term biomonitoring surveys.
Material and Methods
Study area
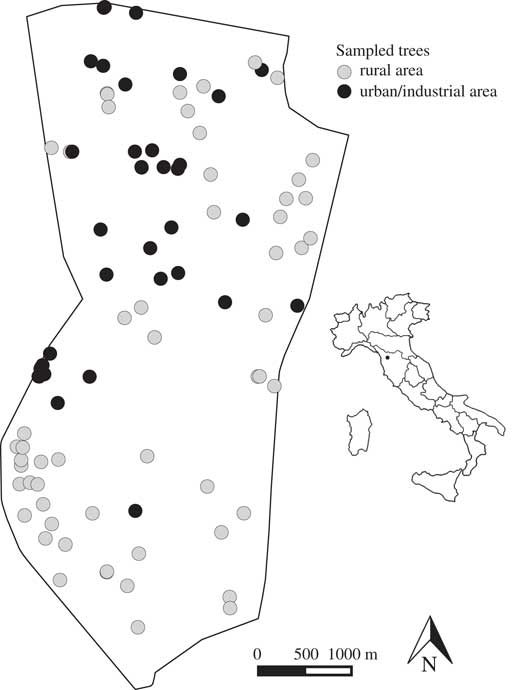
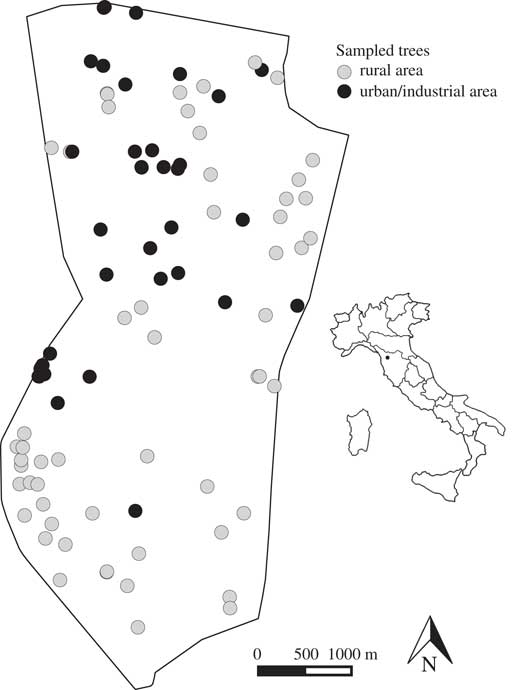
This study was conducted in the municipality of Porcari, in the Province of Lucca (Tuscany, central Italy), which has a population of c. 8000 (Fig. 1). The study area (18·2 km2) is essentially flat, with an elevation in the range of 8–107 m a.s.l. Two main land use categories are represented: 1) urban and industrial areas (CORINE Land Cover code 1: artificial surfaces, including urban, industrial and artificial non-agricultural vegetated areas; 6·2 km2, 34% of the study area), and 2) rural areas (CORINE Land Cover code 2: agricultural areas, including arable lands, permanent crops, pastures, heterogeneous agricultural areas; 12 km2, 66% of the study area). The climate is sub-Mediterranean, with a mean annual rainfall of c. 980 mm and a mean annual temperature of 14·1°C. Prevailing winds are south-westerly.
Survey area used in this study, the municipality of Porcari (LU), Tuscany, central Italy. Location of 93 sampled trees (circles) within two main land use categories, rural and urban/industrial.
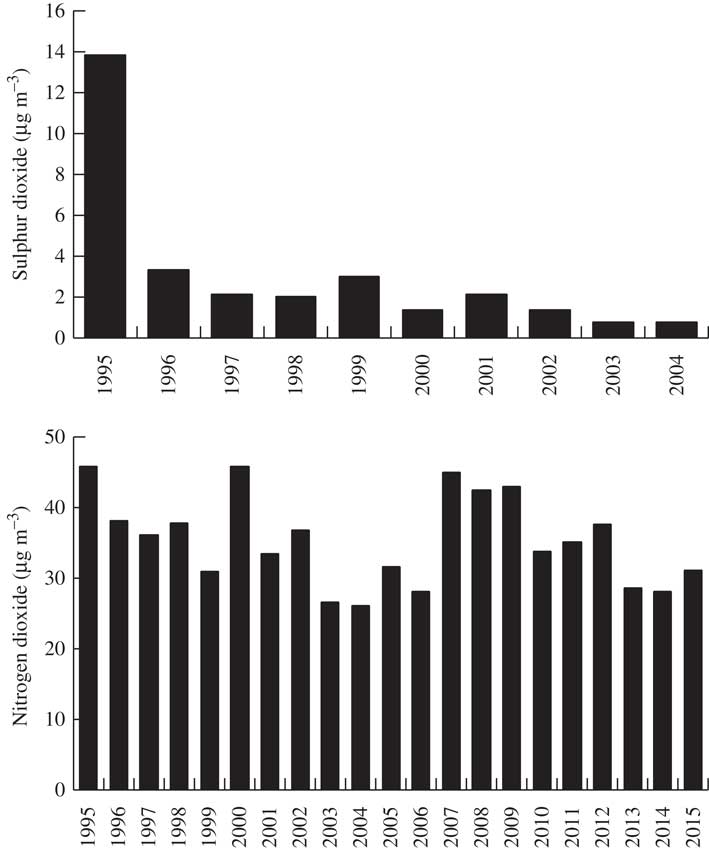
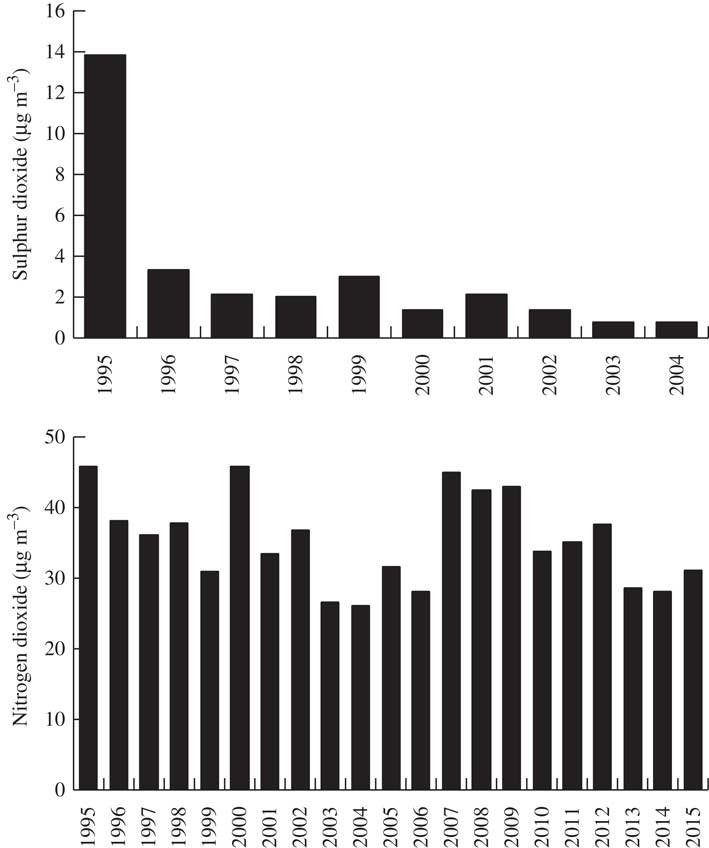
A railway line crosses the northern part of the study area which also contains 20 large factories with over 2000 employees. Seven of the factories are paper mills that account for over 30% of national production. The impact on the region of this important industrial sector includes both direct emissions into the atmosphere and also those from heavy traffic. A decreasing trend in SO2 concentration has been detected over the time-span of this study, while nitrogen dioxide does not show any clear trend (Fig. 2; data source: www.arpat.toscana.it).
Mean annual concentration (μg m−3) of sulphur and nitrogen dioxides in the study area measured using a regional network of automatic gauges. From 2005 onwards sulphur dioxide was below the threshold of detectability. Data source: http://www.arpat.toscana.it.
Sampling
After a preliminary investigation of suitable trees within the survey area, sampled trees were selected by means of plot-less (tree-based) stratified random sampling, with strata being based on land use categories (urban/industrial vs. rural). In 1997, 2010 and 2015, the same 93 trees belonging to species with sub-acid bark (Quercus robur, Q. rubra, Q. ilex, Q. pubescens and Tilia sp.) were sampled (Fig. 1), conforming to the standards described by Asta et al. (Reference Asta, Erhardt, Ferretti, Fornasier, Kirschbaum, Nimis, Purvis, Pirintsos, Scheidegger and van Haluwyn2002). In all instances tree circumference was >60 cm, inclination of the bole <10° and damaged and decorticated areas were absent. The abundance of each lichen, including crustose species, was sampled on the bole of each tree (from 1–1·5 m above the ground), following the protocol suggested by Asta et al. (Reference Asta, Erhardt, Ferretti, Fornasier, Kirschbaum, Nimis, Purvis, Pirintsos, Scheidegger and van Haluwyn2002). In this approach, a sampling grid consisting of four 10×50 cm ladders, each divided into five 10×10 cm quadrats was used.
For nomenclature, we followed Nimis (Reference Nimis2016). For calculating the relative contribution of nitrophytes, species were grouped according to nitrogen tolerance using an a priori classification (Nimis Reference Nimis2016). This classification uses a five-class ordinal scale where 1 is given to lichen species associated with sites with no eutrophication, while 5 corresponds to species able to tolerate very high eutrophication. For the purpose of this study, the maximum tolerance of each species was used; that is, the highest value within the range given by the classification. Species classified as 4–5 were considered as nitrophytic.
Data analyses
The presence/absence data matrix was analysed with SDR Simplex software (Podani Reference Podani2001), using the Simplex method (SDR Simplex; Podani & Schmera Reference Podani and Schmera2011). For all pairs of plots, we evaluated the relative contributions of components of gamma diversity (i.e. species replacement, R; richness difference, D; and similarity, S). In particular, S corresponds to the Jaccard coefficient of similarity such that:
 $${\rm S}\, {\equals} \, a\,/\,n{\rm }\,{\times}\,100$$
where a is the number of species shared by two trees and n is the total number of species. D was calculated as the ratio of the difference between the number of species on each tree (b,c) and the total number of species (n):
 $${\rm D}\, {\equals} \, \mid\!b{\minus}c\!\mid\!/n{\rm }{\times}100$$
R was calculated as:
 $${\rm R}\, {\equals} \, 2{\rm }{\times}\min \{ b,\!c\} \,/\,n{\rm }{\, \times}\, 100$$
Podani & Schmera (Reference Podani and Schmera2011) stated that beta diversity may be calculated as the sum of R+D. Tree pair comparisons were organized into subsets, based on the type of land use where trees were located and on the years of observation. Pairwise comparisons between lichen communities sampled on the same trees during different time periods provided information on a purely temporal effect. Specifically, we considered three reference periods: long-term (1997 vs. 2015), intermediate-term (1997 vs. 2010) and short-term (2010 vs. 2015). Pairwise comparisons between different trees for a given time period were used to explore the spatial variability of R, D and S components. Trees were identified as pairs in either a rural or an urban area as well as pairs that occurred on two different land use types (i.e. one tree in a rural area and one tree in an urban area).
Generalized Linear Models (GLM) were obtained to explore the relationships between R, D and S, alpha diversity and land use for short-, intermediate- and long-term comparisons. A Gaussian error distribution and an identity link function were considered for the models. The Akaike Information Criterion (AIC) (Akaike Reference Akaike1979) was calculated for each model, using the lme4 package in R version 3.0 (R Core Team 2017).
Results
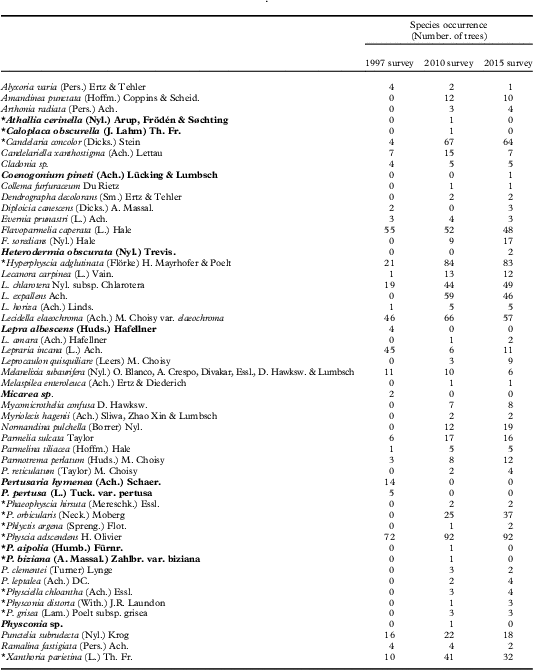
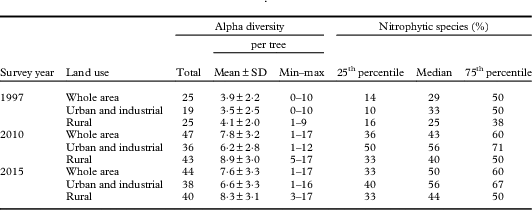
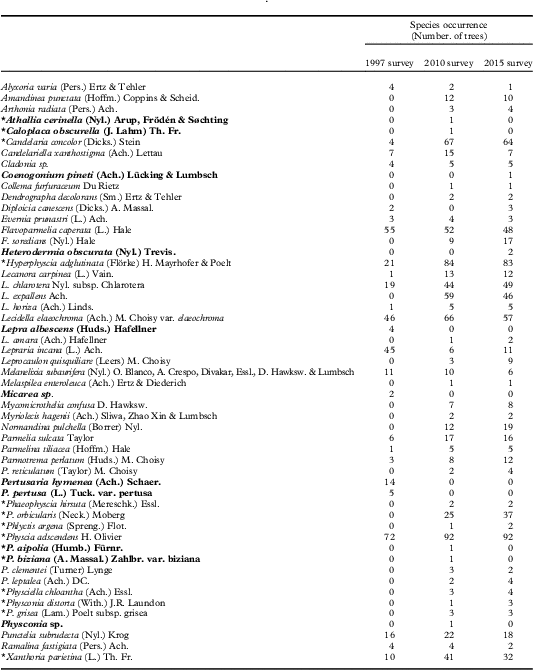
Overall, 54 lichen species were found in the study area. Twenty-five species were found in 1997, 47 in 2010 and 44 in 2015. (Table 1; Appendix 1). Of these species, 26 were crustose (including both leprose and squamulose types), 24 foliose (14 narrow-lobed and 10 broad-lobed) and only four were fruticose. In each survey, the highest values of alpha diversity were found in rural (mean number of species ranging from 4·1±2·0 to 8·9±3·0) rather than urban and industrial areas (from 3·5±2·5 to 6·6±3·3).
Alpha diversity of lichens and percentage of nitrophytic species on trees sampled during three surveys in the Province of Lucca, NW Italy (Fig. 1)
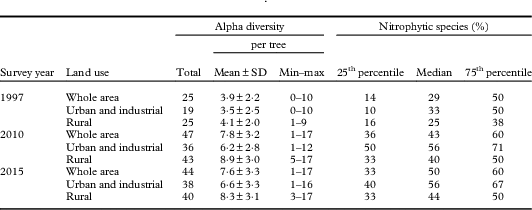
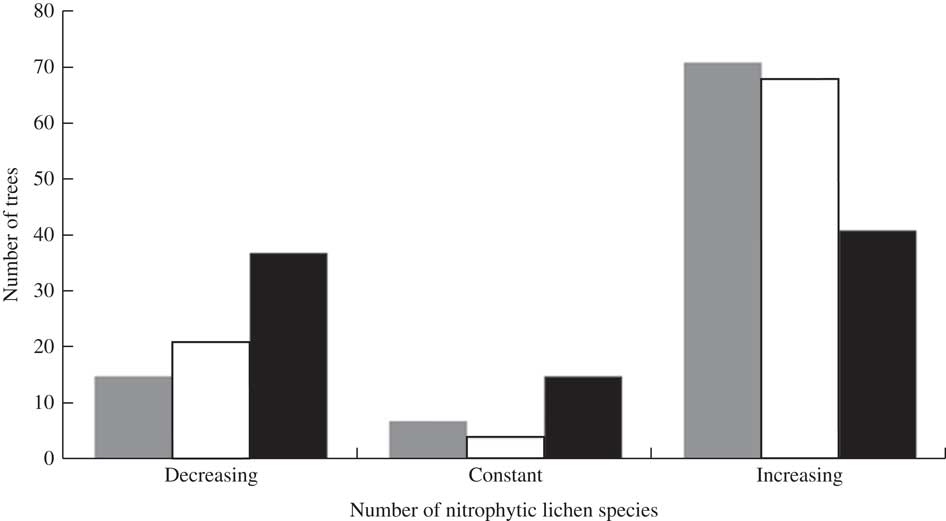
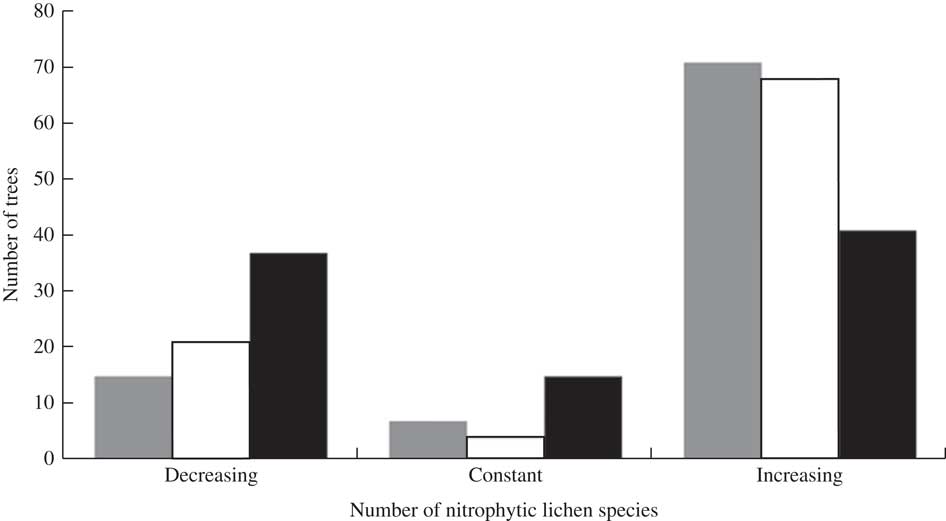
The median value of the number of nitrophytic species per tree increased from 30% in 1997 to 50% in 2015; both the 25th and 75th percentile of the distribution of these species showed a comparable increase, rising from 50% to 60% and from 15% to 35%, respectively. Accordingly, the number of trees that showed variation in the relative contribution (%) of nitrophytic species to the lichen community was fairly high (Fig. 3). In particular, nitrophytic species increased on 71 trees when considering long- and intermediate-term periods and on 41 trees in the short-term period. A decline in nitrophytic species was observed in 15, 21 and 37 trees for long-, intermediate-, and short-term reference periods, respectively.
Changes in the number of nitrophytic lichen species on trees sampled in each of three reference periods in the study area: long-term (1997 vs. 2015, grey bars), intermediate-term (1997 vs. 2010, white bars) and short-term (2010 vs. 2015, black bars).
SDR analysis
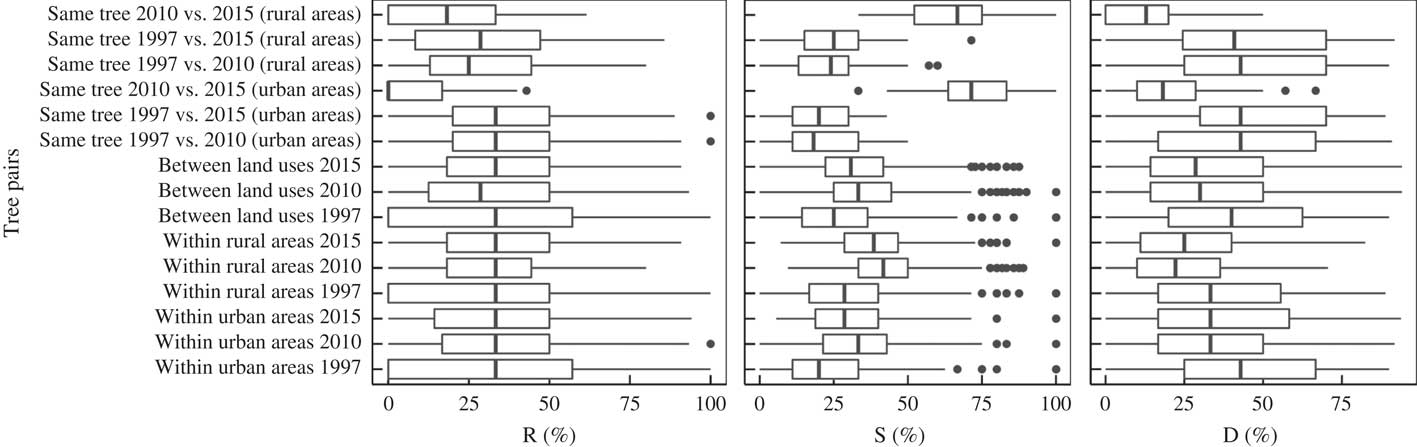
The SDR analysis revealed that the structures of lichen communities in the study area were nearly random, being characterized by comparable values of similarity, species replacement and differences in richness for most of the subset of data considered (Fig. 4). In particular, R was fairly constant, with median values of mostly c. 30%, whereas D and S showed much more variability, with the former ranging from 12·9 to 42·9% and the latter ranging from 18·2 to 71·4%.
Distribution of gamma diversity components in spatial and temporal datasets. R=species replacement, S=similarity and D=difference in richness. Box=25th–75th percentiles, line=median, whiskers=range, black circles=outliers.
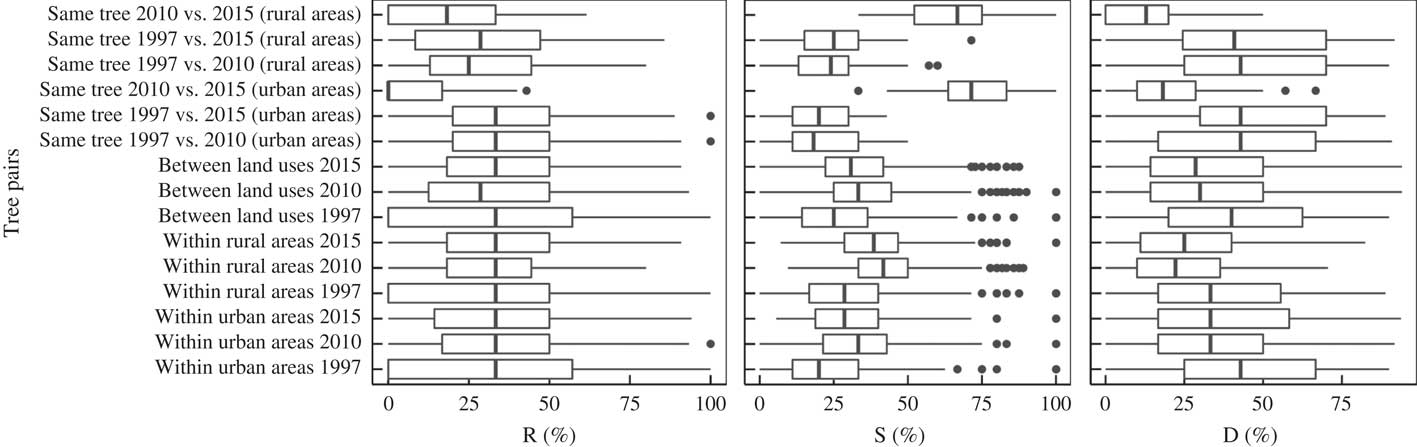
When considering spatial variation between trees located in different land uses for given time periods, in 1997 significantly lower R and D and significantly higher S were observed when compared with 2010 and 2015. A similar pattern was also observed for tree pairs from rural areas, which had significantly higher S and significantly lower D in 1997 versus 2010 and 2015. In 2015, tree pairs in urban areas had higher D and lower S compared with tree pairs in previous surveys.
Species replacement (R) was also noticeably constant when analysing the structure of communities on the same tree (purely temporal effect). In these cases, in both urban and rural areas we observed lower S and higher D in short-term pairs (2010 vs. 2015) compared with intermediate- (1997 vs. 2010) and long-term (1997 vs. 2015) pairs.
GLM models
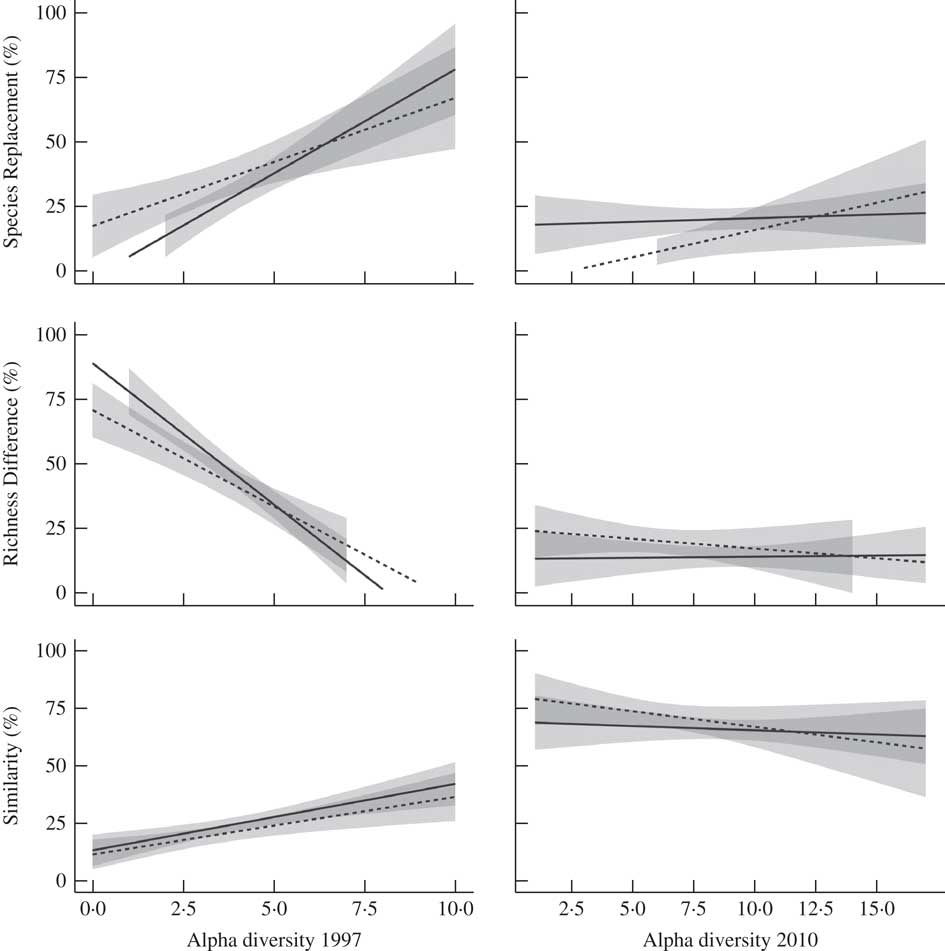
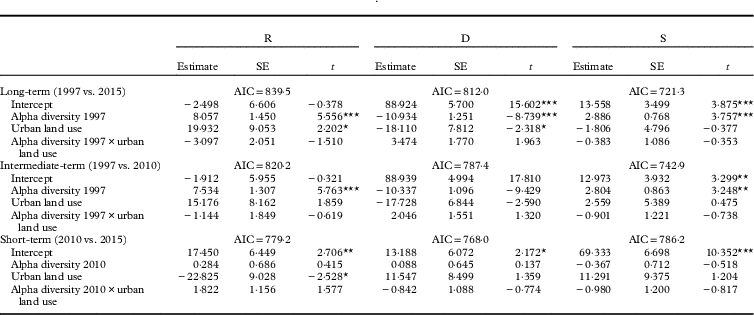
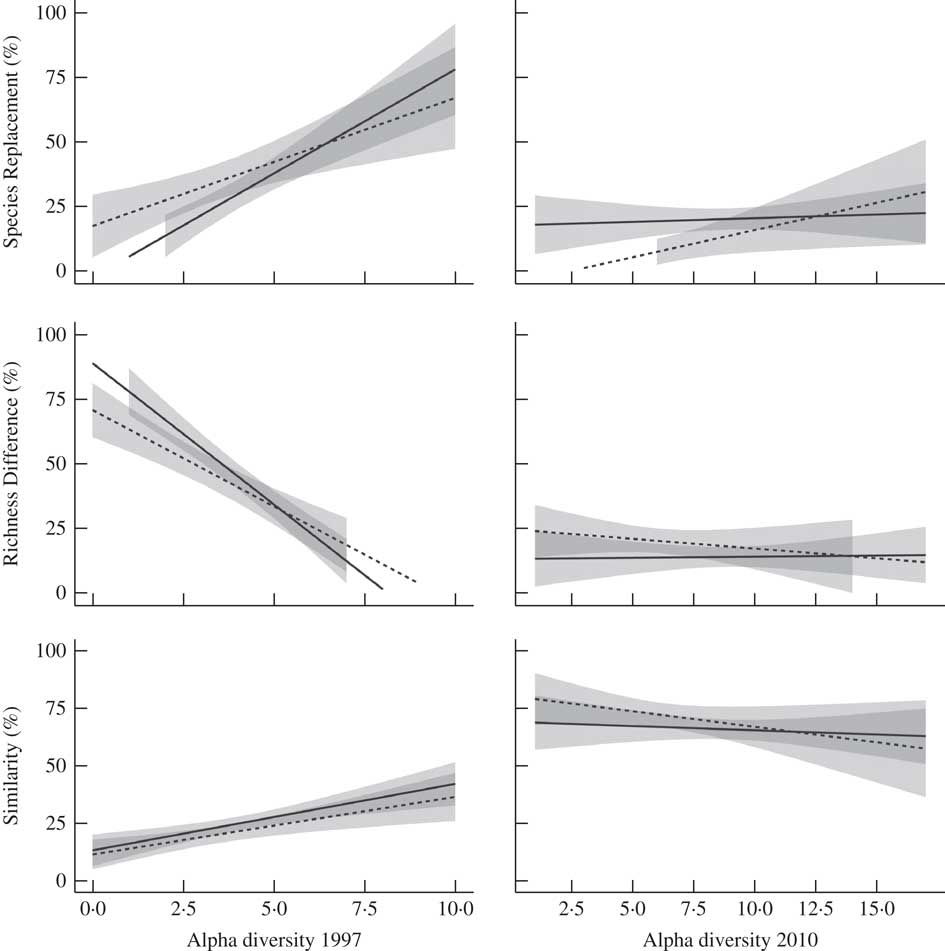
We explored the effects of land use and alpha diversity on variation in R, D and S components in the ‘same tree’ datasets (Table 2). Alpha diversity in 1997 consistently showed significant effects on the three components (R, D, S) for both intermediate- and long-term reference comparisons, with the exception of D in intermediate-term pairs. When focusing on long-term variation, a shift from low to highly diverse lichen communities was detected, with R increasing from 0 to c. 70%, S increasing from 15 to 40% and D decreasing from 80 to 0% (Fig. 5).
Fitted modelled relationships between alpha diversity, land use and diversity components R, D and S, according to the GLM models of Table 2, for long-term (right) and short-term reference periods (left). Bands represent 95% confidence intervals. Solid line=rural land use, dashed line=urban/industrial land use
Generalised Linear Models describing the effects of land use and alpha diversity on the gamma diversity components S (similarity), R (species replacement) and D (difference in richness) for long-, medium- and short-term reference periods. *=statistically significant
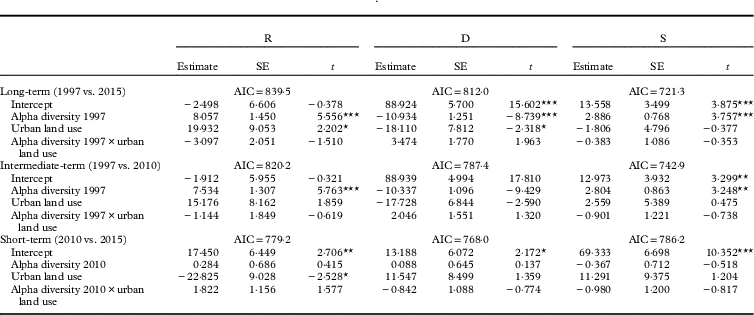
*P<0·05; **P<0·01; ***P<0·001. AIC=Akaike Information Criterion.
Land use was a significant driver for R and D in long-term comparisons, whereas it had no effect when comparing tree pairs of 1997 versus 2010. Variation in R, D and S in the short-term seemed to be unaffected by the alpha diversity of the community measured at the beginning of the observation period. It is noteworthy that the interaction between alpha diversity and land use had no significant effects on the three components throughout the study period.
Spatial patterns in temporal variation
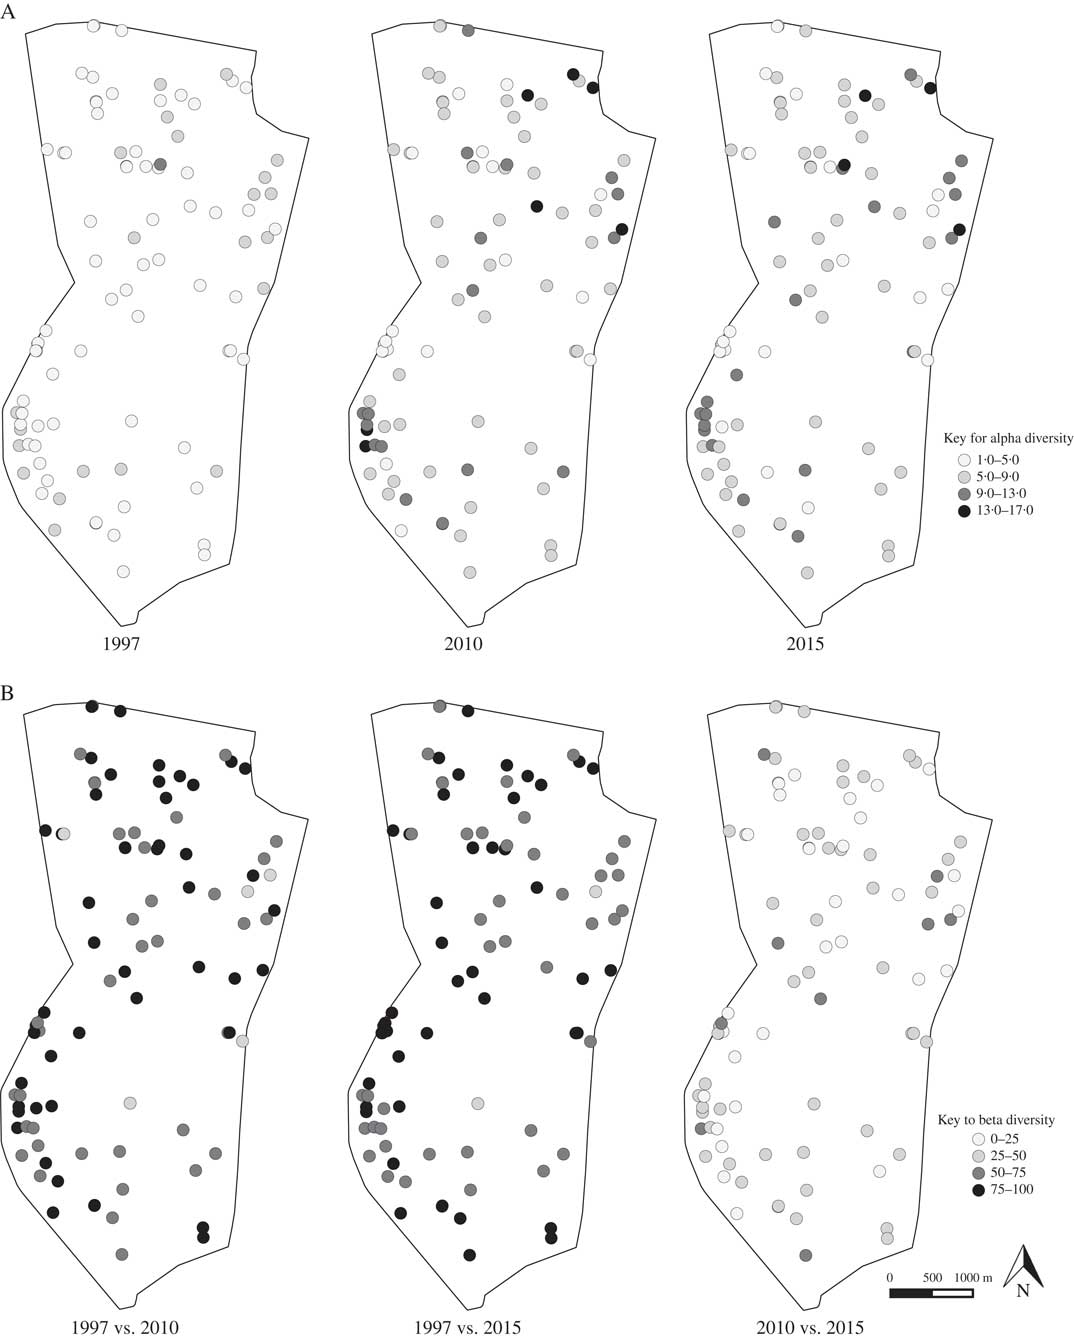
In 1997 alpha diversity was low and homogeneous throughout the survey area (Fig. 6). Alpha diversity increased in 2010 and was particularly evident in the SW and NE parts of the study area. The overall pattern of alpha diversity was maintained in 2015, with no obvious major changes.
Spatial patterns of lichen diversity on sampled trees (circles) in the study area. A, alpha diversity (number of species) in surveys undertaken in 1997, 2010 and 2015; B, beta diversity (sum of R and D) for three reference periods, 1997 vs. 2015, 1997 vs. 2010, and 2010 vs. 2015.
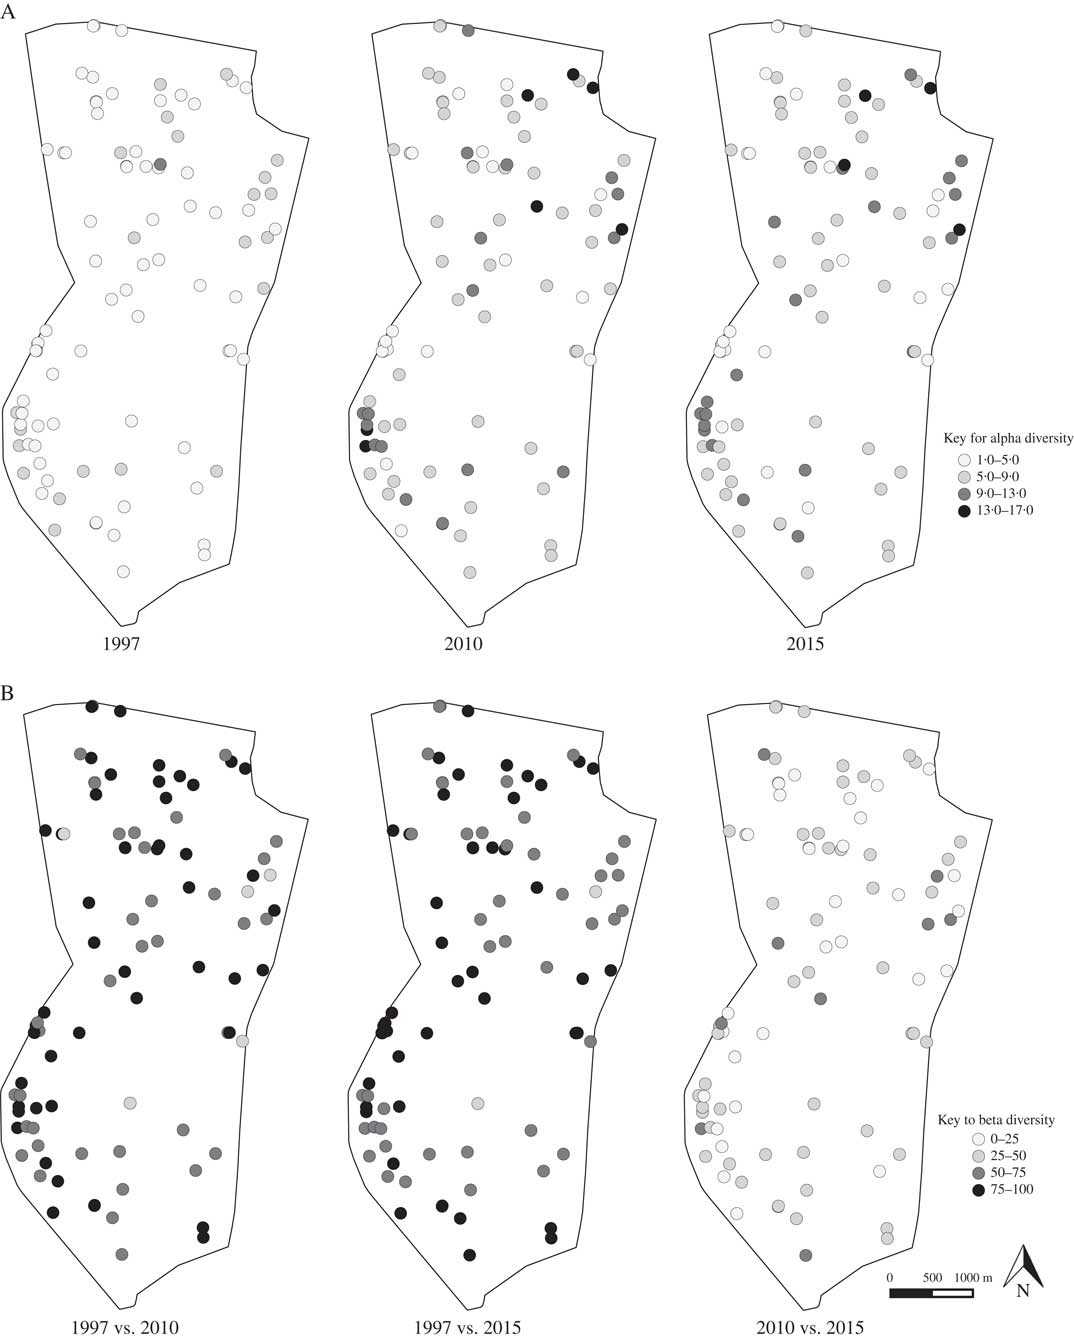
The spatial pattern of beta diversity (calculated as the sum of R+D) was somewhat homogeneous, even though differences were observed at different time periods. For both intermediate- and long-term comparisons, beta diversity was high (>50%) throughout the study area. For short-term comparisons, beta diversity decreased and was mostly <50% in all sampled trees.
Discussion
This study explored changes in lichen diversity and composition in an area subjected to drastic variation in atmospheric pollution in recent decades (Fig. 2). Our results showed that the SDR approach was useful for discriminating between temporal and spatial effects, improving our understanding of the mechanisms underlying the succession of lichen communities through short-, intermediate- and long-term reference periods. In particular, the analysis of similarity, species replacement and differences in richness of tree pairs highlighted that the trends and patterns within lichen communities are not always, and not to the same extent, associated with alpha diversity.
Consequently, spatial variability is expressed in terms of comparisons of lichen communities colonizing different trees within and between land use categories. Similarity (i.e. the proportion of species shared by two trees) was the diversity component that succeeded in expressing spatial variation in lichen communities more than species replacement and differences in richness which were more homogeneous. In fact, similarity between trees located in different land uses exceeded 75% in 1997 and decreased in more recent comparisons. Similarity between trees in rural areas, which was very high in 1997, decreased considerably in subsequent surveys whereas comparable effects were not detected between trees located in urban areas.
Sign of the times: temporal variation in beta diversity
In this work we partitioned a pure temporal effect on lichen communities, taking into account variation in their composition on the same tree after different time periods (i.e. 1997 vs. 2015, 1997 vs. 2010 and 2010 vs. 2015). The analysis of the temporal variation in gamma diversity components revealed that species replacement was constant for all reference periods. However, greater differences in richness and lower similarity occurred over the short-term.
Variation in lichen communities over the long- (1997 vs. 2015) and intermediate-terms (1997 vs. 2010) was strongly dependent on the alpha diversity of single trees at the beginning of the observation period. This effect was evident for all diversity components. In fact, species-rich lichen communities had higher species replacement compared with those with a lower diversity. Thus, the total number of lichen species in the richest communities did not change but considerable variation in species composition was detected. This phenomenon leads to increasing similarity and decreasing differences in richness between lichen communities. Conversely, for lichens on species-poor trees, most variation over intermediate- and long-term was due to an increased difference in richness compared to 1997 and indicated increasing overall diversity of these communities through time. Finally, on a short-term basis (2010 vs. 2015), variation in gamma components was independent of alpha diversity measured at the beginning of the study period. These results could be attributed to the increasing contribution of nitrophytic species which benefitted from a decrease in SO2 concentrations. Sulphur dioxide has been the main pollutant affecting the distribution of lichens in urban and industrial areas (Hawksworth & Rose Reference Hawksworth and Rose1970), with high concentrations of SO2 being strongly correlated with a decline in lichens (Seaward Reference Seaward1993). However, in recent decades a significant reduction in SO2 emissions globally has been observed, mainly due to recent policies for reducing pollution. In Europe, SO2 emissions decreased by 76% between 1990 and 2009. Substantial reductions in SO2 emissions have been made across a number of sectors, including road transport (98% reduction), energy use in industry (80%), commercial, institutional and households (76%) and waste (72%) (http://www.eea.europa.eu). As a consequence of decreasing SO2 emissions, several long-term lichen biomonitoring studies carried out in the past 15 years have shown marked re-colonization, mainly by nitrophytic species, which has resulted in a general improvement in lichen biodiversity (see e.g. van Dobben & Ter Braak Reference van Dobben and ter Braak1998; Hultengren et al. Reference Hultengren, Gralén and Pleijel2004; Frati & Brunialti Reference Frati and Brunialti2006; Larsen et al. Reference Larsen, Bell, James, Chimonides, Rumsey, Tremper and Purvis2007; Adamska Reference Adamska2011). Decreasing SO2 levels lead to an upward trend in bark pH, resulting in ameliorated conditions for nitrophytic species that prefer sites with a high bark pH (van Herk Reference van Herk2001). Nitrophytic species are more sensitive to SO2 compared to other species and, consequently, benefit from the decline of this pollutant in the environment. Moreover, in ameliorating environmental conditions, nitrophytic species are able to colonize new sites more rapidly compared to other lichen species (van Dobben & Ter Braak Reference van Dobben and ter Braak1999). It is worth noting that lichen communities during the short-term period were subjected to a different pollution scenario, such that SO2 atmospheric concentrations were below detectable levels. However, our results suggest that analysis of lichen diversity in biomonitoring studies should incorporate previous dynamics in the colonization processes of lichen communities because these dynamics could influence current compositions and could lead to data being misinterpreted in terms of the effects of atmospheric pollution.
Effect of land use on lichen diversity decreased as a result of biotic homogenization
The effect of land use on lichen diversity was only detected over the long-term reference period (1997 versus 2015), with lichens on trees in urban areas showing less variation than those located in rural areas (Fig. 1). However, the interaction between alpha diversity and land use type was not significant (Table 2). Thus, the relationship between alpha and beta lichen diversity followed similar trends, independent of the land use type where the trees occurred. This observation supports a progressive biotic homogenization of lichen communities. Giordani & Malaspina (Reference Giordani and Malaspina2017) observed that, under high eutrophication levels, differences in bark pH did not cause significant differentiation in the composition of epiphytic lichen communities. Nascimbene et al. (Reference Nascimbene, Lazzaro and Benesperi2015) reported the progressive biological homogenization of highly competitive, nitrogen-tolerant species associated with the spread of alien black locust forests. A similar trend was also observed for epilithic lichen communities in alpine pasturelands as a consequence of increased cattle load (Giordani et al. 2014 Reference Giordani, Matteucci, Redana, Ferrarese and Isocronob ).
Conclusions
Detailed information on the different aspects of gamma diversity, including beta diversity and similarity, is required to detect air quality changes in long-term biomonitoring surveys. At present, no single pollutant causes major changes in the structure of lichen communities; instead, several pollutants are acting together, leading to different impacts. Consequently, alpha lichen diversity no longer represents an effective response variable for assessing trends in atmospheric pollutants over time. This study shows that temporal and spatial variation in lichen diversity could be evaluated using beta diversity and similarity. This information could then be used to quantify anthropogenic impacts in a given region and monitor the effects of the policy measures adopted to reduce pollution levels.
This study was funded by the Municipality of Porcari (LU). Special thanks are due to Franco Fanucchi and Angelo Marchi (Municipality of Porcari) for their collaboration and to Monica Pisani (ARPAT) for local air quality information.