Coarctation of the aorta is a common congenital cardiac defect involving narrowing of the aorta, which presents over a wide range of ages and degrees of severity.Reference Darabian, Zeb, Rezaeian, Razipour and Budoff 1 Severity of arch obstruction is most commonly assessed using two-dimensional echocardiography and spectral Doppler analysis, which calculates the peak instantaneous pressure gradient across the narrowing using Bernoulli’s principle.Reference Carvalho, Redington, Shinebourne, Rigby and Gibson 2 , Reference Tan, Babu-Narayan, Henein, Mullen and Li 3 In contrast to Doppler measurements, invasive cardiac catheterisation measures the peak-to-peak gradient across the coarctation and is the gold standard in the paediatric population.Reference Nihoyannopoulos, Karas, Sapsford, Hallidie-Smith and Foale 4
Several non-invasive methods have attempted to predict catheter gradients before intervention or identify residual obstruction after repair, but none of them have gained universal acceptance.Reference Carvalho, Redington, Shinebourne, Rigby and Gibson 2 , Reference Cyran 5 – Reference Simpson, Sahn, Valdes-Cruz, Chung, Sherman and Swensson 8 In most cases, Doppler-measured pressure gradients overestimate catheter-measured pressure gradients.Reference Giardini and Tacy 9 , Reference Seifert, DesRochers and Ta 10 Various modifications to the Doppler calculations, in both in vitro and in vivo models, have attempted to improve these estimates. These include accounting for pre-coarctation velocity, distal diastolic continuation of flow, and the effect of pressure recovery.Reference Giardini and Tacy 9 – Reference Wilson, Sutherland, Gibbs, Dickinson and Keeton 14
Existing studies primarily report correlation of Doppler-measured pressure gradients with catheter-measured pressure gradients in patients with native or recurrent coarctation of the aorta. Very few studies include patients with more complex aortic arch reconstructions or patients with a functional single ventricle. The improved survival of patients with complex arch reconstructions and the high risk that residual aortic obstruction imposes on these patients with functional single ventricles necessitate additional examination of the ability of non-invasive measurements to accurately diagnose residual obstruction.Reference Hill, Rhodes and Aiyagari 15 , Reference Sekar, Border and Kimball 16 The purpose of this study was to compare multiple, commonly performed, non-invasive measurements with invasive catheter gradients, and to define non-invasive predictors of haemodynamically significant aortic arch obstruction.
Materials and methods
We performed a single-centre retrospective review between the years 2005 and 2010 of the hospital echocardiography and cardiac catheterisation databases to identify patients with any of the following diagnoses: native coarctation of the aorta, recurrent coarctation of the aorta, hypoplastic left heart syndrome/single ventricle with aortic arch reconstruction, and interrupted aortic arch with ventricular septal defect requiring aortic arch reconstruction. Patients with these diagnoses who underwent cardiac catheterisation and who had a pre- and post-procedure echocardiogram within 4 weeks of the catheterisation were included in the analysis. The study was approved by the Institutional Review Board.
All catheterisations were performed under general anaesthesia with femoral or jugular venous and femoral arterial vascular access. Invasive pressure measurements were carried out using calibrated fluid-filled catheters. The peak-to-peak gradient was measured in the majority of cases, 49 out of 60, using the retrograde pull-back technique. Cardiac output was calculated using the Fick equation and indexed to the patient’s body surface area.Reference Seifert, DesRochers and Ta 10 Normal cardiac index was defined a priori as a value ⩾3 L/min/m2. Data were collected by the investigators from the catheterisation reports that are stored in the electronic medical record. Pre-catheterisation echocardiogram pressure gradients were compared with the initial pressure gradient obtained at catheterisation before intervention. Post-catheterisation echocardiogram pressure gradients were compared with the gradients measured during catheterisation following intervention.
Echocardiograms were performed with patients awake or under light sedation from standard transthoracic, subxiphoid, and suprasternal notch views using the transducer appropriate for the patient’s size. All studies were performed using models 5500, 7500, or IE33; Philips Medical Systems, Eindhoven, The Netherlands. Spectral Doppler measurements were guided by colour-flow Doppler and optimised for the most parallel angle of insonation to the direction of blood flow. Pulsed-wave Doppler was performed for abdominal aortic velocities and proximal aortic arch velocities. Continuous wave Doppler was performed to detect the maximum velocity across the aortic arch obstruction.
Echocardiographic measurements included the presence of diastolic continuation of flow in the abdominal aorta, aortic valve peak velocity, aortic arch peak velocity, the abdominal aortic systolic/diastolic ratio, and the abdominal aortic pulsatility index. The presence or absence of diastolic continuation of flow was assessed qualitatively based on the slope of the Doppler flow pattern and whether or not it returned to baseline during diastole. The abdominal aortic systolic/diastolic ratio was obtained from the pulsed-wave Doppler tracing using the velocity time integral. The abdominal aortic pulsatility index was calculated by dividing the difference of the maximum and minimum pulsed-wave Doppler velocities by the mean Doppler velocity. The Doppler peak instantaneous pressure gradient was calculated using both the simplified Bernoulli equation – peak instantaneous pressure gradient=4v2 – and the expanded Bernoulli equation – peak instantaneous pressure gradient=4([v2−v1])2 – with v2 representing the peak velocity at the coarctation and v1 representing the peak velocity proximal to the aortic arch obstruction.Reference Seifert, DesRochers and Ta 10 Significant aortic arch obstruction was defined a priori as a peak-to-peak gradient ⩾25 mmHg in patients with native or recurrent coarctation and a peak-to-peak gradient ⩾10 mmHg in patients with aortic reconstruction. All echocardiographic measurements were performed directly by the investigators using the images stored in the electronic medical record.
Statistical analysis
Echocardiographic measurements of pressure gradients were compared with catheter measurements using Spearman’s rank correlations. Receiver operating characteristic curve analysis tested the ability of Doppler to predict the presence of catheterisation-defined arch obstruction. The association between diastolic continuation of flow and the presence of arch obstruction was analysed using Fisher’s exact test. Data were analysed as all types of aortic arch obstructions and then divided into two a priori-determined groups as follows: native or recurrent coarctation and aortic arch reconstruction. Finally, to account for the known effect of cardiac index, we repeated our analysis dividing patients into those with a cardiac index ⩾3 L/min/m2 and those with a cardiac index<3 L/min/m2. All statistical analyses were conducted using Stata 12 (College Station, Texas, United States of America), all r-values were reported as r2 values, and a two-sided p-value <0.05 was considered statistically significant.
Results
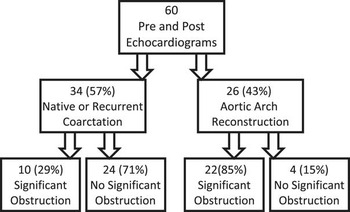
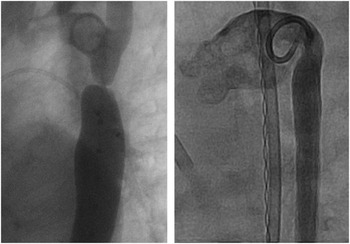
A total of 60 patients were identified with a diagnosis of coarctation or aortic arch reconstruction who underwent cardiac catheterisation and had echocardiograms within the specified time frame for inclusion in the study, resulting in 120 data points for analysis (Fig 1). The summary of patients’ demographic, catheterisation, and echocardiographic data is presented in Table 1. A total of 34 (57%) patients had a diagnosis of native or recurrent coarctation, whereas 26 (43%) patients had a diagnosis of aortic reconstruction, with all but four patients of the aortic reconstruction group having a diagnosis of hypoplastic left heart syndrome. The majority of patients in both the groups had discrete areas of coarctation (85%), with the remaining noted to have tortuous or longer tubular segments of coarctation (15%). Representative angiograms are shown in Figure 2. Presence of collateral vessels was noted during catheterisation in 11 (18%), with seven of these patients (27%) belonging to the aortic arch reconstruction group. Among all, 51 (85%) patients were male and 25 (42%) were ⩽6 months of age.
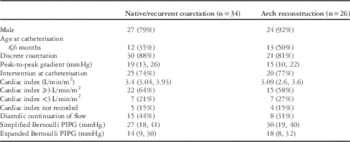
Patient demographic data by type of aortic obstruction. Significant obstruction defined as peak-to-peak gradient ⩾25 mmHg in patients with native or recurrent coarctation and peak-to-peak gradient ⩾10 mmHg in patients with aortic reconstruction.

Representative angiograms. Left: aortic angiogram obtained at cardiac catheterisation in a patient belonging to the native/recurrent coarctation group with a discrete coarctation. Right: aortic angiogram obtained at cardiac catheterisation in a patient with hypoplastic left heart syndrome status after aortic arch reconstruction with residual obstruction.

Patient demographics and haemodynamic data.

PIPG= peak instantaneous pressure gradient.
Data presented as counts (percentages) or medians (interquartile range).
The median peak-to-peak gradient was 17 mmHg (interquartile range 10, 24). Cardiac index was measured in 51 of the 60 patients. In the remaining patients, a cardiac index was not calculated as only arterial access was obtained during catheterisation. The median cardiac index in all the patients was 3.12 L/min/m2 (interquartile range 2.9, 3.9), with 37 out of 51 patients calculated as having a normal cardiac index of ⩾3 L/min/m2 at catheterisation. The median cardiac index in patients with native/recurrent coarctation was 3.4 L/min/m2 (interquartile range 3.04, 3.93), and the median cardiac index in patients with aortic arch reconstruction was 3.09 L/min/m2 (interquartile range 2.6, 3.6). Significant aortic arch obstruction as defined in this study was present in 32 patients (53%), of which 22 (69%) had aortic reconstruction.
Catheter intervention was common, occurring in 45 of 60 patients (75%). Of the patients who underwent catheter intervention, only 27 (45%) met the criteria for significant obstruction as defined in this study. Haemoglobin values were recorded for all the patients at the time of catheterisation with a median value of 13.3 (interquartile range 11.5, 13.96). These values were not significantly correlated with the presence of obstruction at cardiac catheterisation (p=0.12).
Blood pressure gradients between the upper and lower extremities were obtained for 20 (33%) patients included in the analysis. Of these patients, eight (40%) were noted to have a blood pressure gradient ⩾20 mmHg between their upper and lower extremities; however, this was not significantly correlated with the presence of significant obstruction at cardiac catheterisation, as defined in this study (p=0.55). Upper and lower blood pressure gradients were also compared with the measured peak-to-peak gradient obtained at catheterisation and did not show significant correlation (r=0.38, p=0.11).
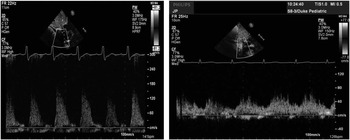
Diastolic continuation of flow, as demonstrated in Figure 3, was observed to be present in both types of aortic obstruction, and was noted in both patients with and without significant obstruction (9/32, 28%, and 14/28, 50%, p=0.16). Abdominal aortic systolic/diastolic ratios did not significantly correlate with the peak-to-peak gradient (r=0.27, p=0.08), but they did correlate weakly with peak instantaneous pressure gradient calculated using both the simplified and expanded Bernoulli equation (r=0.47, p=0.002 and r=0.41, p=0.007, respectively). Pulsatility index calculated in the abdominal aorta also did not significantly correlate with the peak-to-peak gradient (r=0.20, p=0.22), but it did correlate weakly with peak instantaneous pressure gradient calculated using both the simplified or expanded Bernoulli equation (r=0.44, p=0.003, and r=0.37, p=0.015, respectively).
Diastolic continuation of flow. Left: Doppler view of the abdominal aorta with diastolic continuation of flow absent. Right: Doppler view of the abdominal aorta with diastolic continuation of flow present.

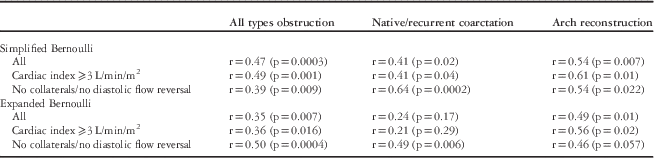
Correlation of Doppler measurements with catheter measurements is shown in Table 2. Taken together, in all forms of obstruction, the Doppler peak instantaneous pressure gradient calculated using the simplified Bernoulli equation correlated with the peak-to-peak gradient measured at catheterisation (0.47, p=0.003). This correlation was not significantly improved by using peak instantaneous pressure gradient calculated with the expanded Bernoulli equation (r=0.35, p=0.007). Exclusion of patients with collaterals present at catheterisation or presence of diastolic flow reversal in their abdominal aorta did not significantly affect these results calculated using either the simplified or the expanded Bernoulli equation (r=0.39, p=0.009, and r=0.50, p=0.0004, respectively).
Summary of correlations between Doppler peak instantaneous pressure gradient and catheter peak-to-peak gradient using the simplified and expanded Bernoulli equations.

When examined separately, the correlation between the Doppler peak instantaneous pressure gradient calculated using the simplified Bernoulli equation and the catheter peak-to-peak gradient was highest in patients with native/recurrent coarctation and with no collaterals or diastolic flow reversal (r=0.64, p=0.0002). This correlation was not improved with the use of the expanded Bernoulli equation.
In patients with aortic reconstruction, Doppler peak instantaneous pressure gradient calculated using the simplified and expanded Bernoulli equations correlated with the peak-to-peak gradient (r=0.54, p=0.007 and r=0.49, p=0.01, respectively). In patients with aortic arch reconstruction and a cardiac index ⩾3 L/min/m2, this association was improved using both the simplified Bernoulli equation (r=0.61, p=0.01) and the expanded Bernoulli equation (r=0.56, p=0.02).
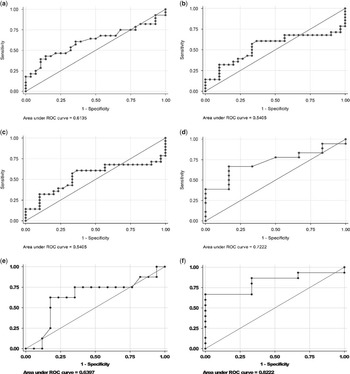
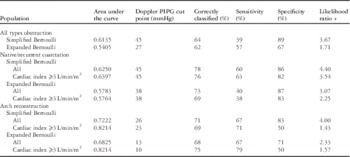
Receiver operating characteristic curve analysis (Table 3, Fig 4) showed an area under the curve of 0.61 for patients with all types of aortic arch obstruction, with a Doppler peak instantaneous pressure gradient cut-off point of 45 mmHg, correctly classifying 64% of patients with significant arch obstruction with a sensitivity of 39% and specificity of 89%. Use of the expanded Bernoulli equation in patients with all types of aortic arch obstruction produced an area under the curve of 0.54, with a Doppler peak instantaneous pressure gradient cut-off point of 27 mmHg, correctly classifying 62% of patients with 57% sensitivity and 67% specificity. When this analysis was performed in patients with native/recurrent coarctation, the results were similar to those obtained in all types of obstruction. The greatest area under the curve of 0.82 was seen in patients with aortic arch reconstruction who had a cardiac index ⩾3 L/min/m2 calculated using the simplified Bernoulli equation. In these patients, with arch reconstruction and a normal cardiac index ⩾3 L/min/m2, a Doppler peak instantaneous pressure gradient cut-off point of 23 mmHg correctly classified 69% of patients with 71% sensitivity and 50% specificity. Use of the expanded Bernoulli equation in patients with arch reconstruction and a cardiac index ⩾3 L/min/m2 produced an area under the curve of 0.82, with a Doppler peak instantaneous pressure gradient cut-off point of 10 mmHg, correctly classifying 75% of patients with significant obstruction with 79% sensitivity and 50% specificity.
Receiver operating characteristic curves. ( a ) All types of obstruction using the simplified Bernoulli equation, ( b ) all types of obstruction using the expanded Bernoulli equation, ( c ) native/recurrent coarctation using the simplified Bernoulli equation, ( d ) aortic arch reconstruction using the simplified Bernoulli equation, ( e ) native/recurrent coarctation using the simplified Bernoulli equation in patients with cardiac index ⩾3 L/min/m2, ( f ) aortic arch reconstruction using the simplified Bernoulli equation in patients with cardiac index ⩾3 L/min/m2.

ROC curve analysis.

PIPG=peak instantaneous pressure gradient; ROC=receiver operating characteristic
Discussion
In the paediatric population, invasive cardiac catheterisation is considered the gold standard measurement for determining the severity of coarctation of the aorta.Reference Nihoyannopoulos, Karas, Sapsford, Hallidie-Smith and Foale 4 Historically, a gradient of 20 mmHg noted between the upper and lower extremity blood pressure measurements in patients with coarctation has been used to indicate the need for catheterisation and possible intervention.Reference Sekar, Border and Kimball 16 Several previous studies have shown the correlation of non-invasive Doppler-derived peak instantaneous pressure gradient with catheter peak-to-peak gradient, but most of them have noted a tendency for overestimation of the catheter pressure gradient by Doppler.Reference Carvalho, Redington, Shinebourne, Rigby and Gibson 2 , Reference Cyran 5 – Reference Seifert, DesRochers and Ta 10 A few theories have been proposed to account for this difference: the stiffness of the proximal descending aorta, or the pre-coarctation segment, can alter the continuous wave-detected Doppler gradient,Reference Seifert, DesRochers and Ta 10 and the usual method of calculating Doppler peak instantaneous pressure gradient using the simplified Bernoulli equation does not account for the velocity proximal to the coarctation.Reference Seifert, DesRochers and Ta 10 Improved correlation has been reported between Doppler peak instantaneous pressure gradient and catheter peak-to-peak gradient when both the proximal and the distal velocities were included in the Doppler calculation.Reference Aldousany, DiSessa, Alpert, Birnbaum and Willey 11 , Reference Marx and Allen 13 In addition, pressure recovery occurs downstream at the site where a catheter is generally placed leading to a different gradient than that measured by Doppler.Reference Niederberger, Schima, Maurer and Baumgartner 17 This has been especially noted when the coarctation is mild and the distal aorta is not dilated.Reference Giardini and Tacy 9
In this retrospective study of children, a wide range of conditions associated with narrowing of the aorta were analysed, including native and recurrent coarctation of the aorta as well as aortic arch reconstruction associated with single ventricle pathology. The latter group has not been extensively evaluated to date with regard to measurement of pressure gradients by Doppler versus catheterisation.Reference Sekar, Border and Kimball 16
Patients with single ventricle arch reconstructions are at an increased risk of recurrent/residual arch obstruction due to the complexity of the surgical reconstruction, which often involves adaptation of a severely hypoplastic segment. Residual or recurrent aortic obstruction also constitutes a high-risk lesion by imposing an increased afterload state that may compromise systolic function or induce ventricular hypertrophy, which compromises diastolic function to the detriment of the passive pulmonary circulation.Reference Walker and Stuth 18 It is, therefore, possible that intervention may be performed in these patients at lower gradients compared with patients with simpler coarctation or without regard to the measured pressure gradient. To account for these differences, we used the following two distinct definitions for significant obstruction: peak-to-peak gradient ⩾25 mmHg in patients with native or recurrent coarctation and peak-to-peak gradient ⩾10 mmHg in patients with aortic arch reconstruction. These definitions for significant obstruction are based on historical data alone, which suggest that single ventricle patients are likely to undergo catheter-based interventions for lower pressure gradients and are, therefore, somewhat arbitrary, but are necessary in distinguishing two different patient populations. We also analysed our correlation data separately in patients with a normal cardiac index to attempt to account for differences in ventricular function/cardiac output.
In this study, intervention for coarctation was common and occurred at a wide range of pressure gradients. One possible explanation for this finding is that once a patient is undergoing an invasive catheterisation procedure, the threshold for intervention may be lower. This is especially true in single ventricle patients who are at greater risk for morbidity and mortality, both in the setting of arch obstruction and with any invasive procedure. Our data are consistent with published findings from the Pediatric Heart Network Single Ventricle Reconstruction trial, in which there were a wide range of intervention rates as well as mean pressure gradients amongst the 14 different centres included in the trial.Reference Hill, Rhodes and Aiyagari 15
In all cases, the Doppler peak instantaneous pressure gradient only weakly correlated with the catheter peak-to-peak gradient. In patients with native or recurrent coarctation, this correlation was not improved by calculating the peak instantaneous pressure gradient using the expanded Bernoulli equation to account for proximal velocity, but it did improve when patients with evidence of collateral vessels or diastolic flow reversal were excluded. In patients with aortic reconstruction, correlation was not significantly improved by the use of the expanded Bernoulli equation, but was improved when only those patients with a normal cardiac index were considered.
In clinical practice, the presence of diastolic continuation of flow in the abdominal aorta as measured by pulsed-wave Doppler is often used to confirm proximal aortic obstruction; however, there was a surprising lack of association between diastolic continuation of flow in the abdominal aorta and significant coarctation measured at catheterisation, although there was a weak correlation with the Doppler-measured gradients. This was true when assessed qualitatively as a “yes” or “no” data point and when more objectively calculated using the pulsatility index and systolic/diastolic ratio. This held true when patients were considered together and within their separate sub-groups. It is possible that this measurement may be confounded by variations in exact placement of the Doppler pulsed-wave sample volume in the abdominal aorta, and variations in the angle of insonation, but these findings are similar to the limited literature reporting the use of this measurement.Reference Carvalho, Redington, Shinebourne, Rigby and Gibson 2 , Reference Tan, Babu-Narayan, Henein, Mullen and Li 3 , Reference Rao and Carey 7 , Reference DeGroff, Orlando and Shandas 19 – Reference Tang, Forbes, Du and Zilberman 21 In a reported variation on this technique, a longer peak diastolic velocity half-time improved the specificity of Doppler measurements in identifying obstruction.Reference Carvalho, Redington, Shinebourne, Rigby and Gibson 2 In that study, severe coarctation was defined as an angiographic ratio or the minimal diameter of the coarctation compared with the diameter of the descending aorta at the level of the diaphragm on angiography, of ⩽0.5.Reference Carvalho, Redington, Shinebourne, Rigby and Gibson 2
To gauge clinical utility, receiver operating characteristic curves were used to test the ability of Doppler measurements to predict the presence of aortic arch obstruction. In patients with native or recurrent coarctation, a Doppler peak instantaneous pressure gradient of 45 mmHg calculated using the simplified Bernoulli equation was the best predictor, correctly predicting obstruction in 78% of patients. There was no improvement when this group was stratified by cardiac index and only a small decrease was observed in the Doppler gradient predicting obstruction when the expanded Bernoulli equation was used, although inclusion of the proximal velocities resulted in a decreased area under the curve. Similarly, in patients with aortic arch reconstruction, a Doppler peak instantaneous pressure gradient of 23 mmHg calculated using the simplified Bernoulli equation correctly predicted arch obstruction in 69% of patients with a cardiac index ⩾3 L/min/m2, and with less accuracy when patients with lower cardiac indices were included.
The different impact of proximal velocities or cardiac index on the correlations between Doppler and catheter gradients is intriguing and may have a two-part explanation. First, patients with aortic arch reconstructions may have a dilated proximal segment due to the reconstruction technique, which results in a loss of pressure recovery from the ventricle to the ascending aorta, and therefore a proximal velocity closer to zero, which would then minimise any effect of proximal velocity on distal velocity. Second, patients with aortic reconstruction are at a higher risk of baseline decreased cardiac function when compared with patients with native/recurrent coarctation; therefore, analysing the group with a normal cardiac index separately from the group with a decreased cardiac index may improve the similarity between these two groups. In addition, previous studies have noted that Doppler-derived pressure gradients are directly affected by flow rate, which is a function of cardiac output, proximal velocity, worsening severity of obstruction, and/or presence of downstream collaterals.Reference Keshavarz-Motamed, Garcia, Maftoon, Bedard, Chetaille and Kadem 22 , Reference Steffens, Bourne, Sakuma, O’Sullivan and Higgins 23 This is especially important in patients with single ventricle physiology, as flow rate is directly related to cardiac output, which is frequently reduced in this patient population.
The direct impact of pressure recovery both proximal and distal to the obstruction on Doppler gradients was not assessed in this study, but could be an important area for further investigation. Pressure recovery represents the increase in pressure distal to an obstruction because of conversion of kinetic energy into potential energy after the vena contracta. Although Doppler measures the highest velocity flow in the centre of the vena contracta and calculates the resultant pressure gradient to produce that velocity, fluid-filled catheters measure the pressure distal to the vena contracta, in the region in which pressure has recovered, resulting in a lower measured gradient.Reference Barker, Ensing, Ludomirsky, Bradley, Lloyd and Rocchini 24 In in vitro and in vivo studies of aortic valve stenosis, pressure recovery may account for up to 50% of the peak instantaneous pressure gradient, with the largest effect seen in relatively small ascending aortas in which the stenotic valve area is only half of the ascending aorta vessel’s cross-sectional area.Reference Voelker, Reul, Stelzer, Schmidt and Karsch 25 In patients with dilated proximal segments, there may be a loss of pressure recovery in the dilated segment between the aortic valve and the coarctation, which would result in a lower proximal velocity and pressure, and would, therefore, negate any improvement gained by the use of the expanded Bernoulli equation. Viewing the system as different levels of pressure recovery – ventricle to proximal aorta and proximal aorta to distal aorta – may also explain why the greatest area under the curve was with aortic arch reconstructions, in which there would be less Doppler overestimation due to the lower proximal velocities and decreased proximal pressure recovery, and why there was greater overestimation with more simple forms of single-level coarctation.
Aortic arch obstruction, characterised by moderate narrowing with a descending aorta that is relatively limited in size, perhaps represents the ideal clinical setting for a maximal pressure recovery effect; however, inclusion of this measurement requires precise measurements of aortic diameters immediately proximal and distal to any narrowing coupled with pulsed-wave Doppler measurements in these same regions, which were not part of the echo protocol used during the time period of this study. Given the limitations of lateral resolution when the descending thoracic aorta diameter is imaged from the suprasternal notch window by echocardiography, cardiac MRI may be the best modality to analyse the pressure recovery effect.
Limitations
Limitations of this study include the small sample size, which is typical for single-centre studies examining even relatively common CHDs such as aortic arch obstruction, and the retrospective nature of the study. The overwhelming majority of patients who met catheterisation and echocardiographic parameters for inclusion in the study were male; however, this did not differ significantly between groups. Cardiac index was not measured in all patients, preventing inclusion of this in the analysis of all patients. Similarly, upper and lower extremity blood pressures were not measured in all patients, and none of these measurements were simultaneous with the catheterisation, limiting the interpretation of this clinical measurement in this analysis. Echocardiograms and catheterisation measurements also did not occur simultaneously, creating the potential for progression or recurrence of disease between measurements. The absence of correlation between qualitative indices suggests that any temporal effect change was minimal. A more likely confounder is the difference in the level of sedation between catheterisation and echocardiography. Agitation that can be found in non-sedated patients makes imaging more difficult, specifically with regard to measurement of Doppler indices. Sedation or lack of sedation can also affect cardiac output, which would directly impact pressure gradients. Although not ideal for research, this is almost always the situation in clinical practice and highlights the importance of the “real-world” comparison reported in this study.
Conclusions
The non-invasive evaluation of aortic arch obstruction in the clinical environment remains challenging. Doppler peak instantaneous pressure gradient correlated reasonably well with catheter peak-to-peak gradient in patients with native or recurrent coarctation and no collaterals or diastolic flow reversal, and was not improved when the expanded Bernoulli equation was used to account for proximal aortic valve velocity. From receiver operating characteristic curve analysis, a Doppler peak instantaneous pressure gradient cut-off point of 45 mmHg can correctly classify 78% of patients with native or recurrent coarctation. In patients with aortic arch reconstruction and a normal cardiac index, a Doppler peak instantaneous pressure gradient cut-off point of 23 mmHg can correctly classify 69% of patients with significant arch obstruction. Additional indices and models should be considered to improve correlation.
Acknowledgements
The authors thank the staff of the Duke Pediatric Echocardiographic and Cardiac Catheterization Laboratories for their assistance with this project.
Financial Support
Christoph Hornik received salary support for research from the National Center for Advancing Translational Sciences of the National Institutes of Health (grant number UL1TR001117).
Conflicts of Interest
None.
Ethical Standards
The authors assert that all procedures contributing to this work comply with the ethical standards of the relevant national guidelines on human experimentation (National Commission for protection of human subjects of Biomedical & Behavioral Research) and with the Helsinki Declaration of 1975, as revised in 2008, and has been approved by the Duke University Medical Center Institutional Review Board.