INTRODUCTION
Most clinicians are familiar with the concepts of diagnostic sensitivity (Se) and specificity (Sp: e.g., Baldessarini, Finkelstein, & Arana, Reference Baldessarini, Finkelstein and Arana1983; Woods, Weinborn, & Lovejoy, Reference Woods, Weinborn and Lovejoy2003). Sensitivity is the percentage of individuals with the condition of interest who are correctly classified by a test as having the condition of interest. Specificity refers to the percentage of cases without the condition who are correctly classified by the test as not having the condition. Se and Sp are then interpreted in terms of base rates or the prevalence of the target condition, principles of psychological assessment first illustrated by Meehl and Rosen (Reference Meehl and Rosen1955). Antecedent probability from Bayes theorem is fundamental to diagnostic interpretation of psychological test scores (e.g., Faust, Reference Faust2003; Frederick & Bowden, Reference Frederick and Bowden2008; Woods et al., Reference Woods, Weinborn and Lovejoy2003). However, typical interpretation of Se and Sp assumes that a test score provides only dichotomous information (i.e., test “positive” or test “negative”). Because psychological tests commonly involve an interval or ordered categorical scale, much information is sacrificed by reducing scores to a dichotomy.
Developments in evidence-based practice address this loss of information with a technique known as multiple-level likelihood ratios (LRs: e.g., Grimes & Schulz, Reference Grimes and Schulz2005; Straus, Richardson, Glasziou, & Haynes, Reference Straus, Richardson, Glasziou and Haynes2005). A likelihood ratio for any observed test score represents the likelihood that the score comes from a person with the diagnosis of interest, versus the likelihood that the score comes from an individual without the diagnosis (Straus et al., Reference Straus, Richardson, Glasziou and Haynes2005). An LR larger than one means it is more likely that the score comes from a person with the diagnosis, an LR smaller than one indicates that it is more likely that the score comes from a person without the diagnosis, and an LR not significantly different from one indicates an uninformative test score (Grimes & Schulz, Reference Grimes and Schulz2005; Straus et al., Reference Straus, Richardson, Glasziou and Haynes2005). LRs have received infrequent attention in psychology (e.g., Ivnik et al., Reference Ivnik, Smith, Cerhan, Boeve, Tangalos and Petersen2001). The simplest form of LRs, namely, dichotomous LRs (LR+ and LR−) represent all of the information in a typical 2 × 2 validity summary table (Grimes & Schulz, Reference Grimes and Schulz2005; Straus et al., Reference Straus, Richardson, Glasziou and Haynes2005). Multiple-level LRs convey more information by increasing the number of useful scores. The data required for calculation of multiple-level LRs are usually available whenever Se and Sp are calculated. However, effective application of LRs requires an understanding of pre- and posttest odds. Two examples follow.
A Hypothetical Example of Dementia Screening
Calculating Se and Sp
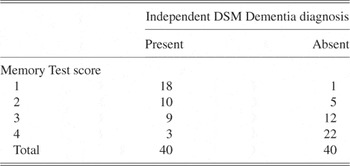
Table 1 describes hypothetical results from a long-term retrieval test for dementia screening. The memory test produces four scores, ranging from 1 (poorest memory) to 4 (best memory performance). Assuming that the scores in Table 1 are derived from a well-designed validity study with representative samples of older people drawn from a memory clinic population (n = 40) and from the general community (n = 40), patients with dementia mostly score 1 or 2 on the test, and those without dementia typically score 3 or 4.
Hypothetical results for a memory test used to screen for dementia in representative samples of memory clinic (n = 40) and community (n = 40) participants

Note
The validity of the memory test is evaluated against the independent criterion of a DSM dementia diagnosis.
The usual approach for diagnostic classification or screening is to establish an optimal cut-point in the score range and label scores on the target side of that cut as “positive” and scores on the other side as “negative.” No test should be applied and interpreted unless there is a real (statistically significant) relationship between the test scores and the clinical criterion (Meehl & Rosen, Reference Meehl and Rosen1955; Straus et al., Reference Straus, Richardson, Glasziou and Haynes2005). Logistic regression, available in most statistical packages (e.g., SPSS, 2009), is a good way to determine the optimal cut-point for overall correct classification (e.g., Hosmer & Lemeshow, Reference Hosmer and Lemeshow2000; Loring, Bowden, Lee, & Meador, in press). For the data in Table 1, dementia diagnosis (present/absent) is the dichotomous dependent variable for the logistic regression, and memory test score is the predictor variable.
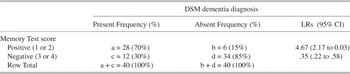
The resulting diagnostic model was significant ( p < .001) and indicated that the optimal cut-point for correct classification was between a memory score of 2 and 3. In logistic regression, predicted group membership is derived from the value of 1/(1 + e−z). In this analysis, z = −3.98 + 1.48* (memory test score). Standard errors for the intercept and regression coefficients were .91 and .31, respectively. The regression model produced a nonsignificant Hosmer and Lemeshow statistic [Hosmer & Lemeshow χ2 (N = 80; df = 2) = .67; p = .72]. The Hosmer and Lemeshow statistic is a test of model fit, with significant values indicating lack of fit (Hosmer & Lemeshow, Reference Hosmer and Lemeshow2000). A typical Se and Sp analysis appears in Table 2. Following conventional practice, Se = a/(a + c) = (28/40) = .70 or 70% and Sp = d/(b + d) = (34/40) = .85 or 85% (for further examples, see Baldessarini et al., Reference Baldessarini, Finkelstein and Arana1983; Straus et al., Reference Straus, Richardson, Glasziou and Haynes2005; Woods et al., Reference Woods, Weinborn and Lovejoy2003).
Sensitivity and Specificity analysis for the hypothetical data in Table 1 interpreted as either “positive” or “negative” for dementia

Note
a = true positive; b = false positive; c = false negative; d = true negative; LR = likelihood ratio; CI = confidence interval.
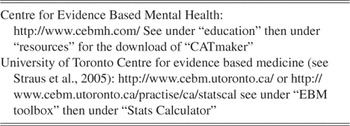
Positive predictive power (PPP) and negative predictive power (NPP) are typically calculated next (Woods et al., Reference Woods, Weinborn and Lovejoy2003). PPP and NPP are both posttest probabilities. Thus, PPP is the probability that a positive test result comes from a person with the target diagnosis, and NPP is the probability that a negative test result comes from a person without the diagnosis (Baldessarini et al., Reference Baldessarini, Finkelstein and Arana1983; Frederick & Bowden, Reference Frederick and Bowden2008; Straus et al., Reference Straus, Richardson, Glasziou and Haynes2005). For the data in Table 2, PPP = a/(a + b) = .82 and NPP = d/(c + d) = .74. Importantly, however, the reported PPP and NPP values apply only to situations where the prevalence of the target diagnosis is the same as in the study sample, in this case .50 (Baldessarini et al., Reference Baldessarini, Finkelstein and Arana1983; Frederick & Bowden, Reference Frederick and Bowden2008). Fixed PPP and NPP values are simply not valid for settings in which the pretest probability deviates from the prevalence in the study from which the fixed PPP and NPP values are reported. Although PPP and NPP for alternative base rates can be calculated from the information in Table 1, the formula are not often used (Baldessarini et al., Reference Baldessarini, Finkelstein and Arana1983; Frederick & Bowden, Reference Frederick and Bowden2008). The best way to avoid the misapplication of PPP and NPP values involves routinely plotting PPP and NPP curves, for which free software is readily available (Frederick & Bowden, Reference Frederick and Bowden2008; Straus et al., Reference Straus, Richardson, Glasziou and Haynes2005: see also links in Table 4).
Likelihood ratios
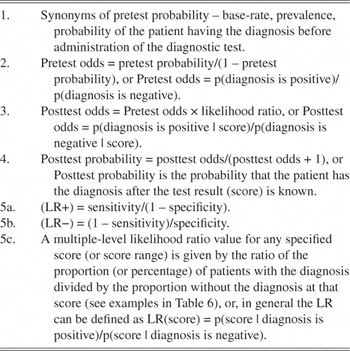
An alternative method to address differences in pretest probability across different clinical settings involves LRs. With LRs, posttest probability for any patient’s score can be readily estimated for any pretest probability. As noted, the LR is the ratio of the likelihood that a test score is derived from the target or diagnostic group divided by the likelihood that the test score is derived from the control group (for additional descriptions of LRs, see http://www.cebm.utoronto.ca/glossary/lrs.htm#top or alternatively http://www.cebm.net/index.aspx?o=1043). The algebra required for application of LRs is slightly complicated, but there are excellent graphical and spreadsheet aids for the quick application and interpretation of LRs (Grimes & Schulz, Reference Grimes and Schulz2005; Straus et al., Reference Straus, Richardson, Glasziou and Haynes2005). From our dementia example, a positive test score was defined as a score of 1 or 2. As can be seen in Table 2, if a person obtains a positive score (1 or 2), the likelihood that the score is obtained from a patient with dementia is equal to the positive likelihood ratio (LR+) = 70%/15%. Similarly, if a person obtains a negative score (3 or 4), the likelihood that the score is obtained from a patient in the dementia group is the negative likelihood ratio (LR−) = 30%/85%. That is, for the data in Table 2, (LR+) = Se/(1 − Sp) = .70/(1 − .85) = 4.67, and (LR−) = (1 − Se)/Sp = (1 − .7)/.85 = .35 (Grimes & Schulz, Reference Grimes and Schulz2005; Straus et al., Reference Straus, Richardson, Glasziou and Haynes2005; for definitions and formula, see Table 3A). Definitions and formula for pre- and posttest probability, pre- and posttest odds and likelihood ratios Note LR = likelihood ratio.

To understand the interpretation of LRs, it is necessary to become familiar with two additional quantities, pretest odds and posttest odds. Pre- and posttest odds simply re-express pre- and posttest probabilities and are necessary because, in terms of the algebra, LRs apply directly to odds, not probabilities. Specifically, the pretest odds = pretest probability/(1 – pretest probability). The posttest odds is the product of the LR and the pretest odds. For didactic purposes, these quantities will be explained but again it will be shown that graphical aids and spreadsheets can circumvent most manual calculations. Definitions and formula for calculation of pre- and posttest odds are shown in Table 3A. The logic is as follows (Straus et al., Reference Straus, Richardson, Glasziou and Haynes2005). Step 1: The pretest probability for the diagnosis of interest is estimated for the clinical population in which the test will be applied; Step 2: The test, with known Se and Sp (and, therefore, known LRs) is administered to a patient and either a positive or negative test result is observed; Step 3: Pretest probability is converted to pretest odds; Step 4: The pretest odds are multiplied by the LR for the test to obtain posttest odds; Step 5: Posttest odds are converted to posttest probability; and Step 6: The posttest probability is interpreted as the probability that the patient has the diagnosis. Like PPP, if the posttest probability is greater than .50, then it is more likely that the patient has the condition. If the posttest probability is less than .50, then it is less likely that the patient has the condition.
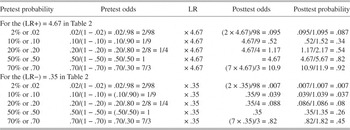
Table 3B contains examples derived from the data in Table 2. A variety of free software will perform these calculations (see Table 4). Posttest probability can also be estimated from pretest probability and the LR for any test using a LR nomogram shown in Figure 1 (an interactive LR nomogram is available from the Center for Evidence Based Mental Health as part of the CATmaker at www.cebmh.com/—for details, see Table 4). Using the nomogram, a straight line can be drawn through the study pretest probability of 0.50 (or 50%), connecting the LR value of 4.67 and continued through to the posttest probability axis on the right at an approximate value of .80. Thus, in a clinical setting with a pretest probability of .50, when a positive test result is obtained from a test with a LR+ of 4.67, then the posttest probability of the patient having the condition is approximately .80. In other words, obtaining a positive test result from a test with a LR+ of 4.67 increases the probability of the patient having the condition from .50 to approximately .80. Note that the approximate value of posttest probability read from the LR nomogram is close to the PPP value calculated above of .82 because, in this example, the pretest probability is the same as in Table 2.
Likelihood ratio nomogram (Figure used with permission of the Oxford Centre for Evidence Based Medicine http://www.cebm.net/index.aspx?o=1043).

Web sites providing downloadable calculators for likelihood ratios and other evidence-based practice resources

If instead we had observed a negative test result, we could read posttest probability from the nomogram, also. Connecting the pretest probability value of 0.50 with the LR− value of .35, an approximate posttest probability of .25 is indicated. Thus, obtaining a negative test result from a test with a LR− of .35 reduces the probability of diagnosis from .50 to .25, approximately. Again, the posttest probability of the patient having the diagnosis estimated from the LR− should be equivalent to the value of 1 – NPP. From the data in Table 2, NPP = .74. Remember that, for any observed test score, NPP is the probability of the person not having the diagnosis, whereas posttest probability calculated from the LR is the probability of the person having the diagnosis (i.e., 1 – NPP). Obviously, estimating posttest probability using the LR nomogram is less precise than explicit calculations. Unless the posttest probability value is close to .50, however, the approximations obtained via the nomogram should suffice in most circumstances. Another caveat on use of the LR nomogram is that estimation of confidence intervals for LRs requires explicit calculations. The confidence intervals for the LRs shown in Table 2 and elsewhere in this report were calculated using the Center for Evidence Based Mental Health CATmaker (www.cebmh.com/—for details, see Table 4). Confidence intervals are useful for evaluating the significance of LRs and also the significance of differences between LRs.
Unlike reported values of PPP and NPP, LRs force explicit reliance on pretest probability, and when used in conjunction with an LR nomogram, permit quick estimation of posttest probability from any pretest probability value. Further advantages of LRs will become apparent in the next section when multiple-level test scores are considered. In addition, the nomenclature of “positive” and “negative” LRs is only useful when dealing with dichotomous information in conventional Se and Sp analysis. When calculating multiple-level LRs, the positive and negative labels will be dropped because each one of the multiple-level LRs corresponds to a specific score or score range, rather than to the simple dichotomy of positive or negative test results.
Multiple-level likelihood ratios
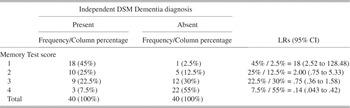
In our hypothetical dementia example, the test with four discrete memory scores was reduced to two categories of response for the purpose of Se, Sp, and dichotomous LR calculations. An alternative method for examining the diagnostic utility of these scores is to calculate multiple-level LRs. LRs indicate the change in the likelihood of dementia diagnosis (from pretest odds to posttest odds) consequent upon a patient obtaining any one of the four discrete scores shown in Table 1. In contrast to the calculation of dichotomous LR+ and LR−, multiple-level LRs can be thought of as an ordered sequence of (unsigned) LRs reflecting the likelihood of any score being observed in a person with the target condition (dementia). Thus, having adopted the multiple-level LR approach, whether a test score is “positive” or “negative” is less important. Instead the focus is on diagnostic impact of a specific score (or score range). If column percentages are calculated corresponding to the observed frequencies as shown in Table 1, then the calculation of multiple-level LRs is simply the ratio of cell percentages within rows (Grimes & Schulz, Reference Grimes and Schulz2005; Straus et al., Reference Straus, Richardson, Glasziou and Haynes2005).
Because Se was defined above as the correct diagnosis of dementia, multiple-level LRs for Table 5 are calculated by dividing the cell percentage in the left (patients with dementia) column, by the cell percentage in the right (patients without dementia) column, for each separate score. This algebraic strategy will produce multiple-level LRs that indicate likelihood of dementia diagnosis for any observed score. Confidence intervals were calculated by entering frequency data into the CATmaker spreadsheet (from http://www.cebmh.com/—for details see Table 4).
Data from Table 1 also showing column percentages and calculation of multiple-level LRs

Note
LR = likelihood ratio; CI = confidence interval.
To examine specific results from Table 5, a memory test score of 1 corresponds to a multiple-level LR of 18 (45%/2.5%). LRs larger than 10 are described as very useful for diagnostic purposes (Straus et al., Reference Straus, Richardson, Glasziou and Haynes2005). By consulting the LR nomogram, it can be seen that an LR of 18 has a large impact on pretest probability. Suppose that a patient drawn from a memory clinic population in which the pretest probability of dementia was 10%, and the patient obtained a memory score of 1, then connecting a straight line through the 10% pretest probability on the left axis and 18 on the central LR axis of the nomogram, the posttest probability of dementia would be estimated at 65%, approximately. As another example, the multiple-level LR associated with a score of 4 is .14, and if applied to a patient drawn from a population with pretest probability of 50%, leads to an estimated posttest probability of 10%, approximately. Examination of the LRs in Table 5 shows that the LRs for scores of 2 or 3 both include unity in the respective 95% confidence intervals, suggesting that we cannot reject the null hypothesis that the LRs associated with scores of 2 or 3 are unhelpful for distinguishing between the two groups.
Multiple-Level Likelihood Ratios Illustrated With Wada Memory Asymmetry Data
Wada memory testing is commonly used in the preoperative evaluation of candidates for anterior temporal lobectomy at many epilepsy surgery programs, with score asymmetries between the two hemispheres interpreted as reflecting functional impairment associated with a unilateral seizure focus. For recent discussions of the clinical utility of the Wada procedure see Baxendale and colleagues (Baxendale, Thompson, & Duncan, Reference Baxendale, Thompson and Duncan2008) and Paolicchi (Reference Paolicchi2008). In a separate report using the MCG Wada protocol (Loring, Meador, Lee, & King, Reference Loring, Meador, Lee and King1992), and using logistic regression analysis, we identified an optimal cut-point for Se and Sp for Wada Memory Asymmetries using logistic regression (WMA, the difference between left injection and right injection memory scores; Loring et al., in press). The data are reported here to provide an illustration of the application of LRs in a context that will be familiar to many neuropsychologists. The sample comprised 324 patients with temporal lobe epilepsy (TLE) who were being evaluated for anterior temporal lobectomy, all of whom subsequently underwent surgery. One hundred and seventy-two patients had left temporal seizure focus on full clinical evaluation, and 152 patients had right onset.
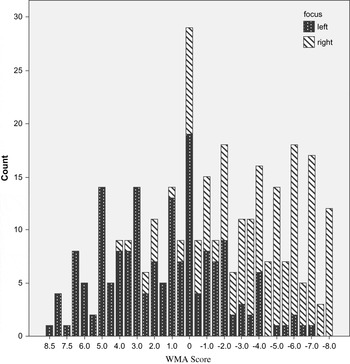
Although the logistic regression analysis indicated a statistically significant relationship between the WMA scores and seizure focus (logistic regression coefficient = −.511, standard error = .055; p < .001), the Se, Sp, and dichotomous LRs based on an optimal cut-point of greater than −2, versus equal to or less than −2 indicated only moderate clinical utility (Se = 84%, Sp = 77%, (LR+) = 3.64, and (LR−) = .21). A frequency histogram for the WMA scores as a function of seizure onset laterality is shown in Figure 2. Examination of this histogram shows that in the respective samples of left and right TLE patients, there is considerable overlap in the WMA distribution except at more extreme positive or negative difference scores.
Frequency histogram for the Wada Memory Asymmetries (WMA) difference score on the Wada test in patients with left (n = 172) or right (n = 152) seizure focus.

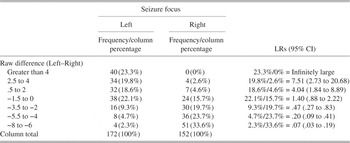
An alternative method for examining the diagnostic efficiency of WMA scores is obtained by simple cross-classification with seizure focus (Table 6). The cross-tabulation collapses difference scores into a smaller number of categories than is available in the raw scores (Figure 2) but retains more information than is available from the dichotomous sensitivity analysis (see Table 2; Loring et al., in press). Cell size was set at arbitrary uniform intervals expanding from the central cut-score (greater than −2, vs. equal to or less than −2), except at extremes where cells were collapsed across additional values. As can be seen in Table 6, 40 patients (23.3%) with left seizure focus obtained a WMA score greater than +4. In contrast, none of the right focus patients obtained a difference score greater than +4. Less extreme difference scores included more even proportions of patients from both seizure groups. At the other extreme, 4 patients (2.3%) with left seizure focus obtained a WMA score in the range −8 to −6. In contrast, 51 patients (33.6%) with right seizure focus obtained a difference score in this range.
Multiple-level likelihood ratios (LRs) for the Wada Memory Asymmetry scores

Note
Left, n = 172; right, n = 152. Adapted from Table 3 in Loring et al. (in press).
As noted above, if column percentages corresponding to the observed frequencies are calculated, then the multiple-level LRs are simply the ratio of cell percentages within rows (Grimes & Schulz, Reference Grimes and Schulz2005; Straus et al., Reference Straus, Richardson, Glasziou and Haynes2005). Because Se was defined as the correct diagnosis of left seizure focus, LRs are calculated by dividing the cell percentage in the left seizure focus column, by the cell percentage in the right column, for each row. This algebraic strategy produces multiple-level LRs that indicate change in likelihood of left seizure focus after a patient’s score is known.
As can be seen in Table 6, a difference score of +4 or greater corresponds to a multiple-level LR of positive infinity (42%/0%). This is because many left focus patients scored in this range, but none of the right focus patients scored in this range. In other words, a WMA of at least +4 increases the pretest probability of left seizure focus by an infinitely large factor. Placing a straight line through the highest available value on the LR scale in the centre of the LR nomogram (LR = 1000 in Figure 1) immediately illustrates that a score in the range +4 or greater, and associated with an infinitely large LR, will produce a high posttest probability (much greater than 50%) even when the pretest probability is very small. Remember, to rule in (or rule out) a condition, only a posttest probability above (or below) 50% is needed. A difference score in the range +2.5 to 4 changes the likelihood of left focus by a factor of 7.62 (19.8%/2.6%). In contrast, a difference score in the range −8 to −6 changes the likelihood of left focus by a factor of .07 (2.3%/33.6%).
The impact of a small LR is illustrated by the LR nomogram. Pivoting a straight line through the LR value of .07, a pretest probability as high as 90% is associated with posttest probabilities less than 50% indicating right seizure focus is more likely. That is, a small LR dramatically reduces the posttest probability of the target diagnosis (left focus).
DISCUSSION
In this study, the application of multiple level LRs was demonstrated. In an initial example using hypothetical memory results to identify dementia, the algebraic basis of LRs was explained and an interpretive aid, the LR nomogram, was highlighted. In our second example, we illustrate the clinical utility of multiple-level LRs using WMA data from Loring et al. (in press). It should be noted that the Wada data are unusual in that the prevalence of the two diagnostic categories of interest (left and right TLE) is approximately 50% and is higher than those observed for most other clinical conditions (e.g., Frederick & Bowden, Reference Frederick and Bowden2008; Meehl & Rosen, Reference Meehl and Rosen1955; Woods et al., Reference Woods, Weinborn and Lovejoy2003). However, the Wada data illustrates how multiple-level LRs provides a valuable clinical technique to estimate posttest probability after obtaining any observed score.
The optimal WMA dichotomization cut-point derived from logistic regression yielded a Se = 83.7% and Sp = 77.0% (Loring et al., in press). When multiple-level LRs were calculated from the full range of WMA scores, more clinically useful information was obtained. In principle, a set of multiple-level LRs could be based on row ratios for every possible score on a test. In practice, however, collapsing across score ranges will often be necessary to increase cell frequencies. When score ranges are used, they should be chosen to incorporate the optimal cut-point derived from logistic regression, because this strategy should optimize utility of the range of LRs. In addition, clinical interpretation, including LR analysis, should never be conducted unless there is a statistically significant relationship between test scores and group membership derived from an explicit diagnostic modeling procedure such as logistic regression (Hosmer & Lemeshow, Reference Hosmer and Lemeshow2000; Straus et al., Reference Straus, Richardson, Glasziou and Haynes2005). Logistic regression provides a variety of useful information in addition to conventional dichotomous Se and Sp calculations. For example, correct classification plots can be used to examine alternative classification cut-points and se and Sp can be recalculated for alternative cut-points (Hosmer & Lemeshow, Reference Hosmer and Lemeshow2000).
As illustrated in Table 6, a WMA of +4 or greater was associated with an infinitely large LR. Very large LRs increases the posttest probability of the target condition to a number close to 1 (or 100%), irrespective of pretest probability. Of course, an infinitely large (or small) LR will only be observed when there are no patients in a cell, and might be regarded as an overestimate of diagnostic validity. If the distribution of left–right difference scores had been subject to a dichotomous classification cut at greater then +4, then Sp = 100% (Table 6). The accuracy of multiple-level LRs will be influenced by incomplete sampling. This is most likely to be a problem in small studies, where further sampling may place some patients into previously empty cells and underscores the importance of test developers deriving representative samples of adequate size, to make the most of the information available in a well-developed scale. This situation can be handled by further sampling to increase cell counts or by collapsing cells to aggregate over a wider range of scores. Of note, the spreadsheets identified in Table 4 will not calculate LRs in the presence of empty cells, so a dummy nonzero number will need to be entered (e.g., a cell frequency of n = 1) to perform calculations. LRs calculated in this way should always be accompanied by appropriate explanation.
The important clinical implication of the multiple-level LR analysis is that when a patient obtains a score associated with a very large LR, then there is a substantial increase in the posttest probability of the diagnosis relative to pretest probability. Conversely, when a patient obtains a score associated with a very small LR, then there is a substantial decrease in the posttest probability of the diagnosis. As with other forms of hypothesis testing, and in line with current practice (Wilkinson et al., Reference Wilkinson1999), confidence intervals around LRs can be used to evaluate the hypothesis that two LRs are the same, or that any single LR is not different from 1. Details regarding the hand calculation of confidence intervals for LRs is more complicated (Agresti, Reference Agresti2002), but as noted above is provided by various free spreadsheets (Table 4).
Another advantage of multiple LRs is the demonstration that scores close to the conventional dichotomous cut-point may be diagnostically uninformative. For example, the Se and Sp and dichotomous LR interpretation of Table 2 suggests that a score of 1 or 2 (or conversely a score of 3 or 4) are useful. In contrast, the multiple LR analysis in Table 5 shows that scores of 2 or 3, respectively, are not significantly useful. The same interpretation applies to WMA scores in the range −3.5 to 0 in Table 6. In other words, relying on conventional Se and Sp or dichotomous LR interpretation may give rise to the erroneous impression that any score above or below the dichotomous cut-point is useful. In reality, scores close to the cut-point may be unhelpful and only a more detailed analysis of multiple level LRs may reveal which discrete scores or score ranges are useful. As with effective interpretations of Se and Sp, LRs need to be interpreted in terms of the local base-rate or pretest probability in the clinical population in which the test is applied but, as noted, use of LRs encourages an explicit reliance on base rate information (Frederick & Bowden, Reference Frederick and Bowden2008; Grimes & Schulz, Reference Grimes and Schulz2005; Straus et al., Reference Straus, Richardson, Glasziou and Haynes2005).
Some discussions of diagnostic validity have created the impression that high test validity in terms of both high Se and high Sp can only be obtained from tests that produce large effects equivalent to Cohen’s d of 3 or greater (e.g., Zakzanis, Reference Zakzanis2001). However, such effects are rare (Cohen, Reference Cohen1988). Instead, the multiple-level LR approach illustrates that it may be possible to derive useful information from effects that appear modest by conventional Se and Sp analysis.
An important question concerns how we obtain good estimates of LRs. In fact, the issue is identical to the problem of obtaining good estimates of Se and Sp. Fundamentally, representative samples of the relevant populations are required. In the case of multiple-level LRs, more extreme LR values derived from scores at either end of the respective population distributions, undersampling will have an impact on the accuracy of estimates. As a consequence, it may be useful to pool data from different clinical samples (e.g., Loring et al., Reference Loring, Straus, Hermann, Barr, Perrinne and Trenerry2008). In addition, we would recommend that clinicians always use a double-check mechanism, such as calculating posttest probabilities using a spreadsheet or one of the downloadable calculators (Table 4), particularly when posttest probability falls close to .50, and the inherent inaccuracy of a graph becomes obvious.
Although receiver-operating characteristic (ROC) analysis provides some of the same information for evaluation of test validity, identification of optimal decision rules often is not obvious from ROC curves, again requiring logistic regression to provide precise information (e.g., MedCalc for Windows, version 10.0.2, 2009). In the examples discussed above, it was assumed that the costs and benefits of false-positive and false-negative diagnostic errors are equal. ROC analysis can provide additional information, about optimal decision rules when this assumption does not apply (Swets, Reference Swets1992; Zweig & Campbell, Reference Zweig and Campbell1993).
In summary, calculation of a set of multiple-level LRs provides a more powerful approach to evaluating test validity compared with Se and Sp analysis. Provision of LRs across a representative range of scores provides interpretive guidance for any score obtained by any patient. Discrete test scores from many different psychological tests might be expected to yield useful LRs. By limiting ourselves to Se and Sp analysis, we may be underestimating the diagnostic validity of many of our test scores.
ACKNOWLEDGMENTS
The information in the manuscript or the manuscript has never been published electronically or in print. The authors thank Sara Fratti, Dr.ssa for assistance with manuscript preparation. The authors have no conflicts of interest to declare.