1. Introduction
Air traffic control (ATC) is a complex process of organising aircraft within a controlled sector. It consists of three main processes: task, control and sub-processes (Kallus et al., Reference Kallus, Van Damme and Dittman1999). The task process reflects the basic processes of the cognitive model of air traffic controllers (ATCOs), while the control process and sub-processes are concerned with attention-switching and the elements of the task process, respectively. The task processes that are performed by ATCOs comprise taking over position during the first hand-off and building up a mental picture of the situation accordingly, monitoring and handling routine traffic, and managing requests from pilots and assisting them, along with detecting and resolving air traffic conflicts.
Given these complex tasks of ATC operations, ergonomics issues, particularly cognitive ergonomics, have emerged as the most important aspects in this safety-strict domain. Different ergonomics issues occur in both high and low air traffic conditions. In high-traffic conditions, the issues are high workload in terms of cognitive loads on ATCOs during control tasks (Trapsilawati et al., Reference Trapsilawati, Wickens, Qu and Chen2016) which also demand high situation awareness (Endsley, Reference Endsley2020). Nevertheless, safety concerns also appear in low-traffic situations where ATCOs become more vulnerable for air traffic conflict due to low vigilance level as occurred in the 1 July 2002 Uberlingen accident (Nunes and Laursen, Reference Nunes and Laursen2004). In the accident, the ATCO was out-of-the-loop due to his low vigilance level and was late in giving the resolution instruction, and he could not confirm the aircraft position after the traffic alert and collision avoidance system (TCAS) activation, resulting in a mid-air collision with total fatality of both aircrafts' passengers (Nunes and Laursen, Reference Nunes and Laursen2004).
To prevent this kind of accident from happening again in the future and to ultimately maintain safety in the airspace, ATCOs are obliged to perform conflict detection and resolution (CDR) processes. ATCOs are required to confirm and update their mental picture and maintain their situational awareness and check the routine traffic. Furthermore, they also search for air traffic conflicts and issue instruction to maintain separation between aircraft in the sub-processes.
A growing body of literature in ATC has suggested many topics influencing CDR performance. In addition to traffic density, several other individual factors have also been widely examined in prior studies, such as ATCOs, environmental, technology and organisational factors. ATCO factors comprise the parameters of, for instance, workload (Loft et al., Reference Loft, Sanderson, Neal and Mooij2007; Fothergill and Neal, Reference Fothergill and Neal2008) and experience (Bernhardt et al., Reference Bernhardt, Poltavski, Petros, Ferraro, Jorgenson, Carlson, Drechsel and Iseminger2019). Environmental factors deal with, but are not limited to, traffic density (Trapsilawati et al., Reference Trapsilawati, Wickens, Qu and Chen2016) and conflict geometry (Trapsilawati et al., Reference Trapsilawati, Herliansyah, Nugraheni, Fatikasari and Tissamodie2020, Reference Trapsilawati, Wickens, Herliansyah, Sari and Tissamodie2022). Technological aspects take into account the software, such as medium-term conflict detection (MTCD) (Ruiz et al., Reference Ruiz, Piera and Del Pozo2013), short-term conflict alert (STCA) (Kearney et al., Reference Kearney, Li and Lin2016, Reference Kearney, Li, Yu and Braithwaite2019) and the user-request evaluation tool (URET) (Brudnicki et al., Reference Brudnicki, Lindsay and McFarland1997), as well as hardware parts, such as vertical situation display (VSD) (Trapsilawati et al., Reference Trapsilawati, Chen, Qu and Wickens2021) and airspace dependent surveillance broadcast (ADS-B) (Fedorov et al., Reference Fedorov, Holovniak, Khudov and Misiyuk2019). Organisation factors, including ATC work system and supervision processes, are also vital to consider.
The complex tasks of ATC and the various factors affecting its operation have shed light on the need to build a model to predict CDR performance given a traffic situation. This model should consider the various aspects in ATC consisting of the software, hardware, environment, liveware and organisation, namely the SHELL model that provides a conceptual framework to analyse the interaction among multiple components of a system. The International Civil Aviation Organisation (ICAO) has proposed a SHELL model in aviation system, but the model is solely introduced to elucidate in a safety management manual the constructs in an ATC context and its possible contribution to human errors (ICAO, 2012).
The SHELL model may be further analysed in a more objective manner through employing a soft-computing method that resembles human reasoning by means of a fuzzy inference system (FIS). The FIS is perceived as the most suitable method to be used for the initial attempt to quantify the SHELL model in an ATC context in this study due to the instinctive facility of the system and its ability to analyse human judgements (Son, Reference Son2017). However, considering all SHELL factors may not be always feasible in natural ATC settings. To some extent, there may be some readily available data in certain ATC centres available as the input of the FIS.
To allow for a higher degree of flexibility in implementing this FIS tool for the SHELL model, this study presents a hybrid framework to accommodate different factors. This study aimed at developing a fuzzy-hybrid framework for quantifying the SHELL model in the ATC to predict CDR performance. The framework is developed and tested as an objective assessment tool of ATC safety and its interrelated components. This framework can offer a quick and more accurate picture of the components that may contribute to early prevention and error and safety intervention for poor CDR performance in all sectors of the ATC system.
2. Background review
2.1 Air traffic control and air traffic conflict
In general, ATC is divided into three areas of responsibility, including tower control, terminal radar control (TRACON) and enroute control. Tower control deals with runway clearance during take-off and landing. Afterwards, TRACON is responsible for merging and sequencing aircraft about 40 nautical miles (NM) from the airport after being handed-off by tower or enroute controllers. In addition, enroute control manages high-speed and high-altitude aircraft with the air route traffic control centre. Both TRACON and enroute controllers are equipped with situational displays to manage air traffic and prevent any mid-air collisions.
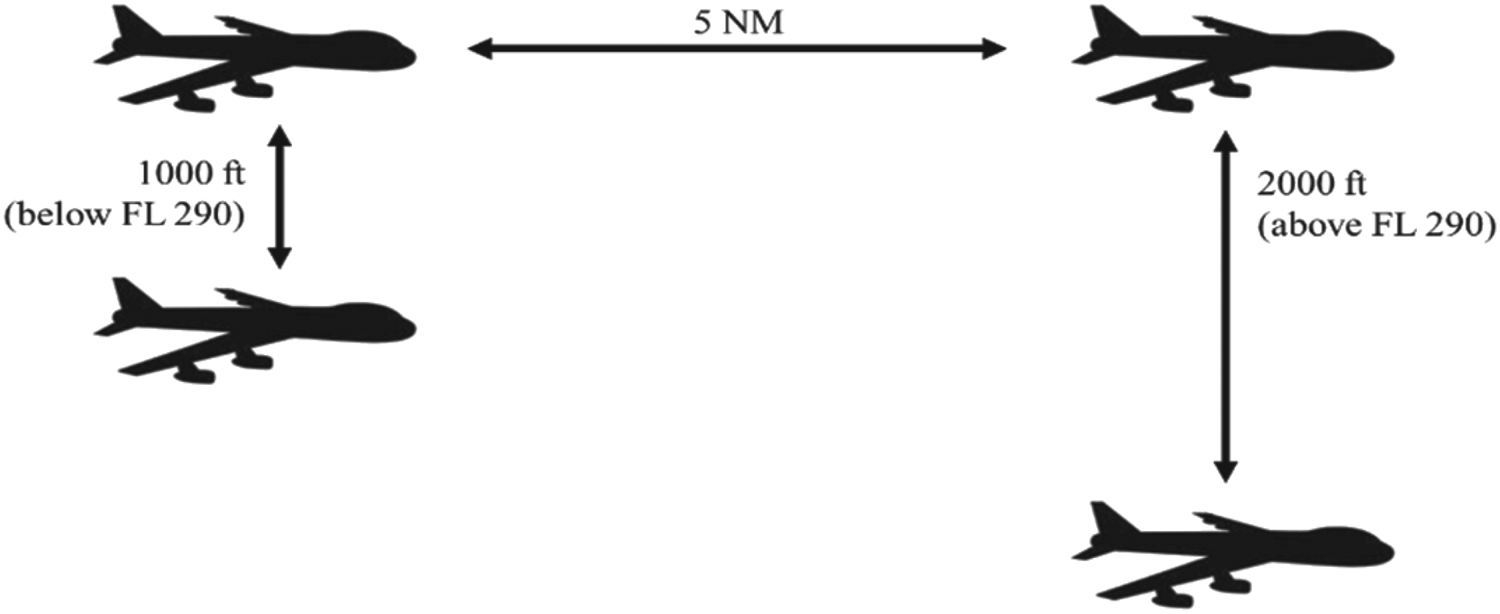
The ICAO sets and applies mid-air collision minimum separation standards. The usual separation in surveillance airspace in the enroute area is 5 NM horizontally and 1,000 ft vertically, with 2,000 ft vertical separation for some aircraft above flight level (FL) 290 (29,000 ft) beside many operating with a 1,000 ft separation (ICAO, 2019), as depicted in Figure 1. Other separation minima apply in certain circumstances. For instance, in the TRACON area, the usual lateral separation is 3 NM. If it is anticipated that two aircraft will violate a separation minimum, they are in conflict, and the controller and pilots will work to resolve the conflict before the aircraft breach the standard – called a Loss of Separation (LOS). Some prior studies were conducted to support conflict detection and resolution through a trajectory prediction method (Liu and Hwang, Reference Liu and Hwang2011), validation (Paglione and Oaks, Reference Paglione and Oaks2007) and data-driven framework (Ayhan et al., Reference Ayhan, Costas and Samet2019).
ATC separation Minima (ICAO, 2019)

2.2 SHELL model
The SHELL model is a theoretical means to analyse the interaction among system components. This model can be adopted in a complex system to assess the contribution of each component to the safety aspect of the system. The model consists of four main components, including liveware, hardware, software and environment. In addition, more recent literature suggested that organisation is an inseparable aspect for enhancing systems’ safety. Thus, Chang and Yeh (Reference Chang and Yeh2010) proposed an extended SHELL model by adding an organisational construct into the model in the ATC context. The extended SHELL model subsequently comprises the five factors, including software (i.e. non-physical resources), hardware (i.e. physical resources), environment (i.e. physical settings), liveware (i.e. ATCOs) and organisation (i.e. non-physical settings) (Pandey and Shukla, Reference Pandey and Shukla2019).
The human factor lies in the centre of the model reflecting personal attributes of an individual in a system termed liveware and interacting with other elements in the model. The other elements in the system must suit the human to ensure good system performance.
The next interface is the liveware-liveware (L-L) interface which represents the relationship among individuals in the system. In the ATC context, ATCOs communicate with pilots, supervisors and other ATCOs. Given this interaction, it is necessary to understand that communication, inter-personal factors and dynamics become essential in influencing human performance (ICAO, 2012).
The subsequent interface dealing with the hardware is the liveware-hardware (L-H) interface, referring to the association between humans and physical resources, for instance, equipment, technology, facilities and machines. A mismatch in the L-H interface could lead to serious problem in ATC operations which may endanger safety.
Next, the liveware-software (L-S) interface reflects the connection between humans and supporting systems in the workstation including computer software, procedures, clarity, symbology and vocabulary (ICAO, 2012) which are critical in ATC operations. The interface between liveware and the environment (L-E) covers the linkage between humans and the physical surroundings, such as traffic factors, aviation sectors and infrastructure. Lastly, the relationships between liveware and its organisation (L-O) signify the overall aspects in the workplace, including but not limited to policy, task and work system.
2.3 Fuzzy inference system
A fuzzy inference system (FIS) is a system covering the reasoning process based on fuzzy logic to map outputs which associate with fuzzified inputs (Jouffe, Reference Jouffe1998). There are three main stages in FIS: fuzzification, rule evaluation and defuzzification. The fuzzification is the converting process of a numerical variable into a linguistic variable according to a specified membership function. For instance, fuzzy logic was implemented for a UAV flight safety system where the input variables of the battery voltage, temperature and wind were used to determine the remaining battery capacity and automatically adjust the flight plan (Shcherban and Ieremenko, Reference Shcherban and Ieremenko2020).
2.3.1 Fuzzy set of membership function
This section explains the class of objects where elements have certain degrees of membership. The extension of a classical or numerical set is termed a ‘fuzzy set’. The universe of real numbers discourse is the most common basis for the membership functions used for fuzzy sets, as shown in Equation (1):

where A is a fuzzy set in the X universe of discourse, x is the fuzzy element and ${\mu _A}(x )$ is the membership function (MF) of x in A. The university of discourse is defined as the complete range of objects, the so-called domain. In fuzzy logic, a fuzzy set consists of a university of discourse (domain) and a membership function which identifies the degree to which a particular element of the domain belongs to the set or not. The fuzzy set is a pair (A, ${\mu _A}$
 ), where A is a set and ${\mu _A}\textrm{:}A \to [{0,1} ]$
 is a membership function. For each $x \in A$
 , the value ${\mu _A}(x )$
 is called the ‘degree of membership’ of x in (A, ${\mu _A}$
 ). For example, let (A, ${\mu _A}$
 ) be the fuzzy set of the close objects, and then an object x with ${\mu _A}(x )$
 = 1 is in (A, ${\mu _A}$
 ) (absolutely close); x with ${\mu _A}(x )$
 = 0 is not in (A, ${\mu _A}$
 ) (absolutely not close), x with 0 < ${\mu _A}(x )$
 < 1 is partially in (A, ${\mu _A}$
 ) (somewhat close).
The three most common membership functions are triangular, trapezoidal and Gaussian, as shown in fuzzy set B, C and D, respectively. The former two membership functions are simpler as they are shaped in straight lines forming triangular and trapezoidal forms for fuzzy sets B and C, as shown in Equations (2) and (3), respectively:

where parameters $\alpha ,\beta ,\gamma$ denote the lower limit, mode and upper limit of support, respectively, that determine the size and position of the triangular membership function.

The Gaussian membership function as shown in fuzzy set D in Equation (4) is built on the Gaussian distribution curve. This membership function is popular due to its smoothness and conciseness in the notation:

2.3.2 Rule generation and evaluation
Rule generation and evaluation of fuzzy inference covers the process of implementing certain rules to the fuzzy input and subsequently evaluating each rule across the inputs obtained from the process of fuzzification. To control the output variable, an IF-THEN rule is constructed based with one or more conditions and a conclusion. The relationships are formed by fuzzy expressions associated with its logical operators (Wang and Kerre, Reference Wang and Kerre2001).
Two logical operators typically used for a fuzzy relation are intersection (AND) and union (U). The intersection of n fuzzy sets is represented in Equation (5) with the operator of Min indicating the lowest membership value within the expression and is given as the membership value of the expression. The union of n fuzzy sets is computed as shown in Equation (6):


2.3.3 Defuzzification
Defuzzification is the reverse process of fuzzification that provides the result in a scalar value. In the present study, a centre of gravity or centroid method is applied due to its extensive use (Lin et al. Reference Lin, Lai and Yeh2007) and is calculated as shown in Equation (7):

where i shows each linguistic term of the output variable CDR performance, ${y_i}$ is the value of each linguistic term i, and $\mu ({{y_i}} )$
 is the aggregated output membership function.
3. Framework development
The present study developed a framework for predicting CDR performance from the ergonomics perspective of ATCOs as the centre of CDR processes. To propose the framework, a hybrid approach is adopted based on the SHELL model and FIS to assist for an initial prediction of the ATCOs’ conflict detection and conflict resolution performance at the air navigation service provider (ANSP) organisational level given available data of certain SHELL aspects. To provide a more refined understanding of the framework, the following aspects are further elaborated.
3.1 Variables
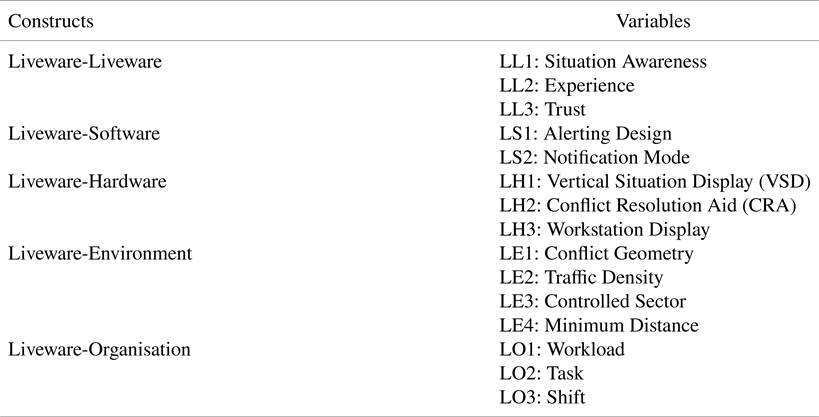
The variables analysed in this paper are categorised according to the SHELL model. Initially, the variables were adopted from Pandey and Shukla (Reference Pandey and Shukla2019) that covered SHELL variables in an overall ATC context. Since this paper focused on the CDR process in ATC, the SHELL model was adjusted accordingly. The adjustment was performed based on the literature published in the last 10 years (2011–2021), with the keywords Conflict Detection AND Conflict Resolution AND Human Factors. Based on the systematic literature review, this research extracted 20 studies examining factors affecting conflict detection and conflict resolution performance. From the review, 15 significant variables were obtained related to the CDR process. The 15 variables were then categorised into a SHELL model using the affinity approach of Pandey and Shukla (Reference Pandey and Shukla2019), as detailed in Table 1, and are elaborated further in Section 3.2.1. The SHELL constructs were subsequently treated as the categories of fuzzy subsystem for the hybrid fuzzy model.
The variables of each SHELL construct

3.2 The fuzzy model
3.2.1 The input, output linguistic variables and membership functions
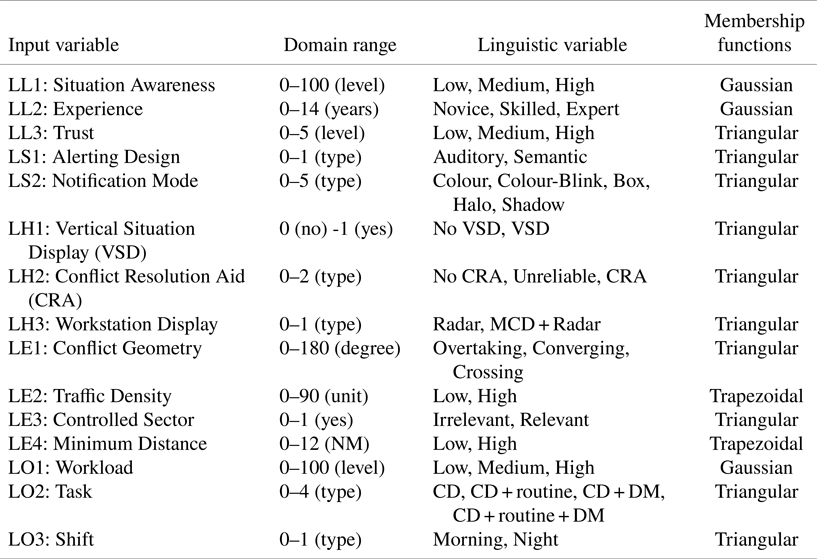
In the fuzzy logic model, parameters are fuzzified and their value ranges were identified and determined, respectively. The parameters were transformed into fuzzy sets and their memberships were defined, as detailed in Table 2. There are some justifications for the selection of the membership function for each parameter. For the continuous parameters, such as situation awareness, experience and workload, Gaussian membership was used to better reflect the distribution of the set. For the discrete parameters, such as tools (VSD, CRA, notification mode), task, shift and sector, triangular or trapezoidal membership was used due to its nature in explaining categorical levels. Regarding trust, in particular, the triangular membership was used because Mirchi et al. (Reference Mirchi, Vu, Miles, Sturre, Curtis and Strybel2015) found that the median of trust level in ATC context was 4⋅14. Knowing a specified median number, it is easier to categorise trust to three levels of low, medium and high. This is because trust is a state at cognitive level and it is challenging to see its distribution. The fuzzy sets were generated to represent the factors in modelling CDR performance that were adopted from and categorised into the SHELL model, as follows.
The linguistic variables and the respective membership functions

3.2.1.1 Liveware-Liveware (LL)
Liveware is the central component in the SHELL model reflecting the personal attributes of the human element. In the context of CDR, three factors were identified for LL interface: situation awareness (SA), experience and trust. Situation awareness is an important factor in maintaining and updating a mental picture of the air traffic situation during CDR tasks (Pekela and Hilburn, Reference Pekela and Hilburn1997; Chiappe et al., Reference Chiappe, Vu and Strybel2012; Edwards et al., Reference Edwards, Homola, Mercer and Claudatos2017; Trapsilawati et al., Reference Trapsilawati, Herliansyah, Nugraheni, Fatikasari and Tissamodie2020). Experience was perceived as the factor measuring the level of robustness of human actions and had been researched in air traffic control tasks (Kang and Landry, Reference Kang and Landry2014; Klomp et al., Reference Klomp, Borst, van Paassen and Mulder2015; Kearney et al., Reference Kearney, Li and Lin2016; Sanda, Reference Sanda2018; Wang et al., Reference Wang, Wang, Lin, Cong, Xue and Ochieng2021).
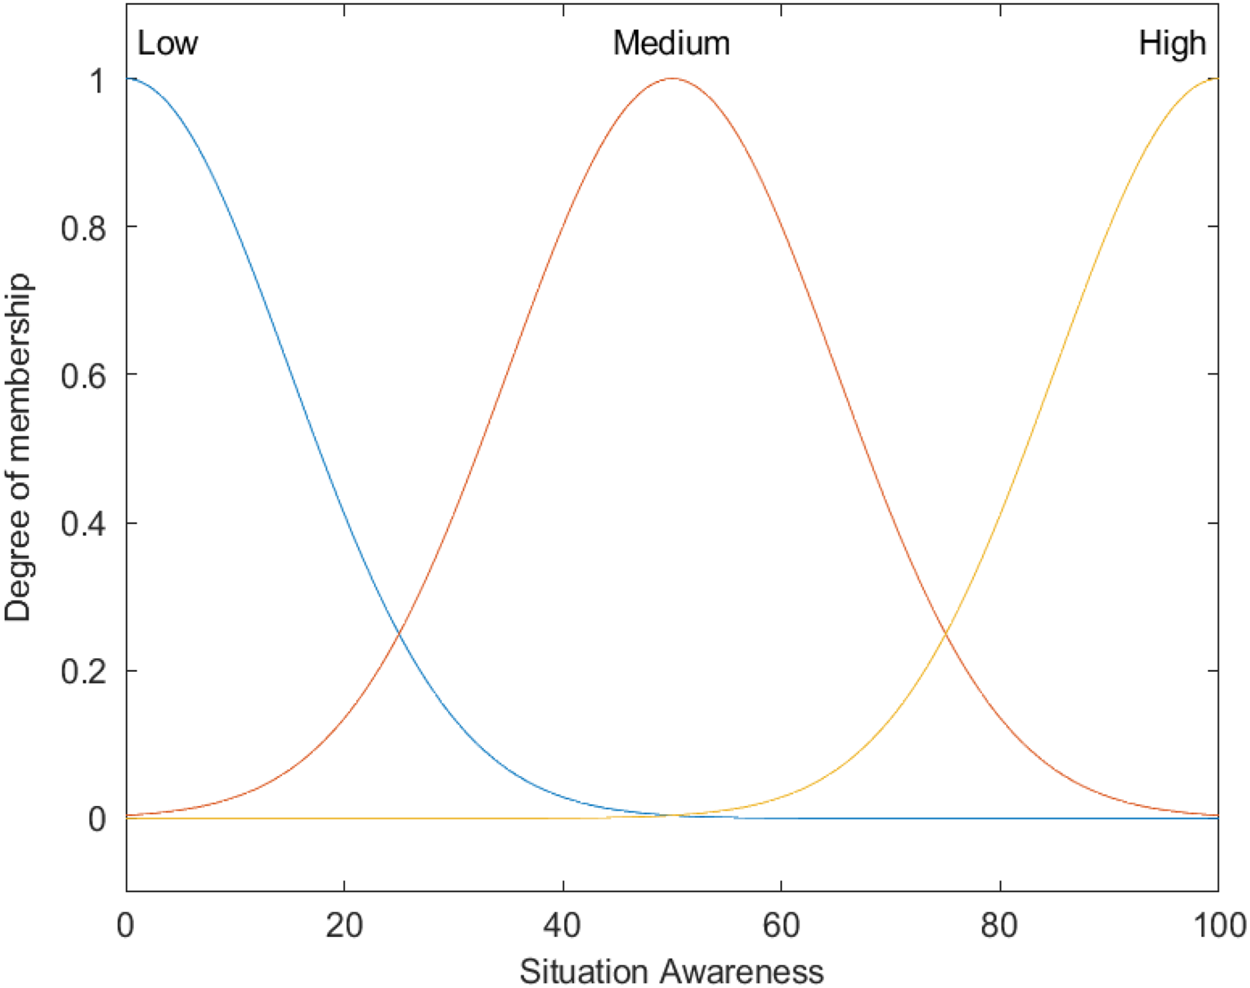
Situation awareness was fuzzified using a Gaussian membership function for the corresponding fuzzy sets consisting of three levels (i.e. low, medium, high) within a range of 0–100, as shown in Figure 2. This value indicates the SA measure of response accuracy. The range of experience was adopted from Wang et al. (Reference Wang, Wang, Lin, Cong, Xue and Ochieng2021) where the levels of ATC working experience consist of level 2 to 5. The levels were further categorised into three categories: novice, skilled (level 2 and 3) and expert (level 4 and 5). For the novice, skilled and expert levels, the mean and the standard deviation were 0 and 1⋅5; 4⋅6 and 1⋅5; 11⋅5 and 1⋅5 years, respectively.
The membership function of situation awareness

The trust level towards automation in ATC significantly influences the use of ATC automation provided in the workstation (Mirchi et al., Reference Mirchi, Vu, Miles, Sturre, Curtis and Strybel2015). The factor was fuzzified using a triangular membership function with the range of 0–5. For the trust level, the median of 4⋅14 was used to represent the medium trust as adopted from Mirchi et al. (Reference Mirchi, Vu, Miles, Sturre, Curtis and Strybel2015).
3.2.1.2 Liveware-Software (LS)
The factors in the LS interface are alerting design and notification. Alerting design and notification are linked with the conflict alert (CA) on radar display, and the notification reflects visual notifications to support supervision and monitoring processes in an ATC context. The alerting design and notification used triangular membership function for its fuzzification process with the range of 0–1 for the levels of auditory and semantic as adapted from Kearney et al. (Reference Kearney, Li and Lin2016), and 0–5 for the levels of colour, colour-blink, box, halo and shadow, as adapted from Imbert et al. (Reference Imbert, Hodgetts, Parise, Vachon, Dehais and Tremblay2014), respectively.
3.2.1.3 Liveware-Hardware (LH)
The LH interface in the context of ATC CDR is highly associated with display (Vuckovic et al., Reference Vuckovic, Sanderson, Neal, Gaukrodger and Wong2013), and additional features supporting the CDR tasks, including vertical situation display (VSD) and conflict resolution aid (CRA) (Loft et al., Reference Loft, Finnerty and Remington2011; Trapsilawati et al., Reference Trapsilawati, Qu, Wickens and Chen2015, Reference Trapsilawati, Wickens, Qu and Chen2016, Reference Trapsilawati, Chen, Qu and Wickens2021; Mercer et al., Reference Mercer, Gomez, Gabets, Bienert, Edwards, Martin, Gujral and Homola2016). All three factors were fuzzified using the triangular membership function. The display, VSD and CRA variables consist of VSD and no VSD, radar display and radar equipped with medium term conflict detection (MCD), and three levels (reliable, unreliable and no CRA), respectively.
3.2.1.4 Liveware-Environment (LE)
The LE interface covers the environmental aspects in CDR, including traffic factors. The factors were conflict geometry, traffic density, air traffic region and minimum distance between aircraft. Conflict geometry has long been investigated in ATC context from both perspectives of pilot (Thomas and Wickens, Reference Thomas and Wickens2005, Reference Thomas and Wickens2008; Lupu et al., Reference Lupu, Feron and Mao2010) and ATC (Trapsilawati et al., Reference Trapsilawati, Nugraheni and Herliansyah2018, Reference Trapsilawati, Herliansyah, Nugraheni, Fatikasari and Tissamodie2020, Reference Trapsilawati, Wickens, Herliansyah, Sari and Tissamodie2022; Pérez-Castán et al., Reference Pérez-Castán, Rodríguez-Sanz, Gómez Comendador and Arnaldo Valdés2019). Traffic density has also greatly influenced the performance in ATC CDR tasks (Vuckovic et al., Reference Vuckovic, Sanderson, Neal, Gaukrodger and Wong2013; Mirchi et al., Reference Mirchi, Vu, Miles, Sturre, Curtis and Strybel2015; Mercer et al., Reference Mercer, Gomez, Gabets, Bienert, Edwards, Martin, Gujral and Homola2016). In ATC, spatial reference is also a vital consideration for ATCOs. The spatial context provides information about target aircraft to control. The target aircraft coming from a relevant region would be controlled in a different fashion than those coming from an irrelevant region (Loft et al., Reference Loft, Finnerty and Remington2011). Lastly, minimum lateral distance is also taken into account during CDR tasks and has been formally standardised in ATC context by the ICAO with so-called minimum separation (ICAO, 2019).
The conflict geometry was fuzzified using a triangular function having three membership functions: overtaking, converging and crossing. In prior literature, the overtaking function conflict ranges from 25° to 45°. The second fuzzy value for conflict geometry represents converging conflict and covers a range of values from 75° to 105°. The third fuzzy value represents crossing conflicts with the range of values from 155° to 175°.
For traffic density, since there were various numbers referenced as low and high densities, in this study the ranges were covered and categorised into the two levels using trapezoidal membership functions. The first membership function represents low traffic density with a range of 0 to 60 aircraft. The second membership function reflects high traffic density with a range of 35 to 120 aircraft.
Variables of region and minimum distance were each categorised into two membership functions of triangular and trapezoidal, respectively. The region consists of two fuzzy sets of relevant and irrelevant regions. The minimum distance covers both low and high minimum distance ranging from 0–12 nautical miles.
3.2.1.5 Liveware-Organisation (LO)
The LO interface covers the work system and its organisation. In ATC CDR, the tasks, shifts and workload factors play an important role for performance. ATCOs are required to perform not only CDR tasks but also other routine tasks, such as monitoring traffic aircraft and decision-making tasks, including whether the ATCOs agree to pilots’ requests. Furthermore, ATC is a domain with continuous working hours, and consequently there should be several shifts of ATCOs responsible for managing the non-stop air traffic. ATC shift has also been examined in prior studies (Mateos et al., Reference Mateos, Tello, Jiménez-Martín and de Pozo2018; Jiménez-Martín et al., Reference Jiménez-Martín, Tello and Mateos2020) in its relation to ATCOs’ performance and scheduling for its countermeasure. In Chang and Yeh (Reference Chang and Yeh2010) and Pandey and Shukla (Reference Pandey and Shukla2019), workload was emphasised as one of the variables related to the organisation, together with organisational structure and communication, along with safety culture and training.
The task variable was fuzzified using a triangular membership function with four fuzzy sets representing the linguistic variables of conflict detection (CD), CD and routine tasks, CD and decision-making (DM), and CD, DM and routine tasks. The shift variable has two triangular membership functions of day and night with the range of 0 to 1. Finally, the workload variable has three fuzzy sets of Gaussian membership functions, with the linguistic variable of low, medium and high with the range of 0 to 100.
3.2.1.6 CDR performance
The ATCOs’ performance for CDR tasks is evaluated by their capability in detecting and resolving conflict. The operational definition of the performance is represented by the percentage of successful conflict resolution where no loss of separation (LOS) occurs. In air traffic control, there are separation minima for lateral and longitudinal separations between aircraft. The lateral separation is 5 NM. The longitudinal separation is 1,000 and 2,000 ft for aircraft flying below and above 29,000 ft above mean sea level, respectively (Nolan, Reference Nolan2010). When these separation minima are violated, it is called ‘air traffic conflict’ or LOS. In this model, the fuzzy sets for the respective parameters use the same Gaussian membership function in each fuzzy set. For the performance parameters, the values range from 0 to 100, divided into three fuzzy sets: poor (0–50), average (50–80), good (80–100).
3.2.2 The fuzzy rules construction and defuzzification
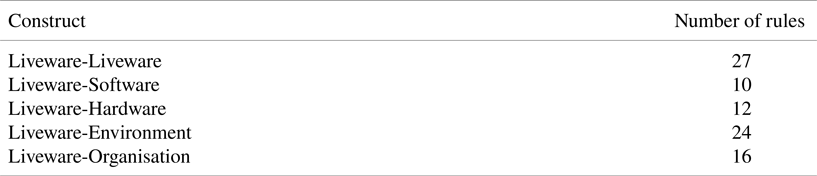
The fuzzy rules were constructed to represent the IF-THEN relationships of input and output variables according to the literature. A notable point in constructing the rules was the high number of input variables (i.e. 15 variables) for predicting the CDR performance. Therefore, the modelling was conducted by creating five fuzzy subsets according to each category in the SHELL model, including: L-L, L-S, L-H, L-E, and L-O. The rules for each fuzzy subset were generated using factorial analysis of input variables in each category in the SHELL model, yielding 89 rules in total. The rules were developed from the combination of the respective membership functions of each variable in the fuzzy subsets. In this research, the CDR performance for each rule was defined according to the effects of each input parameter in affecting the CDR performance in the prior literature. For instance, SA is correlated with CDR performance; although an operator is skilled, when he has a medium SA, he will show medium performance if he has low trust in ATC supporting tools. The low trust will lead to disuse of the tools and thus prevent the operator from increasing his SA, which can be increased by the support of ATC tools.
To reflect the CDR process affected by several parameters, the fuzzy rules with multiple antecedents were used, particularly using the following intersection function:
Rule: IF $({{x_i} is A_1^i} ) AND \ldots AND ({{x_n} is A_n^i} )$ THEN Y is B,
where $A_1^i$ , $A_2^i$
 , … $A_n^i$
 and B are the fuzzy linguistics terms reflecting the input linguistic variables ${x_{1, }}{x_{2, }}$
 … ${x_{n, }}$
 and the output linguistic variable of Y, respectively. In this study, the terms were represented by a triangular, trapezoidal or Gaussian fuzzy number.
The number of fuzzy rules for each fuzzy subsystem is detailed in Table 3. The rules for all subsets are given as follows:
The number of fuzzy rules for each SHELL interface

Rules for L-L
1. If (SA is low) AND (experience is novice) AND (trust is low) THEN (CDR performance is poor);
5. If (SA is medium) AND (experience is skilled) AND (trust is low) THEN (CDR performance is average);
20. If (SA is high) AND (experience is skilled AND (trust is medium) THEN (CDR performance is good);
…
27. If (SA is high) AND (experience is expert) AND (trust is high) THEN (CDR performance is good)
Rules for L-S
1. If (SD is auditory) AND (notification is shadow mask) THEN (CDR performance is poor);
5. If (SD is auditory) AND (notification is box-animation) THEN (CDR performance is good);
6. If (SD is semantic) AND (notification is shadow mask) THEN (CDR performance is medium);
…
10. If (SD is semantic) AND (notification is box-animation) THEN (CDR performance is good);
Rules for L-H
1. If (VSD is no) AND (CRA is no) THEN (CDR performance is poor);
4. If (VSD is yes) AND (CRA is no) THEN (CDR performance is medium);
7. If (VSD is no) AND (CRA is no) AND (MCD is yes) THEN (CDR performance is medium);
…
12. If (VSD is yes) AND (CRA is yes) AND (MCD is yes) THEN (CDR performance is good);
Rules for L-E
1. If (CG is converging) AND (TD is high) AND (Region is irrelevant) AND (MD is Low) THEN (CDR performance is poor);
8. If (CG is converging) AND (TD is low) AND (Region is relevant) AND (MD is High) THEN (CDR performance is good);
9. If (CG is crossing) AND (TD is high) AND (Region is irrelevant) AND (MD is Low) THEN (CDR performance is poor);
16. If (CG is crossing) AND (TD is low) AND (Region is relevant) AND (MD is High) THEN (CDR performance is good);
17. If (CG is overtaking) AND (TD is high) AND (Region is irrelevant) AND (MD is Low) THEN (CDR performance is medium);
…
24. If (CG is overtaking) AND (TD is low) AND (Region is relevant) AND (MD is High) THEN (CDR performance is good)
Rules for L-O
1. If (WL is high) AND (task is CD) AND (shift is N) THEN (CDR performance is poor);
8. If (WL is high) AND (task is CD + routine) AND (shift is M) THEN (CDR performance is medium);
9. If (WL is low) AND (task is CD) AND (shift is N) THEN (CDR performance is med);
…
16. If (WL is low) AND (task is CD + routine) AND (shift is M) THEN (CDR performance is good)
The execution of all fuzzy rules is done in parallel during the inference process where the input indicates the degree of all corresponding parameters in each rule. The instance of graphical representation of the rules for the L-L interface is shown in Figure 3. Consequently, the degree of values as the result of the rule mapping is the same or lower than the degree of its variables. To obtain the result of each rule, the fuzzy number is truncated according to the minimum degree of its variables. This study adopts the intersection or so-called minimum operation of the trimmed fuzzy numbers for all fuzzy rules to establish the output of inference in the fuzzy number that is further aggregated to represent the contribution of each input variable given the set of fuzzy rules (Lin et al., Reference Lin, Lai and Yeh2007). Next, a defuzzification method is implemented to translate the inference result into the original crisp values.
Graphical representation of the rules for the L-L interface

3.3 The hybrid fuzzy-SHELL model structure
In this study, fuzzy modelling was performed using the Mamdani method widely used in prior literature. The fuzzy logic operation was run with the minimum method and implication, maximum aggregation, and centroid method for the defuzzification. The fuzzy subsets were categorised, and the rules in each category were generated using factorial analysis combination. This fuzzy logic was applied to each of the five fuzzy subsets constituting the model proposed in this study.
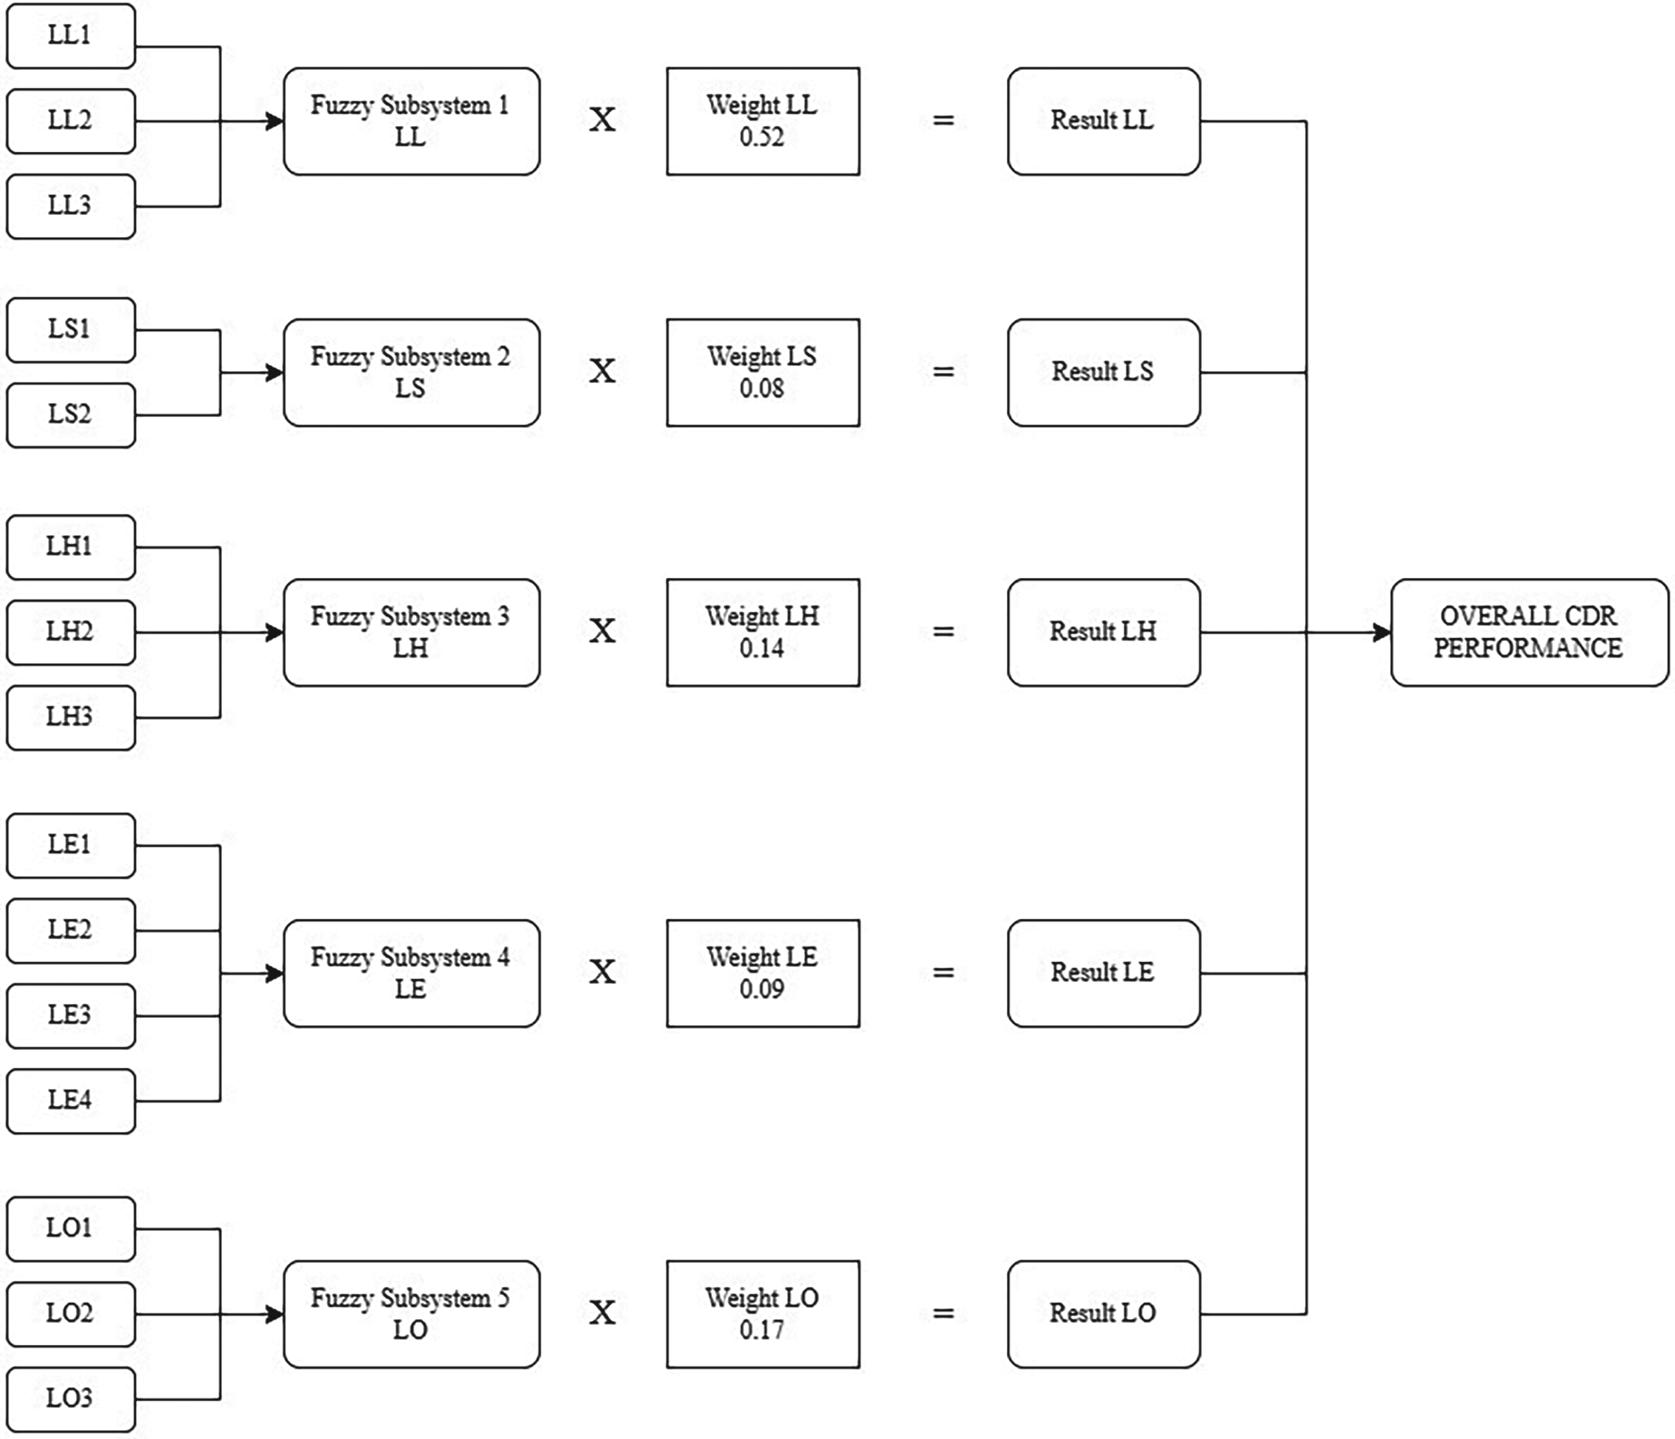
Furthermore, the value of each fuzzy output is multiplied with a certain weight for each subset representing the interface in the SHELL model, yielding the hybrid Fuzzy-SHELL model. The respective outputs of each subset were then summed to obtain the final output of the model. There are two approaches for determining weight in this study. First, the weight referred to the construct performance score for each construct of the SHELL model resulted in Pandey and Shukla (Reference Pandey and Shukla2019) that evaluated the importance of Human Factors in ATC centres using the SHELL model. The schematic diagram of the hybrid model is shown in Figure 4. The weight was then normalised further according to the availability of the fuzzy subsystems with Pandey's weight as the proportion value. The second approach was using the average weight of each interface in the SHELL model and implementing the normalisation method accordingly.
Schematic diagram of the fuzzy-hybrid SHELL framework

4. Framework validation
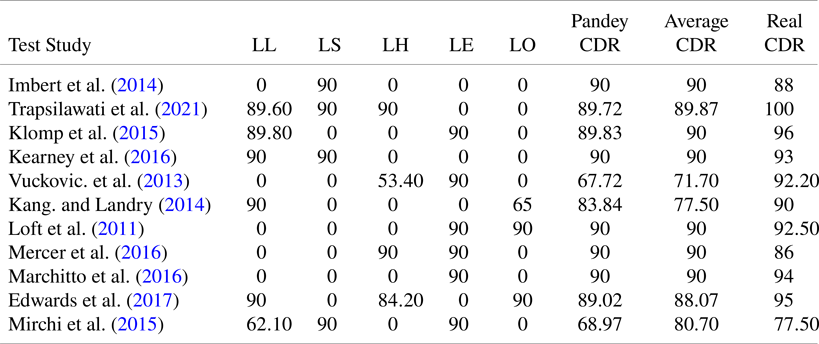
The data used for validating the framework were the metadata obtained from previous literature about CDR in an ATC context. Ten studies were involved for the framework validation, as shown in Figure 4. For each study, certain interfaces were examined. Therefore, only the respective interfaces of each study were modelled using the fuzzy-hybrid framework, and the weights were calculated accordingly using the two approaches as described earlier.
For each study, the variables related to the interface were inputted into the FIS for the respective interface. Afterwards, the respective rules generated for each interface, as detailed in Table 3, were implemented. Note that not all variables in each interface were available or applicable in each study; only the available variables that were included as the inputs in the FIS of each interface. In this research, the prior studies in Table 4 were solely used to obtain values regarding relevant variables in the interfaces as case studies to validate whether this framework can be implemented. For instance, in Trapsilawati et al. (Reference Trapsilawati, Chen, Qu and Wickens2021) in Table 4, an SA variable was examined with the highest value of 77. The average working experience of the ATCOs was 5⋅18 years. The trust level was set at 4⋅14, indicating the median trust level. By inputting these three variables into the FIS system (Figure 5) with the specified rules explained earlier, the CDR performance was 89⋅60 for the L-L interface. By applying the same approach for the L-S and L-H interfaces, the CDR performance for both of the L-S and L-H interfaces is 90.
The results of framework implementation using the metadata

An example of fuzzy output for the L-L interface

The resulting fuzzy output for each interface was then multiplied with the weights to yield the predicted CDR performance. The weights obtained from Pandey and Shukla (Reference Pandey and Shukla2019) were normalised accordingly, referring to the construct associated with the interface discussed in each study. For instance, based on the values obtained from Trapsilawati et al. (Reference Trapsilawati, Chen, Qu and Wickens2021), the CDR performance for the L-L, L-S and L-H were multiplied by normalised Pandey's weights. In this case, the Pandey's weights for the L-L, L-S and L-H were 0⋅52, 0⋅08 and 0⋅14, respectively. These weights were then normalised to be 0⋅70, 0⋅11, and 0⋅14, respectively. The CDR values for the L-L, L-S and L-H, which were 89⋅60, 90 and 90, were multiplied by 0⋅70, 0⋅11 and 0⋅14, respectively. This results in a final CDR value of 89⋅72.
For the average CDR, the average value of the available interface data was applied. For example, from Trapsilawati et al.'s (Reference Trapsilawati, Chen, Qu and Wickens2021) data, the CDR performance for the L-L, L-S and L-H interfaces were averaged, resulting in the final CDR performance score of 89⋅87. The real CDR is the highest actual CDR performance from the empirical experiment performed in each study. The predicted CDR performance using Pandey's and average weights as well as the actual CDR performance score are detailed in Table 4.
Next, we calculated the mean absolute percent error (MAPE) and the root mean square error (RMSE) for both predicted CDR performance using Pandey's and average weights, respectively, to examine the accuracy of the predicted CDR performance. The MAPE was used in addition to the RMSE to validate the fuzzy-hybrid SHELL model due to its decreased sensitivity to outliers and support for ease interpretation of the model accuracy (Carvalho Jr and Costa Jr, Reference Carvalho and Costa2017; Maués et al., Reference Maués, Sá, Costa, Kern and Duarte2019).
The MAPE and RMSE results are detailed in Table 5. The MAPE results showed that the implementation of the framework to predict the CDR performance yielded the value below 10%, which indicates highly accurate forecasting according to Lewis (Reference Lewis1982). Comparing both approaches, the predicted CDR performance using average weight of each interface resulted in higher accuracy for both MAPE and RMSE measures.
5. Discussion
This study proposes a framework to predict CDR performance using a metaheuristic approach. The framework is built based on a fuzzy inference system and the SHELL model. The framework covers five stages, including fuzzification, rule evaluation, defuzzification, weight application and total output calculation. The fuzzification process is conducted for input variables that belong to each interface in the SHELL model. In addition, the rules are generated in each pile of the fuzzy subsystem representing the SHELL interfaces. The defuzzification is then performed accordingly based on the rules generated in each fuzzy subsystem. The crisp outputs resulted from the FIS of each interface are then multiplied with the respective weights, yielding the overall predicted CDR performance.
The development of the fuzzy-hybrid SHELL framework was inspired by the fuzzy-hybrid models that have been developed in other domains, such as construction (Maués et al., Reference Maués, Sá, Costa, Kern and Duarte2019) and medical settings (Kaur and Khehra, Reference Kaur and Khehra2022). The model for predicting conflict resolution performance in ATC context that has been available merely focused on the traffic or environmental aspect considering aircraft direction, relative speed and minimum distance (Lovato et al., Reference Lovato, Fontes, Embiruçu and Kalid2018; Reva and Borsuk, Reference Reva and Borsuk2021) and only cover the technical algorithms or approaches in CDR. However, there is not yet any framework to predict the CDR performance from a human factor perspective in ATC context comprehensively considering the full interfaces of human systems interaction. This study is, to our best knowledge, the first framework incorporating both FIS and the SHELL model to predict CDR performance from the perspective of full-fledged human systems interaction. In real use at the ANSP, they can input the values based on the real situation of the software, hardware, environment, liveware and organisation aspects at the ANSP to predict the CDR performance from a human factors perspective. The ANSP can also propose future policies or improvement scenarios and simulate the scenarios using the framework to predict the CDR performance prior to implementation.
The measures of CDR prediction accuracy

The results of the framework application show a highly accurate forecast for predicting the CDR performance, as indicated by the MAPE value of 6⋅42% and 5⋅36% for Pandey's and average weights, respectively. The fuzzy-hybrid SHELL model has the RMSE of 0⋅09 for both Pandey's weight (9⋅69%) and average weight (9⋅08%). This finding revealed that the fuzzy-hybrid SHELL model using the average weight showed the highest consistency of 90⋅92% for predicting the CDR performance. These results generally yielded a more accurate forecast as compared with the fuzzy model results in other domains. In product development, the model had an RMSE of 12⋅35% (Lin et al., Reference Lin, Lai and Yeh2007), which is well above the RMSE of this study. In the construction domain, the model showed MAPE results of 8⋅56% (Maués et al., Reference Maués, Sá, Costa, Kern and Duarte2019), greater than the MAPE in this study. Collectively, this suggests that the model offers a promising method for predicting CDR performance given the set of variables for each interface in the SHELL model in an ATC context.
The performance of the fuzzy-hybrid SHELL model recommends that it can be used to help supervisors in an ATC system to predict the CDR performance of ATCOs on duty in an ATC centre given the available data of input variables for the respective SHELL interfaces. Early detection is useful for setting a safety awareness level and focusing on the improvement of certain interfaces that require attention in the ATC centres. The fuzzy-hybrid SHELL model also provides an effective approach for designing an ideal ATC system that is safe for shorter and longer runs. For instance, the ANSPs and ATC supervisors can use the model to input the values of the variables in each interface in a certain ATC centre and then obtain the predicted performance for CDR tasks, which are the main tasks during the ATC operations. If the ANSPs are not satisfied with the predicted CDR performance in an ATC centre, the ANSPs can focus on improving the variables and modifying the combination of the variables to measure a new predicted performance. This process can be performed in a quicker and more efficient manner to evaluate ATC centres and, ultimately, to maintain air traffic safety.
6. Conclusion
In this paper, a fuzzy-hybrid SHELL framework is presented to predict CDR performance in an ATC context. To provide an illustration of the framework application, the data from 10 prior studies concerning CDR were collected as the inputs for the model. To allow for evaluation of the interfaces in the SHELL model, several sets of fuzzy rules were constructed for each interface in the SHELL model, including L-L, L-S, L-H, L-E and L-O. The fuzzy outputs of each interface were then weighted according to Pandey and Shukla (Reference Pandey and Shukla2019) and average approaches. To justify the framework, the measures of MAPE and RMSE were calculated for both weights. The results demonstrated that the fuzzy-hybrid SHELL framework adopting average weight for each interface had a better accuracy in predicting CDR performance. This suggests that the fuzzy-hybrid SHELL framework is a promising approach for predicting CDR performance as characterised by the variables in the SHELL model in an ATC context. The framework can be further applied by ANSPs to propose future policies, simulate them, and assess the performance in ATC centres given the available data at the respective centres, with the ultimate goal for maintaining air traffic safety and improving ATC operations efficiency.