1. Introduction
1.1 Two-to-one interlingual mapping
A common phenomenon regarding bilingualism is that two different phonemes in one language may match to one and the same phoneme in the other language. For instance, Dutch and German learners have difficulty distinguishing English /æ/ and /ɛ/ because they only have /ɛ/, whose acoustic distribution primarily overlaps with, although still differs from, the English /ɛ/ (Bohn & Flege, Reference Bohn and Flege1990; Flege, Bohn & Jang, Reference Flege, Bohn and Jang1997; Wang & van Heuven, Reference Wang, van Heuven, van de Weijer and Los2006). Similarly, Japanese learners have difficulty distinguishing English /r/ and /l/ because they only have /ɾ/ which, while also apico-alveolar, is instead a tap (Miyawaki, Strange, Verbrugge, Liberman, Jenkins & Fujimura, Reference Miyawaki, Strange, Verbrugge, Liberman, Jenkins and Fujimura1975; Best & Strange, Reference Best and Strange1992). Such phenomena have been extensively investigated in second-language phoneme perception, and the related confusions in lexical access have also been studied.
In lexical decision, the minimal pairs in the second language, which are not contrastive in the native language, become ‘pseudo-homophones’ (e.g., English locket vs. rocket for Japanese listeners) and prime each other like repetitions for the same word (Pallier, Colomé & Sebastián-Gallés, Reference Pallier, Colomé and Sebastián-Gallés2001; Cutler & Otake, Reference Cutler and Otake2004; Dufour, Nguyen & Frauenfelder, Reference Dufour, Nguyen and Frauenfelder2007). ‘Near-words’ constructed by replacing a phoneme (e.g., English /t/ in skirt) with its confusing phoneme (e.g., English /d/) are taken as words by listeners who have difficulty distinguishing the pair in their native language (e.g., Dutch /t/ and /d/ are neutralized in word-final positionFootnote 1); for the non-native listeners in repetition priming, such ‘near-words’ embedded in a context also prime the corresponding real word (e.g., half lied primed flight) causing ‘phantom word activation’ (Broersma & Cutler, Reference Broersma and Cutler2008).
The two-to-one interlingual mapping can be asymmetrical. For instance, the Japanese /ɾ/ is perceptually more similar to the English /l/ than to the English /r/ (Iverson, Kuhl, Akahane-Yamada, Diesch, Tohkura, Kettermann & Siebert, Reference Iverson, Kuhl, Akahane-Yamada, Diesch, Tohkura, Kettermann and Siebert2003; Aoyama, Flege, Guion, Akahane-Yamada & Yamada, Reference Aoyama, Flege, Guion, Akahane-Yamada and Yamada2004). The phonetic asymmetry also affects how the phonetic representations activate lexical representations. In auditory picture-word identification, the picture of a locker triggered more interference with the selection of the target rocket than vice versa (Cutler, Weber & Otake, Reference Cutler, Weber and Otake2006). A similar asymmetry was found between pencil and panda for Dutch–English bilinguals and Dutch learners of English (Weber & Cutler, Reference Weber and Cutler2004; Escudero, Hayes-Harb & Mitterer, Reference Escudero, Hayes-Harb and Mitterer2008). According to Weber and Cutler (Reference Weber and Cutler2004, Reference Wang, van Heuven, van de Weijer and Los2006), these results support two aspects of bilingual lexical access. First, the L2 acoustic input is captured by the native phonemic categories. Second, even though an inaccurate categorization may happen during the phonetic processing before lexical access, L2 phonemes which are non-contrastive in native perception can still be stored with distinctive mental representations.
1.2 Tonal mapping
Lexical tone has been considered as a special type of phoneme in speech production and perception.Footnote 2 Although categorical perception of native tones is supported by recent neurophysiological studies (Chandrasekaran, Krishnan & Gandour, Reference Chandrasekaran, Krishnan and Gandour2009; Xi, Zhang, Shu, Zhang & Li, Reference Xi, Zhang, Shu, Zhang and Li2010; Li & Chen, Reference Li and Chen2015), the native perception of Chinese tones in behavioral studies is ‘quasi-categorical’, neither as categorical as that of consonants nor as continuous as that of vowels (Hallé, Chang & Best, Reference Hallé, Chang and Best2004; Liang & van Heuven, Reference Liang, van Heuven, Doetjes and van de Weijer2005, Reference Liang, van Heuven, Gussenhoven and Riad2007). Tonal information, compared with segmental information, is also retrieved later (Ye & Connine, Reference Ye and Connine1999; Zhang & Damian, Reference Zhang and Damian2009; Zhang & Zhu, Reference Zhang and Zhu2011) and involves different neuronal networks (e.g., Liang & van Heuven, Reference Liang and van Heuven2004) in speech productionFootnote 3.
Moreover, in lexical processing lexical tones and segments showed both similarities and differences. Similar to consonants and vowels, lexical tones distinguish (otherwise identical) lexical minimal pairs and tone-alone mismatching can reduce form priming (Lee, Reference Lee2007; Sereno & Lee, Reference Sereno and Lee2015). Also, lexical adaptation (McQueen, Cutler & Norris, Reference McQueen, Cutler and Norris2006; Mitterer, Chen & Zhou, Reference Mitterer, Chen and Zhou2011) works similarly in tones and consonants. Constraining activation works similarly with tone- and rime- mismatches (Malins & Joanisse, Reference Malins and Joanisse2010). Different from segments, the overlap of SC tones alone induces no facilitatory priming effect in implicit priming (Chen, Chen & Dell, Reference Chen, Chen and Dell2002), nor in auditory priming (Sereno & Lee, Reference Sereno and Lee2015).
Despite the similarities and differences of tonal versus segmental processing reported in the literature, there is so far no direct study that taps into the lexical access of tonal bilinguals regarding two-to-one interlingual tonal mapping. This, however, is an important question to address, taking bilingualism and interlingual two-to-one mapping into consideration.
First, bilingualism may influence tonal processing in lexical access. It was recently found that, compared with SC tonal monolinguals, native Shanghai–SC and Cantonese–SC bilinguals showed later integration of SC tonal probabilities in eye-tracked character identification (Wiener & Ito, Reference Wiener and Ito2014).
Second, tonal languages and dialects also abound in two-to-one mapping. For instance, Jinan Mandarin (JM) has only one rising tone (JM rising) (Qian, Reference Qian1997) whereas Standard Chinese (SC) has two rising tones, one high-rising and one low-rising (Shen & Lin, Reference Shen and Lin1991; Moore & Jongman, Reference Moore and Jongman1997). Impressionistically speaking, the JM rising tone sounds similar to both SC rising tones but more similar to the SC high-rising tone.Footnote 4 For L2 learners, this would form a category-goodness assimilation pattern in the terms of Best's (Reference Best and Strange1992) Perceptual Assimilation Model (PAM). It is not clear how such two-to-one interlingual mapping may be processed for lexical tones, compared with segmental phonemes.
1.3 Research questions
The current study therefore set out to investigate the two-to-one interlingual mapping of SC and JM rising tones regarding the following research questions.
First, given that the JM rising tone overlaps with both SC rising tones in the acoustic distribution, the question is how SC–JM bilinguals store the rising tones in their mental lexicon for auditory lexical access. Specifically, do they store the JM rising tone with its more similar SC tone as the same representation? There are two possibilities, which we aimed to tease apart.
One possibility is that only two tonal representations are stored, one high-rising and the other low-rising, but one of them (presumably the high-rising representation shared by SC high-rising and JM rising) serves both JM and SC lexical access. If this is true, we should expect one of the SC rising tones (presumably the SC low-rising tone) to fail to match any JM tonal representation in lexical access, because it needs to maintain the contrast with the high-rising tonal representation shared by SC and JM.
The other possibility is that bilinguals store three separate tonal representations. Given the limited acoustic space for the realization of three distinct rising tone categories, it would be important to investigate how the three different tonal representations are associated with their acoustic representations, and how their potential overlap (as suggested by impressionistic observations) may lead to, e.g., the activation of a JM rising tone given an SC high-rising or low-rising tone during lexical access. With the two-to-one acoustic overlapping, this three-representation possibility suggests that the mental specifications for SC and JM rising tones are also overlapping and predicts that the canonical realizations of SC high-rising and SC low-rising tones might both be allowed as JM rising tones in lexical access. This possibility also implies that tonal categories are stored in terms of fine-grained acoustic specifications, and bilinguals need to process the same tonal acoustic realization differently depending on the target language. This is similar to the previous finding that Greek–English early sequential bilinguals gave different category-goodness ratings for the same physical stimuli depending on the target language (Antoniou, Tyler & Best, Reference Antoniou, Tyler and Best2012).
Second, as mentioned above, the canonical realization of the SC high-rising tone, compared with that of the SC low-rising, may be a better exemplar of the JM rising tone. Does this difference in category-goodness influence the interlingual phantom activation of the JM lexical representations? If the asymmetrical two-to-one mapping patterns found for both consonants and vowels (Weber & Cutler, Reference Weber and Cutler2004; Cutler et al., Reference Cutler, Weber and Otake2006; Escudero et al., Reference Escudero, Hayes-Harb and Mitterer2008) also apply to tone, the answer should be positive. In other words, with the segmental structure aligned, a high-rising SC pseudo-word, acoustically more similar to a real JM word in tone, should be more likely and more quickly accepted as a JM word.
Third, supposing the asymmetrical mapping influences lexical access, to what extent does the interlingual category-goodness influence speech comprehension? More specifically, would the influence last until the stage of semantic activation?
Researchers have a strong consensus that phonological and semantic activation proceed in a largely cascading way in auditory speech comprehension (Marslen-Wilson & Welsh, Reference Marslen-Wilson and Welsh1978; Grosjean, Reference Grosjean1980; Marslen-Wilson, Reference Marslen-Wilson, Bouma and Bouwhuis1984), which has been supported by both behavioral and neurophysiological evidence (Marslen-Wilson, Reference Marslen-Wilson1973; Zwitserlood, Reference Zwitserlood1989; Rodriguez-Fornells, Schmitt, Kutas & Münte, Reference Rodriguez-Fornells, Schmitt, Kutas and Münte2002).
Previous studies, nevertheless, have shown that, with the lexical node accessed, the pattern of lexical semantic activation can vary with the experimental tasks (Seidenberg, Waters, Sanders & Langer, Reference Seidenberg, Waters, Sanders and Langer1984) and designs (McNamara & Altarriba, Reference McNamara and Altarriba1988; Shelton & Martin, Reference Shelton and Martin1992). The remaining question is whether semantic activation is partly independent from lexical activation. The study aimed to tease apart two possibilities. If the processing between lexical access and semantic activation is purely cascading, the effect of interlingual category-goodness should be consistent on lexical access and semantic activation. More specifically, if high-rising SC pseudo-words are more likely and more quickly accepted as real JM words, they should also increase the semantic activation of these JM lexical nodes and strengthen their semantic priming effects. The alternative possibility is that the process between lexical access and semantic activation is partly independent, which prevents some probabilistic specification at the lexical level from cascading onto the semantic level. If so, the influence of the category-goodness may stop after lexical activation. Specifically, even if high-rising SC pseudo-words are more likely and more quickly accepted as real JM words, their semantic priming should be equivalent to their low-rising counterparts.
1.4 General design
The strength of lexical activation and semantic activation were tested with the semantic priming paradigm (in Experiment 3). We constructed pairs of high- and low-rising SC pseudo-words which are segmentally identical to rising-tone JM real words. Under the presumption that these SC pseudo-words can activate corresponding rising-tone JM real words, they were included in a lexical decision task and used to prime JM real words which are semantically related to the rising-tone JM words.
On the one hand, the primes (high- and low-rising SC pseudo-words) may differ in how likely and how quickly they would be accepted as JM real words, corresponding to their observed acoustic interlingual categorical goodness. This difference would reflect the influence of interlingual category-goodness in bilingual lexical access. On the other hand, high- and low-rising SC pseudo-words may differ in their effectiveness in triggering semantic priming, which would reflect the influence of interlingual category-goodness in semantic activation.
Note that the acoustic similarities between JM rising tone and SC high-rising and low-rising tones have been based mainly upon impressionistic auditory description or small-scale acoustic data. Before investigating tonal mapping in lexical access, it is necessary to verify the observation that both SC rising tones overlap with the JM rising tone in acoustic distribution. Furthermore, it is important to confirm that the JM rising tone does sound like both of the SC rising tones in SC native perception and there is asymmetrical mapping in both production and native perception. The comparison of the acoustic distributions can be achieved via investigating the production of these tones by both SC and JM native speakers (Experiment 1). The naïve interlingual perception can be tested with interlingual tonal identification by SC tonal monolinguals (Experiment 2).
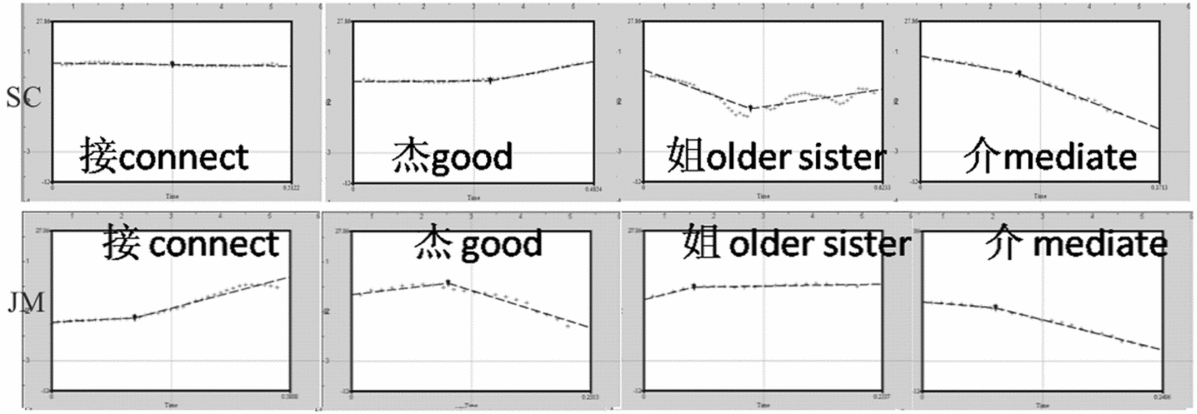
Understanding of the design of the study requires proper knowledge of the SC and JM tonal system. First, SC has four monosyllabic citation tones (Fu, Reference Liu1924; Chao, Reference Chao1948a; Brotzman, Reference Brotzman1964; Dreher & Lee, Reference Dreher and Lee1968), as demonstrated in the upper panel of Figure 1 with examples.Footnote 5 JM also has four monosyllabic citation tones (Qian, Reference Qian1997; Qian & Zhu, Reference Qian and Zhu1998), shown in the lower panel of Figure 1 with examples.
Upper panels: pitch contours on the rimes of a SC monosyllabic tonal minimal set with the same segmental structure /ʨiɛ/ [from left to right, 1: high-level, 2: high-rising, 3: low-rising (dipping); 4: falling]. It is pronounced by a young female SC native speaker with PSC 1b. Examples of SC pitch contours plotted with early recordings can be found by Brotzman (Reference Brotzman1964), Dreher & Lee (Reference Dreher and Lee1968), and Liu (Reference Liu1924). Lower panels: Pitch contours on the rimes of a JM monosyllabic tonal minimal set with the same segmental structure /ʨiɛ/ [from left to right, 1: rising, 2: high-falling, 3: high-level; 4: low-falling], pronounced by an old male JM speaker recorded by Qian (Reference Qian and Zhu1998). The plots were made with raw data (dotted line) and a custom-made piecewise regression function (dashed line) in Praat (Boersma & Weenink, Reference Boersma and Weenink2014). The dotted lines represent the pitch contour.

Second, both SC and JM have tone sandhi and contextual tonal variants. Before another low-rising tone, SC high-rising and low-rising are nearly merged (Peng, Reference Peng, Broe and Pierrehumbert2000; Yuan & Chen, Reference Yuan and Chen2014) and not distinguishable in speech perception; they both sound like SC high-rising in isolation. For instance, 土改 /tʰu(low-rising) + kai(low-rising)/ “land reform” and 涂改 tʰu(high-rising) + kai(low-rising)/ “alter” are near-homophones in SC, due to the contextual tonal change of the first syllable in 土改 (i.e., /tʰu(low-rising)/), which is realized with a high-rising pitch contour, comparable to that of the high-rising tone in 涂改 (i.e., /tʰu(high-rising)/). Also, the rising part of the SC low-rising tone usually only appears in isolation at prosodic word boundaries (Chao, Reference Chao1948b; Howie, Reference Howie1976), and creaky voice appears more frequently in the lowest part of the SC low-rising tone (Garding, Kratochvil, Svantesson & Zhang, Reference Garding, Kratochvil, Svantesson and Zhang1986; Keating & Esposito, Reference Keating and Esposito2007). On the other hand, analogous to the behavior of the Standard Chinese low-rising tone, the Jinan rising tone is realized with higher pitch in non-final positions than it is in final position or in isolation. Hence, the asymmetrical two-to-one tonal mapping is conditional, only valid in isolation and at prosodic word boundaries, the latter of which is the context that we will limit our attention to when choosing stimuli.
The next sections describe the three experiments testing the production (Experiment 1), perception (Experiment 2), lexical access (Experiment 3), and semantic effects (Experiment 3) of the SC and JM rising tones.
2. Experiment 1: acoustic distribution of JM and SC rising tones
Experiment 1 aimed at investigating the acoustic distributions of the JM and SC rising tones at the end of disyllabic word forms (JM words and SC pseudo-words), in the context of different preceding tones.
2.1 Participants
Forty-two native JM tonal bilinguals from Jinan (16 male and 26 female, aged between 23 and 76 years, M = 40.29, SD = 17.04; seventeen SC dominant or balanced, twenty-five JM dominant) and 48 SC tonal monolinguals from Beijing (7 male and 41 female, aged between 19 and 30 years, M = 22.73, SD = 2.95) participated in this experiment in exchange for payment. All participants passed a selection procedure, where all candidates read aloud a small Chinese passage (the bilinguals in both JM and SC, and the monolinguals in SC) and any candidate who could not read it through, or code-mixed frequently, was excluded.
The selected tonal bilinguals were highly proficient early bilinguals. They acquired both SC and JM in early childhood and they were able to converse fluently in both SC and JM. Nevertheless, they reported varied proficiency and frequency of language usage. The language dominance reported here was derived from self-reported frequencies of language usage on a ten-point scale, depending on which dialect was used more frequently.
The SC tonal monolinguals were practically defined as people who speak only one tonal language, namely SC, and selected according to the following criteria: (1) they do not speak any other Chinese dialect or any non-Chinese tonal language; (2) they were born in, or moved to, the urban areas of Beijing before 12 months of age; and (3) they did not live with anybody who speaks any other Chinese dialect before the age of 18.
2.2 Corpus preparation
The list of stimuli is composed of 16 final-rising disyllabic JM words and their corresponding SC pseudo-words, either ending with high-rising or low-rising SC tones (see the appendix). Final-rising disyllables were analyzed separately depending on the tone of the first syllable.
These JM final-rising disyllabic words were selected from a 400-word corpus produced by the 42 JM speakers, described in section 2.1. The selection of the 16 JM words was based on the following considerations. First, their targeted JM tonal patterns were produced by at least 88% of the JM speakers in our corpus and they do not have false-friends in SC. Words with a JM high-falling tone in the first syllable were avoided because their acoustic realization is undergoing active historical sound change. In order to construct their corresponding SC pseudo-words, the sub-components (i.e., the monosyllables) of these disyllabic JM words were also ensured to have proper false-friends in SC (i.e., without frequent alternative pronunciation variants). Both JM and SC morphemes can be written with Chinese characters.
For each chosen JM final-rising word, a pair of SC pseudo-words was constructed, which shares the same monosyllabic morpheme in the first syllable and ends with monosyllabic tonal minimal pairs carrying SC high and low-rising tones, respectively. For instance, a pair of SC disyllabic pseudo-words were constructed as 绳银 /ʂəŋ in (high-rising + high-rising)/ and 绳引 /ʂəŋ in (high-rising + low-rising)/, which are homophone candidates for the JM word 声音 “sound” /ʂəŋ in ([high-]rising + rising)/.
Similar recording procedures were used for the SC–JM bilinguals and the SC monolinguals. Participants were told to name words printed in Chinese characters in the target dialect. The instructions were given in dialect-neutral Chinese characters. The stimuli were presented in a different random order for each speaker. After producing each item, the speakers proceeded to the next item by pressing a key.
We used Praat (Boersma & Weenink, Reference Boersma and Weenink2014) to extract pitch contours on the rimes. A trained phonetician listened to each recording, looked at the spectrogram, and manually marked the rimes. Also, recordings with speech errors or recording errors were excluded from the corpus in this process. Afterwards, the pitch contours were converted from hertz to semitones with 100 Hz as the base and then transformed into z-scores based on the speakers’ means and standard deviations. This normalization removed the difference of pitch register across speakers, which is not the focus of the present study. The normalized pitch contours were then interpolated to 20 temporally equidistant points per syllable to remove any differences in duration.
Note that the age range of the tonal bilingual group was greater than that of the younger tonal monolingual group. It is known that JM speakers of different ages may prefer different lexical variants (Qian, Reference Qian1997; Wu, Chen, van Heuven & Schiller, submitted), and age would affect the pitch range and register (Ptacek, Sander, Maloney & Jackson, Reference Ptacek, Sander, Maloney and Jackson1966). The potential confounding effect from lexical variants was prevented by selecting words without age-dependent lexical variants. To compensate for the age-related influence on pitch, first, the corpus was prepared with by-speaker normalization to remove individual difference in pitch register. Second, Speaker was further included as a random factor in the statistical modeling to control for the variation of pitch contours across speakers. These methods made the bilingual and monolingual groups’ production as comparable as possible.
2.3 Analysis
The current study compared two SC rising tones against their common JM counterpart. The tonal information is largely represented with pitch contours, which can be treated as time-dependent non-linear functions of pitch values, varying with tonal categories and the other factors. To evaluate the effects on the shape of pitch contours, the modeling method should support complex non-linear time-pitch relation. Thus, Generalized Additive Models (GAM) were used (Wood, Reference Wood2006; Reference Wood2011). They are a type of regression model, which include a type of predictor called ‘smooth function’. The smooth functions are parametric or non-parametric functions for one variable or the interaction of variables. In the current study, the predictors include smooth functions for the non-linear relations between the pitch value and the position of the point on the pitch contour. This method provided more realistic modeling for contour tones.
We built GAMs using the ‘mgcv’ package (Wood, Reference Wood2006; Reference Wood2011) in R (R Core Team, 2013). The data from each JM tonal combination, together with its two corresponding SC tonal combinations, were fitted with separate models. Each model included Pitch as the dependent variable, which was modeled with the following linear and smooth predictors. Smooth functions were used to model non-linear functional relations between Pitch and the position of the point on the pitch contour (time-point). The three-level factorial predictor Tone (the JM or SC tone carried by the ending syllable: JM rising, SC high-rising, and SC low-rising) was included in both the fixed linear predictors and fixed smoothes. The candidates for random predictors were item ID, set ID (each JM real word and its similar final high-rising and low-rising SC pseudo-words form a set), and Speaker. Since item ID is nested under set ID and predictable due to the combination of set ID and tone, we built models which would otherwise be identical, including item ID and set ID together, set ID alone, or item ID alone in the random terms. The structure of the final model was decided by model comparison based on the Akaike Information Criterion likelihood values (Sakamoto & Ishiguro, Reference Sakamoto and Ishiguro1986), yielding models with the smoothes of the by-Speaker random slope of time-point and the smooth of by-word ID random slope of time-point. After the structure of the model was decided, autocorrelation values were calculated based on the order of data points in the pitch contour. The greatest value was included as the AR1 correlation parameter to build the corresponding AR1 error model (Wood, Reference Wood2006; Reference Wood2011) but when the AR1 error model did not improve the original model, the original model was reported.
2.4 Results
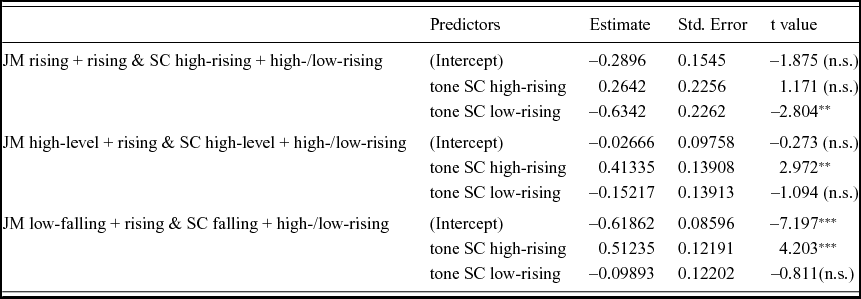
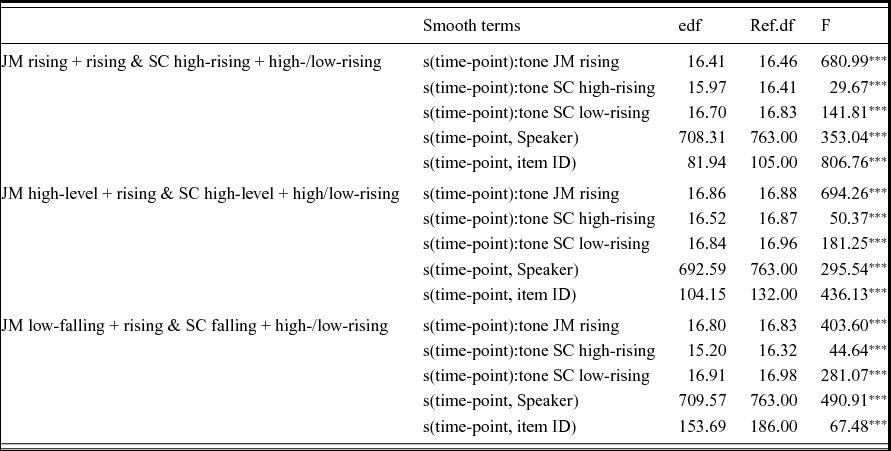
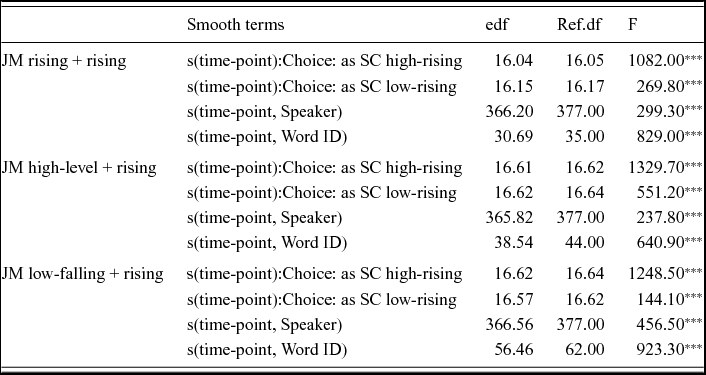
The fitted models accounted for 76.1% of the variance in the data of the JM and SC rising + (high-/low-)rising tonal combination, 86.7% of the variance in the data of the JM and SC high-level + (high-/low-)rising tonal combination, and 76.4% of the variance in the data of the JM and SC falling + (high-/low-)rising tonal combination. The coefficients for the parametric predictors are shown in Table 1. The number of degrees of freedom in the smooth terms and the associated F-statistics are shown in Table 2.
Coefficients for the linear predictors in the generalized additive model fitted to Pitch of JM & SC production data (Experiment 1, ** p < .01, *** p < .001).

Coefficients for the smooth terms in the generalized additive model fitted to Pitch of JM & SC production data (Experiment 1,*** p < .001).

As shown by the scattered contour plots in the upper panel of Figure 2, the JM rising tone (red and yellow) overlaps with both SC rising tones (green and blue) in the acoustic distribution, with greater overlap with the SC high-rising tone.
Scattered contour plots (upper panels, Experiment 1 & 2) and estimated smoothes (lower panels, Experiment 1) for the final-rising JM words (JM rising: red/yellow), final-high-rising SC pseudo-words (SC high-rising, green), and final-low-rising SC pseudo-words (SC low-rising, blue). In the scattered contour plots, JM R contours are coloured from red to yellow, according to the data from Experiment 2. The more likely a contour was identified as SC high-rising, the redder it is; the more likely it was identified as SC low-rising the yellower it is.

Note that the F-statistics for the smooth terms compared each manipulation level to the average level. To judge whether the three rising tones statistically differed in their pitch contours, the estimated smoothes and the confidence intervals were analyzed post-hoc, which is shown in the lower panel of Figure 2 (van Rij, Wieling, Baayen & van Rijn, Reference van Rij, Wieling, Baayen and van Rijn2015). The final low-rising SC pseudo-words carry lower pitch contours on the second syllable than their final high-rising counterparts. The contours of final-rising JM words lie in between those of the two SC rising tones.
Experiment 1 verified that the acoustic distribution of JM rising largely overlaps with both SC high-rising and SC low-rising at word final position, the overlap with SC high-rising being larger than with SC low-rising. Despite the overlap, the GAM modeling showed that the three rising tones have different distributional centers, with JM rising lying between SC high-rising and SC low-rising.
3. Experiment 2: identification of JM words as SC pseudo-words
Having established the different but overlapping acoustic distributions of the SC and JM rising tones in Experiment 1, Experiment 2 tested SC tonal monolinguals’ perception of the JM rising tone as SC tones. In order to verify the claim that the acoustic realizations of JM rising can match both SC high-rising and SC low-rising in SC-native speech perception, SC-native listeners identified aurally presented JM words as SC pseudo-words. This experiment also investigated the relation between interlingual identification and the shape of pitch contours. To avoid the bilinguals’ knowledge of JM tones from influencing the results, only SC tonal monolinguals were tested.
3.1 Participants
The SC tonal monolinguals who participated in Experiment 1 also participated in Experiment 2.
3.2 Design and Stimuli
The 16 final rising disyllabic JM words (as shown in the Appendix) produced by the 42 JM speakers in Experiment 1, with production errors and non-dominant variants excluded (16 words × 48 speakers – 107 errors), were used as the stimuli in Experiment 2. Additionally, for the training stimuli, another SC–JM tonal bilingual who is highly proficient in both dialects produced the corresponding SC pseudo-words for each of the 16 JM words.
3.3 Procedure
The SC tonal monolinguals performed a tonal identification task upon JM auditory stimuli using the E-Prime software (Schneider, Eschman & Zuccolotto, Reference Schneider, Eschman and Zuccolotto2002) in a quiet room. With all the renditions of the JM words presented binaurally in different random orders twice in separate blocks, the participants judged which of the two corresponding SC pseudo-words printed on the screen was heard. The participants had 5,000 ms to make the judgment and the following stimulus appeared 1,000 ms after the response. Thirty-two training trials with real SC pseudo-words were tested before the crucial trials with feedback, and the results helped to verify that the participants were able to identify the training stimuli with high accuracy [grand mean accuracy = 0.97 (SD = 0.17); by-item accuracy ranged from 0.74 to 1, and by-participant accuracy ranged from 0.91 to 1].
3.4 Analysis
In order to investigate how SC monolinguals perceive the JM rising tone, we built GAMs with the same procedure as used in Experiment 1. Note that regression models do not imply causal relationship between the predictors and dependent variables. To better align the results with the findings from Experiment 1, Pitch was also used as a dependent variable here. The models included Choice (the SC tonal monolinguals’ choice for each stimulus) as the factorial predictor, as well as a thin-plate regression spline smooth term to model the interaction of time-point (position of the point in the pitch contour) and Choice. Word ID, Speaker, and Participants were included as the candidates for random predictors, and the final model (Sakamoto & Ishiguro, Reference Sakamoto and Ishiguro1986) included the smooth of the by-Speaker random slope of time-point and the smooth of the by-Word ID random slope of time-point. AR1 error models were also built (Wood, Reference Wood2006; Reference Wood2011).
3.5 Results
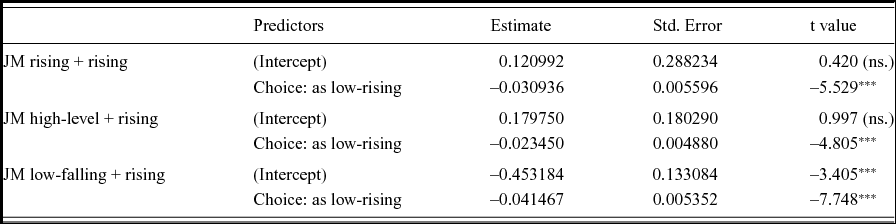
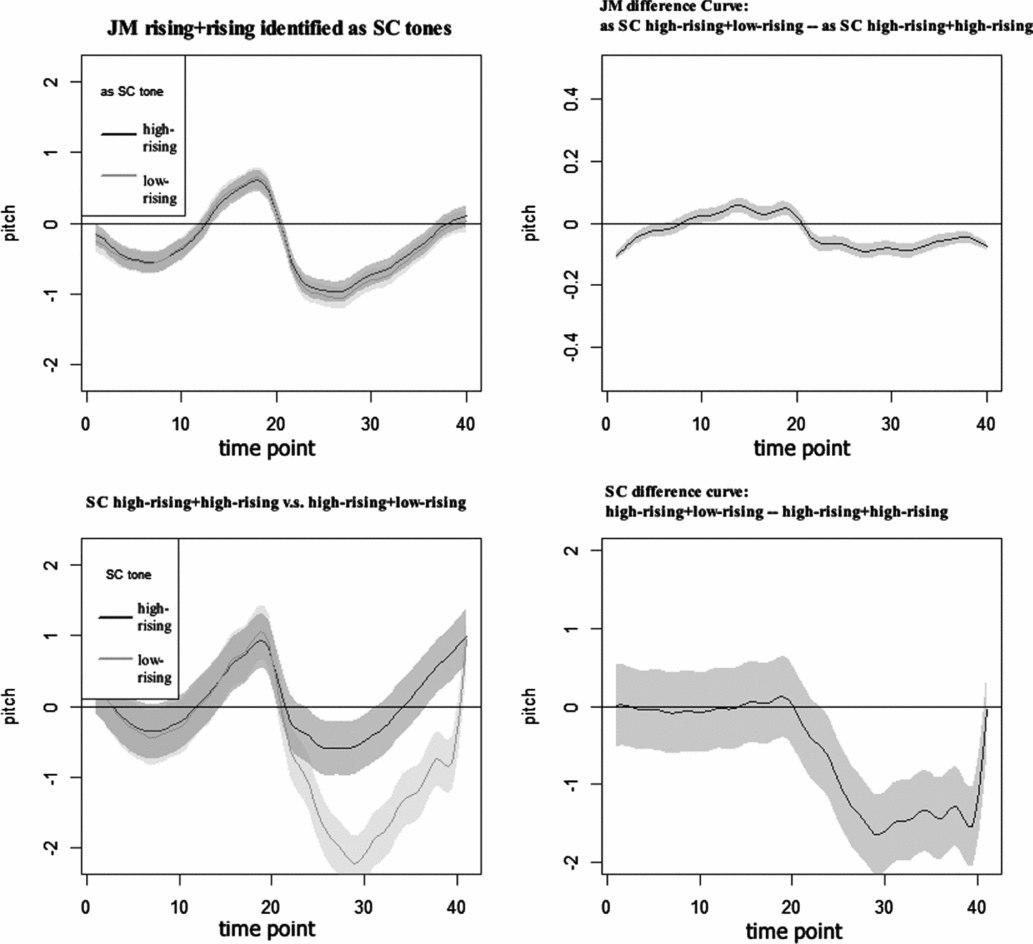
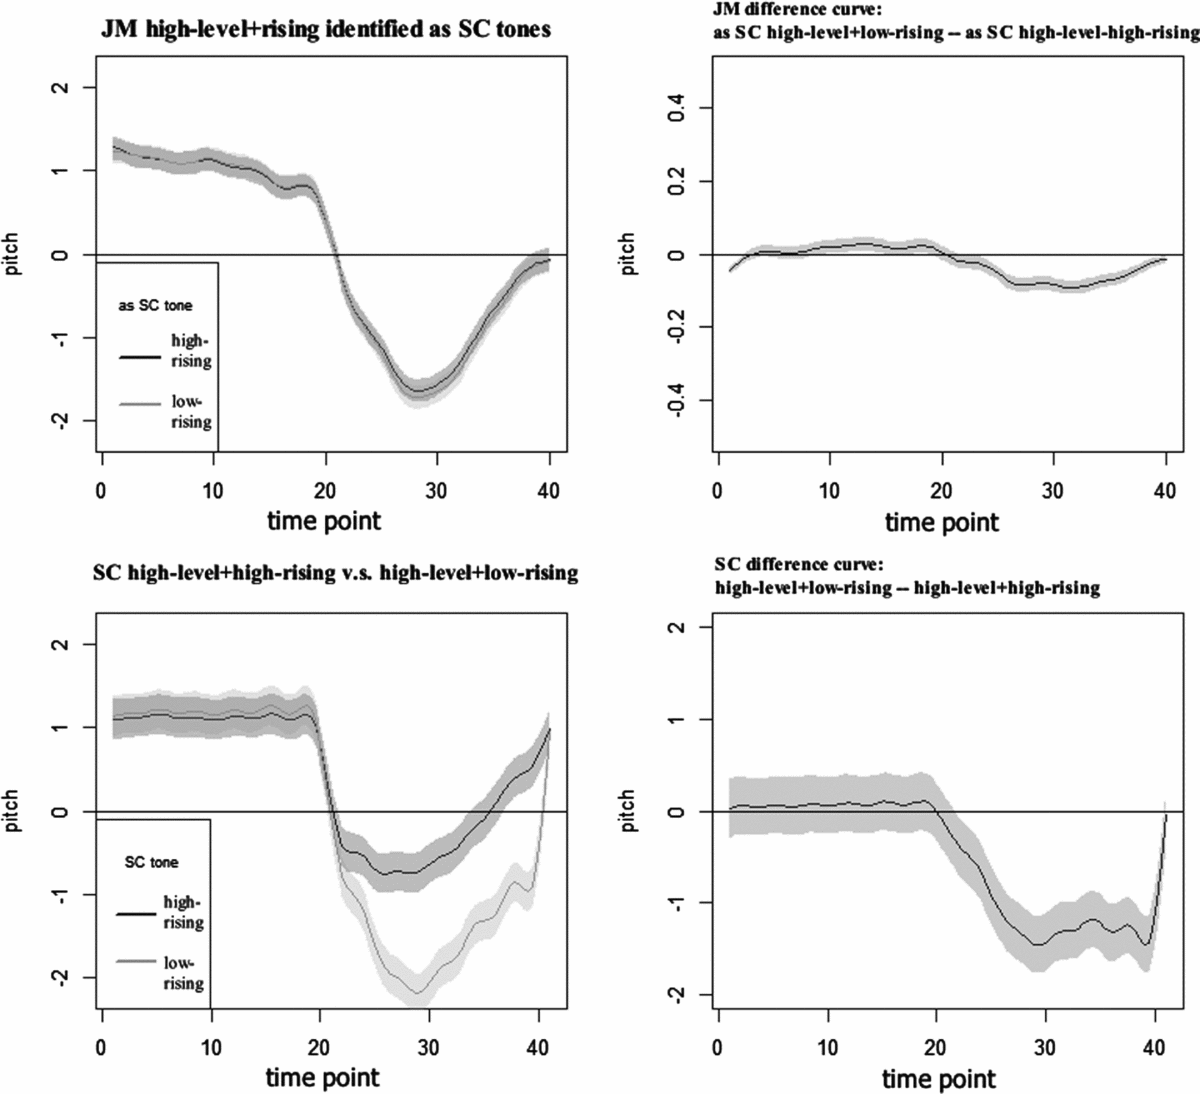
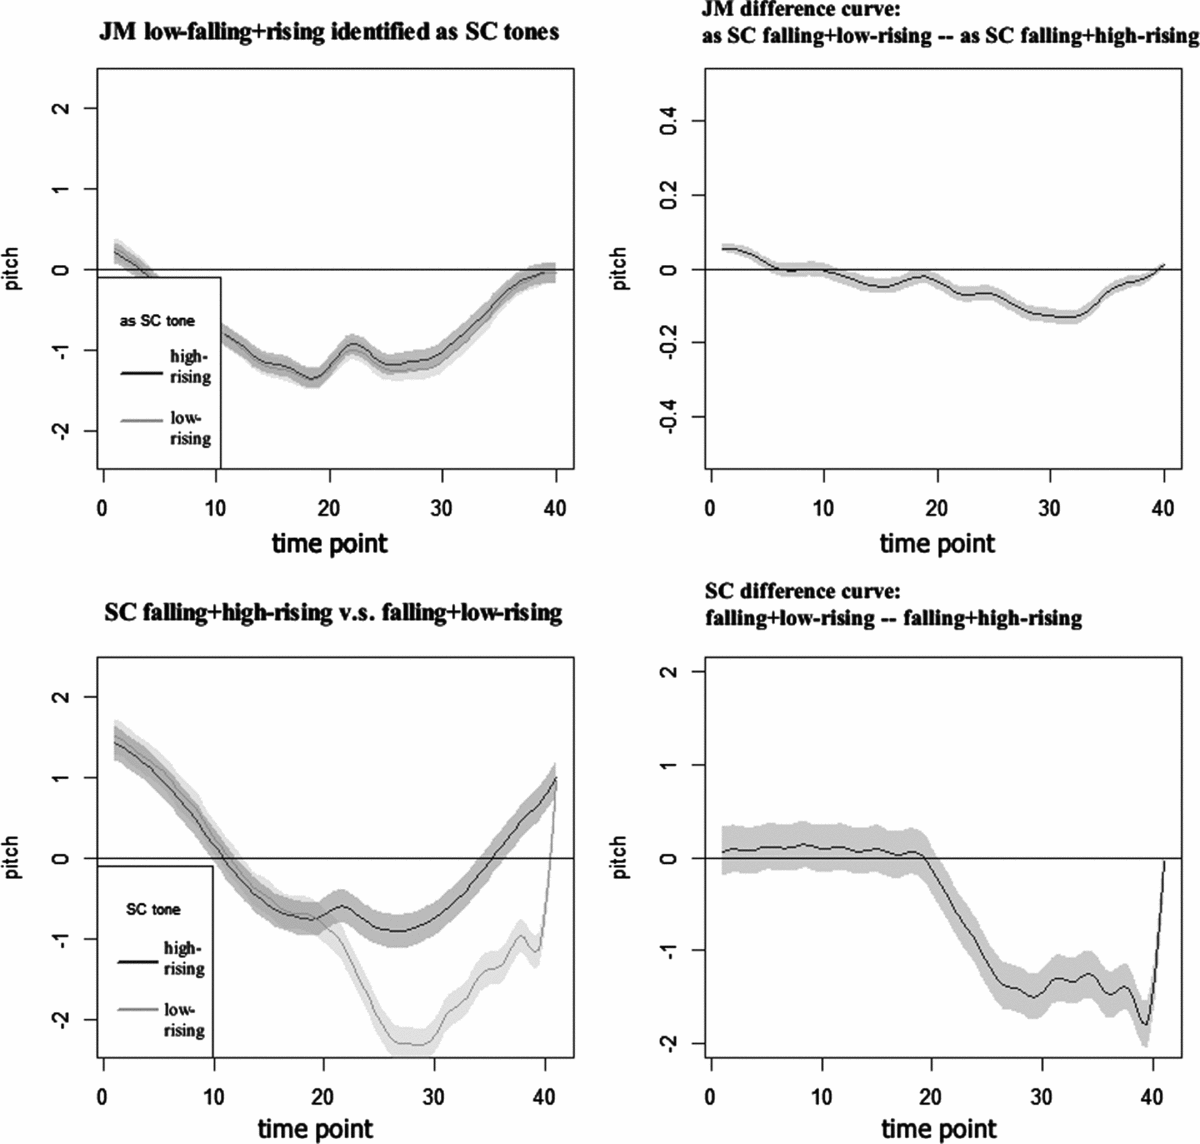
The fitted models accounted for 75% of the variance in the data of the JM rising + rising tonal combination, 86.5% of the variance in the data of the JM high-level + rising tonal combination, and 74% of the variance in the data of the JM low-falling + rising tonal combination. The coefficients for the parametric predictors are shown in Table 3. The numbers of degrees of freedom in the smooth terms and the associated F-statistics are shown in Table 4. The fitted pitch contours of the JM stimuli (identified as final high-rising and low-rising SC pseudo-words) are shown in the upper left panels of Figures 3–5.
Coefficients for the linear predictors in the generalized additive model fitted to Pitch of JM production-identification data (Experiment 2, **p < .01, *** p < .001).

Coefficients for the smooth terms in the generalized additive model fitted to Pitch of JM production-identification data (Experiment 2, *** p < .001).

Upper panels: estimated smoothes (left) and the corresponding difference curve (right) for JM final-rising words (JM rising + rising) identified as SC final-high-rising (SC high-rising + high-rising) and final-low-rising (SC high-rising + low-rising) pseudo-words. Lower panels: estimated smoothes (left) and the corresponding difference curve (right) for SC final-high-rising (SC high-rising + high-rising) and final-low-rising (SC high-rising + low-rising) pseudo-words.

Upper panels: estimated smoothes (left) and the corresponding difference curve (right) for JM final-rising words (JM high-level + rising) identified as SC final-high-rising (SC high-level + high-rising) and final-low-rising (SC high-level + low-rising) pseudo-words. Lower panels: estimated smoothes (left) and the corresponding difference curve (right) for SC final-high-rising (SC high-level + high-rising) and final-low-rising (SC high-level + low-rising) pseudo-words.

Upper panels: estimated smoothes (left) and the corresponding difference curve (right) for JM final-rising words (JM low-falling + rising) identified as SC final-high-rising (SC falling + high-rising) and final-low-rising (SC falling + low-rising) pseudo-words. Lower panels: estimated smoothes (left) and the corresponding difference curve (right) for SC final-high-rising (SC low-falling + high-rising) and final-low-rising (SC falling + low-rising) pseudo-words.

The corresponding differences of pitch contours are shown in the upper right panels of Figure 3, Figure 4, and Figure 5. They are significantly negative on the second syllable. JM final-rising words carrying relatively lower ending pitch contours were more likely to be identified as the final low-rising SC pseudo-words. The pitch height in the first syllable also slightly affects the interlingual tonal perception, in that the higher the previous pitch is, the more likely the word is to be identified as the final low-rising SC pseudo-word.
GAM models similar to those built in Experiment 1 yielded the plots for the SC pseudo-words in the lower panels of Figures 3, 4, and 5. As shown in these plots and the scattered contours in Figure 2, the SC final low-rising pseudo-words carry lower pitch contours on the second syllable. The shape of the difference curves is consistent with the difference curves from the perceptual data of JM real words shown in the upper panel, although the SC final low-rising pseudo-words do not always carry higher pitch contours on the first syllable for compensation.
A majority of the JM final rising stimuli were identified as SC final high-rising pseudo-words (86.2% for rising + rising, 72.8% for high-level + rising, 89.37% for low-falling + rising), indicating that JM rising tone maps better to SC high-rising than to SC low-rising. The asymmetry was more salient for the JM low-falling + rising stimuli. Although the general pitch register is different, the shape of the JM low-falling + rising combination is more similar to that of the SC falling + high-rising combination. It seems that the SC monolinguals’ identification of JM tones as SC tones is mostly based on the shape of the pitch contour.
Experiment 2 verified that the JM rising tone matches both the SC high-rising and low-rising tones in interlingual speech perception by naïve SC listeners, with a bias in favour of the mapping to the SC high-rising tone. The interlingual tonal identification is biased by the pitch height in the specific rendition of the word.
4. Experiment 3: bilingual semantic priming
With a new group of SC–JM bilinguals, Experiment 3 used the auditory lexical decision task and single-presentation semantic priming paradigm to investigate whether the two SC rising tones can both activate the tonal bilinguals’ JM lexical representations, and to what extent the interlingual category-goodness of the two SC tones influences JM lexical processing. The latter question involves two aspects, namely (1) whether the interlingual category-goodness affects JM lexical activation, and (2), if so, whether its effect lasts until the semantic activation. Accordingly, we analyzed the participants’ responses to both the primes and the targets: the primes were SC pseudo-words which sound like JM real-words [e.g., SC 绳银 /ʂəŋ in (high-rising + high-rising)/ and 绳引 /ʂəŋ in (high-risingg + low-rising)/ for JM 声音 “sound” /ʂəŋ in ([high-]rising + rising)/], related to aspect (1). The targets were JM semantic associates of the corresponding JM words of the primes [e.g., JM 图像 “video” /tʰu ɕiɑŋ (high-level-low-falling)/ for JM 声音 “sound”], related to aspect (2).
4.1 Participants
A new group of fifty-five native SC–JM tonal bilinguals from Jinan (15 male and 40 female, aged between 19 and 36 years, M = 23, SD = 3.85; 45 SC-dominant or balanced, 10 JM-dominant, measured in the same way as in Experiment 1) participated in this experiment in exchange for payment. All participants were right-handed, received their literacy educations in SC, and learned some English at school. Four participants had some knowledge of other non-tonal foreign languages, such as French and German. As in Experiment 1, before the experiment, all these participants also read aloud a small Chinese passage in both dialects to demonstrate their fluency.
Note that these SC–JM tonal bilinguals were all young participants, more homogeneous in their backgrounds than the bilingual participants in Experiment 1. Also, these young SC–JM bilinguals were different from the L2 learners in previous two-to-one mapping studies (Pallier et al., Reference Pallier, Colomé and Sebastián-Gallés2001; Cutler & Otake, Reference Cutler and Otake2004; Dufour et al., Reference Dufour, Nguyen and Frauenfelder2007), in that they were early bilinguals with very high proficiency in both dialects (reported mean SC proficiency of 7.98, SD = 1.37, and JM proficiency of 7.98, SD = 1.68, on a 0–10 scale).
4.2 Design and Stimuli
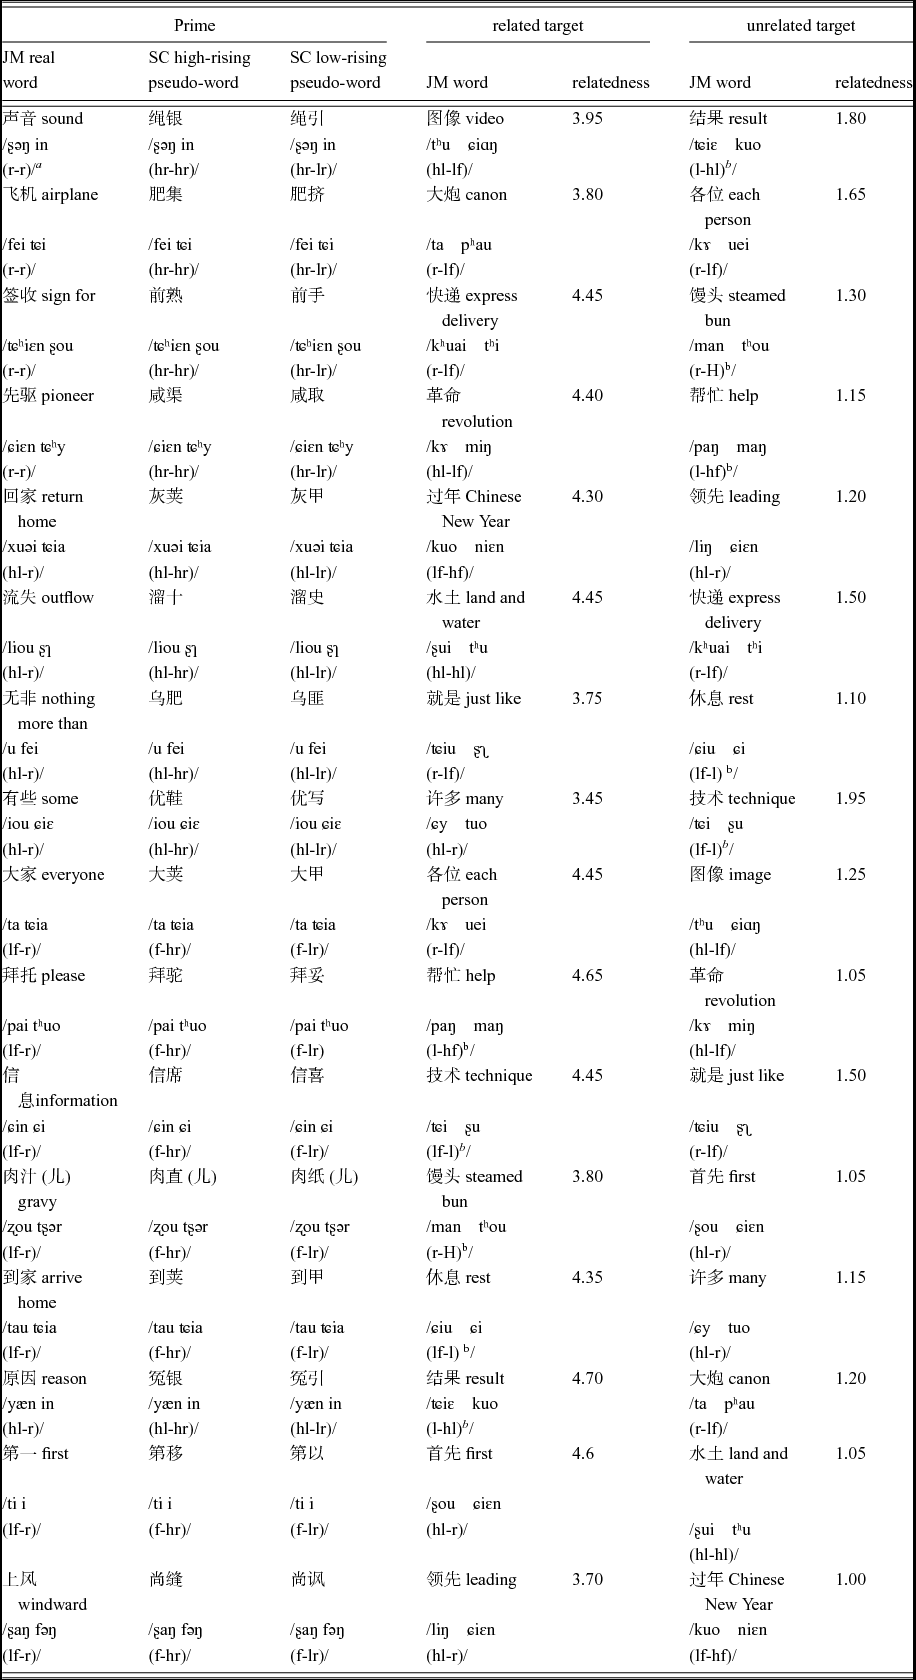
The present study adopted an auditory single-presentation semantic priming paradigm (McNamara & Altarriba, Reference McNamara and Altarriba1988; Shelton & Martin, Reference Shelton and Martin1992): a response was required for each stimulus, whether it was a prime or a target, word or non-word; the participants were not aware of the pairing. This arrangement was known to discourage post-response relatedness checking. For each JM real word, we used its related high-rising or low-rising SC pseudo-word as the prime, and its semantically related or unrelated associates as the target. All sets are shown in the Appendix together with the rated semantic relatedness.
The primes were the same SC pseudo-words as used in Experiments 1 and 2, but recorded again using the same bilingual voice as for the targets. To select semantically related targets, we adopted a practical criterion by combining the procedures used in earlier studies (Sumner & Samuel, Reference Sumner and Samuel2005; Thierry & Wu, Reference Thierry and Wu2007). First a printed list of Chinese words was presented to a group of 16 native SC speakers who did not participate in the earlier two experiments. They were instructed to write down a related word for each item. The instruction was: “Please write down the first word you think of when seeing this word.” One or two related targets were chosen for further selection based on the number of participants who wrote the given target as a response. Then we formed word-pairs by crossing these potential targets with the primes and the semantic relatedness of these word pairs were rated on a scale from 1 to 5 by a group of 20 native SC speakers, including some of the above-mentioned 16 native SC speakers and some new raters. One semantically related target and one semantically unrelated target were accordingly selected for each prime. The stimuli also included 32 JM non-words.
The crucial stimuli formed the test sets. Test sets were split into four lists, participants were also split into four groups, and the combination of Tonal Condition of the Prime (final high- or low-rising) and Semantic Relatedness (binarized as related or unrelated) were counterbalanced across the participants and test lists, so that each participant experienced every condition in the same number of trials and heard one prime and one target from each set.
The manipulation of semantic relatedness was only across test sets, neither between-target nor between-prime, so that the design controlled for the influence from the lexical factors (e.g., word frequency). The same sets of primes and targets were used, only forming different combinations for related and unrelated conditions (e.g., “sound” was the related prime for “video” but the unrelated prime for “result”; “video” was the related target for “sound” but the unrelated target for “everyone”).
A male native bilingual who is highly proficient in both dialects (also a trained phonetician with Putonghua Proficiency Test Certificates - Level1B) then produced these words and non-words accordingly in JM and SC.
4.3 Procedure
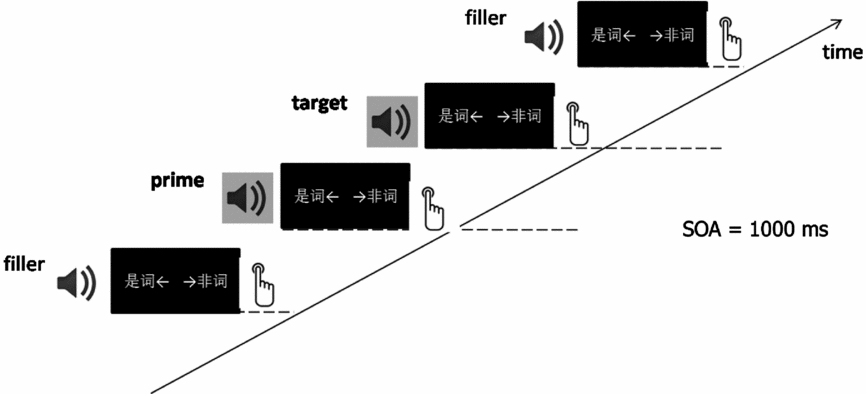
The procedure follows the classical single-presentation paradigm (McNamara & Altarriba, Reference McNamara and Altarriba1988; Shelton & Martin, Reference Shelton and Martin1992), but adapted to the auditory modality as shown in Figure 6. Participants were tested individually in a quiet room using the E-Prime software (Schneider et al., Reference Schneider, Eschman and Zuccolotto2002), told with a printed Chinese text and a JM audio clip that they would hear a series of sound sequences and that they were required to decide whether or not each of these sound sequences was a real word. Each item was played binaurally through headphones, with instructions on the screen. A new trial started 1,000 ms after the participant responded to the previous trial, or 1,000 ms after the response time exceeded 5 s. Reaction times were measured from the beginning of the trial. The prime and the target occurred subsequently. Different prime-target pairs were separated by one to three fillers. The crucial test was preceded by a practice block including 5 words and 5 non-words.
Procedure for Experiment 3. “非词” corresponds to “nonword” and “是词” corresponds to “word”.

4.4 Analysis and Results
Analysis 1 and Analysis 2 examined responses to the primes (SC pseudo-words) and to the targets (JM semantic associates) respectively. The primes were also analyzed because they reflect how interlingual category-goodness affects bilingual lexical access. When analyzing the targets, we presented results first for cases in which primes were accepted as JM words and then for cases in which the primes were rejected as non-words. The latter, without proper JM lexical activation, should show no semantic priming.
Analysis 1: Word-acceptance and reaction times to the primes
Whether each prime was accepted by the SC–JM bilinguals as a real JM word (word-acceptance) and the corresponding reaction times (RT) were analyzed for the effect of interlingual category-goodness (final high-rising versus final low-rising primes) in lexical access, using logistic and Gaussian Linear Mixed Effect models respectively (Bates, Maechler, Bolker & Walker, Reference Bates, Maechler, Bolker and Walker2013; R Core Team, 2013). The models included Tonal Condition of the Prime (final high-rising/final low-rising) as the fixed predictors, as well as by-participant and by-prime random intercepts, intercepts by the prime-related JM real-word (i.e., the first column of the Appendix), and by-prime random intercepts nested under the related JM real word as the candidates for the random terms. Possible random slopes were also tested. The structure of the random terms in the models reported here was selected via model comparison based on likelihood ratio tests.
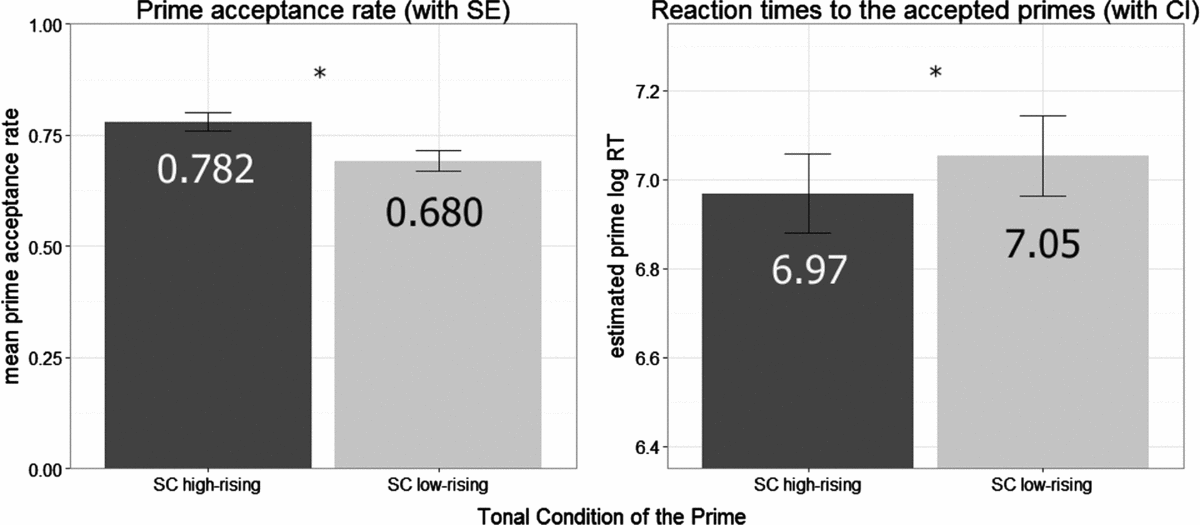
Logistic Linear Mixed Effect models were built for the binominal word-acceptance data. The selected random predictors were by-participant and by-JM-word random intercepts, χ2 1|participant = 15.09, p 1|participant < 0.001, χ2 1|JM-word = 242.82, p 1|JM-word < 0.001. Likelihood-ratio tests (Singmann, Reference Singmann2014) showed that the main effect of Tonal Condition of the Prime was significant, FTonal-Condition-of-the-Prime (1) = 13.15, p < 0.0001. Post-hoc Least Squares Means analysis showed that, compared with the final low-rising primes, the final high-rising primes were significantly more likely to be accepted as words.
As shown in the left panel of Figure 7, the probability that a SC pseudo-word was accepted by the bilinguals as a real JM word (word-acceptance rate) was above 50% for both final high-rising and low-rising primes (rate high-rising-prime = 78.18%, rate low-rising-prime = 67.95%).
Responses to the primes split with the Tonal Condition of the Prime (SC high-rising and SC low-rising). Left panel: Prime acceptance rates (0-1) with standard errors; right panel: mean (estimated) lexical decision times (RT in natural logarithm, ms) with confidence intervals for the primes.

Linear Mixed Effect models were built for the reaction times to the primes. Only the primes which were accepted as words were considered. The reaction times were natural-log-transformed to improve the distribution of the data. In the following analysis, a model was fit with all the data points, and then a model criticism removed the data points with standardized residuals exceeding 2.5 standard deviation units from the data set (less than 2.5% of the data) and refitted the model with the trimmed data set. We report the model statistics from the trimmed models, with Satterthwaite approximation for degrees of freedom (Kuznetsova, Brockhoff & Christensen, Reference Kuznetsova, Brockhoff and Christensen2013).
Models were built for the reaction times to the primes which were accepted as real words. The selected random predictors were by-participant and by-JM-word random intercepts, χ2 1|participant = 49.21, p 1|participant < 0.001, χ2 1|related-JM real-word =207.40, p 1|related-JM real-word < 0.001. As shown in the right panel of Figure 7, the main effect of Tonal Condition of the Prime was significant, FTonal-Condition-of-the-Prime (df = 496.27) = 39.31, p < 0.001. Compared to the final low-rising primes, the final high-rising primes were accepted more quickly.
Both final high-rising and low-rising SC pseudo-words were at times accepted as JM real words, although the final high-rising pseudo-words were more quickly and more likely to be accepted.
Analysis 2: Accuracies and reaction times to the targets
Targets were analyzed for the effect of priming and how interlingual category-goodness affects semantic activation. The responses to the targets were influenced by more factors than the primes. We built Linear Mixed Effect models for the accuracy and RT data (Bates et al., Reference Bates, Maechler, Bolker and Walker2013; R Core Team, 2013), including Tonal Condition of the Prime (final high-rising/final low-rising), Semantic Relatedness (related/unrelated), and their interactions as the fixed predictors. The analysis of accuracies also included whether or not the primes were accepted as real words. Reaction times to the targets preceded by accepted and rejected primes were analyzed separately. The candidates for the random terms included by-participant and by-target random intercepts and by-prime random intercepts nested under the related JM real word, as well as possible random slopes. The structure of the random terms in the models was selected via model comparison based on likelihood ratio tests.
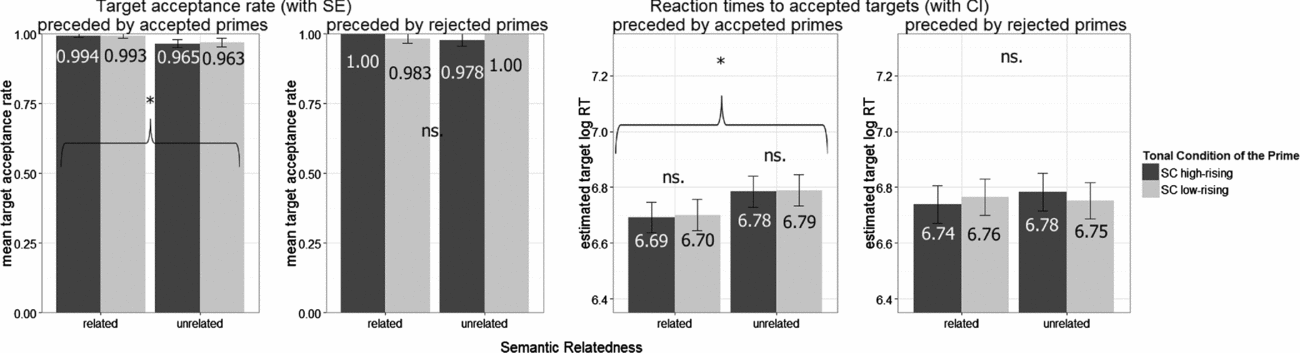
For the binominal accuracy data, Logistic Linear Mixed Effect models selected by-target random intercepts as random predictors, χ2 1|target = 3.18, marginally significant (p = 0.07). However, none of the fixed predictors was significant. This is probably due to the ceiling effect of accuracy: following rejected primes, almost all the targets were correctly accepted as words. Nevertheless, after a separate model for the targets preceded by accepted primes was built, parametric bootstraps (Singmann, Reference Singmann2014) showed that the main effect of Semantic Relatedness was significant, Fsemantic-relatedness = 4.33, p < 0.05, while the main effect of Tonal Condition of the Prime, Ftonal-condition-of-the-prime = 0.02, n.s., and the interaction of Tonal Condition of the Prime and Semantic Relatedness, Finteraction = 0.12, n.s, were still insignificant. As shown in the first plots of Figure 8, compared with the semantically unrelated targets, the semantically related targets showed significantly higher accuracy rates, when preceded by accepted primes.
Responses to the JM real words targets semantically related to the JM words hinted by the SC pseudo-words, split with the Tonal Condition of the Prime (colour) and the Semantic Relatedness between the prime and the target (cluster), and whether the preceding SC prime was accepted as a JM real word (subplot). Left panels: target acceptance rates (0-1) with standard errors; right panels: mean (estimated) lexical decision times (RT in natural logarithm, ms) with confidence intervals for the primes.

Linear Mixed Effect models were built for the RTs to the targets. Only correct responses to the targets were considered and the RTs were natural-log-transformed to improve the distribution of the data. Model criticisms similar to those carried out in Analysis 1 were performed.
The first models were built for the responses collected after the corresponding primes were identified as real JM words. The selected random predictors were by-participant, by-related-JM real words, and by-target random intercepts, χ2 1|participant = 124.88, p 1|participant < 0.001, Χ2 1|related-JM real-word = 7.98, p 1|related-JM real-word < 0.01, χ2 1|target = 42.73, p 1|target < 0.001. As shown in the middle panel of Figure 8, the main effect of Semantic Relatedness was significant, FSemantic-Relatedness (df = 473.06) = 57.34, p < 0.001. However, the main effect of Tonal Condition of the Prime, FTonal-Condition-of-the-Prime (df = 470.07) = 0.32, n.s., and the interaction of Tonal Condition of the Prime and Semantic Relatedness, Finteraction (df = 463.16) = 0.016, n.s, were insignificant. Compared to the semantically unrelated targets, the semantically related targets were processed faster.
The second models were built for the responses collected after the corresponding primes were rejected as non-words. The selected random predictors were by-participant and by-target random intercepts, χ2 1|participant = 49.75, p 1|participant < 0.001, χ2 1|target = 61.10, p 1|target < 0.001. However, as shown in the right panel of Figure 8, none of the fixed predictors was significant, FTonal-Condition-of-the-Prime (df =149.32) = 0.03, n.s., Fsemantic-relatedness (df = 158.57) = 0.46, n.s., Finteraction (df = 142.87) = 2.92, marginally significant (p = 0.90). The RT was slightly reduced for the semantically related targets primed by final high-rising pseudo-words, although the difference was insignificant.
Both final high-rising and final low-rising SC pseudo-words primed the targets which are semantically related to the JM real words hinted by the primes. The semantic priming effect was only salient when the SC pseudo-word primes were accepted as real JM words by the bilinguals. The interlingual category-goodness did not affect the magnitude of priming, as indexed by the accuracies and RTs to the targets.
5. Discussion and Conclusion
5.1 Main results and interpretation
After verifying the two-to-one mapping in acoustics and perception without the influence from tonal bilingualism in the previous two experiments, Experiment 3 tested SC–JM bilinguals’ auditory lexical decision of SC pseudo-words as JM real words, as well as their semantic priming effects on JM real words, which answered the three research questions regarding the effect of asymmetrical two-to-one tonal mapping in lexical processing.
Experiment 1 verified that the acoustic distribution of JM rising tone largely overlaps with both SC high- and low-rising tones, but more with the high-rising one (as shown in Figure 2).
Experiment 2 verified that SC native monolinguals can perceive the JM rising tone as either the SC high- or low-rising tone, with a bias in favor of the high-rising tone (also influenced by the preceding pitch). The interlingual perception is sensitive to the relative pitch height: higher JM pitch contours are more likely to be identified as the SC high-rising tone.
In the JM lexical decisions of Experiment 3, the majority of both the final high-rising and low-rising SC words were accepted as JM real words. Thus, both SC tones can activate JM lexical nodes. Final high-rising SC pseudo-words were more likely and more quickly to be accepted as real JM words. Thus, the acoustic and perceptual asymmetry also persists in interlingual lexical access. As long as the prime was accepted as a JM real word, it primed the semantically related target. However, whether the prime carried high-rising or low-rising tone made no difference in semantic priming. Thus, the asymmetry only exists in lexical access but not in the corresponding semantic activation.
5.2 Theoretical implications
The acoustic distribution of the JM rising tone overlaps with that of both SC rising tones (Experiment 1). The JM rising tone can also be perceived as both SC rising tones by SC tonal monolinguals (Experiment 2). This is consistent with the previous findings that one segmental phoneme in one language can match two different phonemes in the other language (Bohn & Flege, Reference Bohn and Flege1990; Best & Strange, Reference Best and Strange1992; Flege et al., Reference Flege, Bohn and Jang1997; Iverson et al., Reference Iverson, Kuhl, Akahane-Yamada, Diesch, Tohkura, Kettermann and Siebert2003; Aoyama et al., Reference Aoyama, Flege, Guion, Akahane-Yamada and Yamada2004).
The perceptual asymmetry in two-to-one interlingual mapping exists in tones, not only in vowels (Bohn & Flege, Reference Bohn and Flege1990; Flege et al., Reference Flege, Bohn and Jang1997) and consonants (Iverson et al., Reference Iverson, Kuhl, Akahane-Yamada, Diesch, Tohkura, Kettermann and Siebert2003; Aoyama et al., Reference Aoyama, Flege, Guion, Akahane-Yamada and Yamada2004). The asymmetry in tonal mapping has acoustic basis and perceptual effects, just as in segmental mapping.
The pitch height of the previous syllable serves as a reference in interlingual tonal perception (Experiment 2). This is in line with what was found in both acoustic pitch perception and monolingual tonal perception (Leather, Reference Leather1983; Lin & Wang, Reference Lin and Wang1984; Fox & Qi, Reference Fox and Qi1990; Moore & Jongman, Reference Moore and Jongman1997; Wong & Diehl, Reference Wong and Diehl2003; Wu, Reference Wu2011).
The canonical realizations of the SC high- and low-rising tones can both be accepted as the JM rising tone in lexical access. Thus, two physical stimuli belonging to different tonal categories in SC can be captured by the same tonal category in JM lexical processing. Previous findings indicated that the L2 vowels and consonants are captured by the native phonemic categories in lexical access (Weber & Cutler, Reference Weber and Cutler2004; Cutler et al., Reference Cutler, Weber and Otake2006). The current finding, however, clarified that the SC–JM early bilinguals do not store the JM rising tone with the same representation as the SC high-rising tone. Instead, the one JM and the two SC rising tones are represented differently in the bilingual mental lexicon, although their acoustic specifications can be highly overlapping.
The tonal asymmetry also affects how the tonal representations activate lexical representations. Since the distributional center of the SC high-rising tone is closer to that of the JM rising tone, it is not surprising to find that the final high-rising SC pseudo-words activate the corresponding JM real words more readily and more quickly. The tonal asymmetrical mapping has a similar effect as that reported in previous studies on consonantal and vowel asymmetrical mapping in interlingual lexical access (Weber & Cutler, Reference Weber and Cutler2004; Reference Weber and Cutler2006; Escudero et al., Reference Escudero, Hayes-Harb and Mitterer2008).
The current study further distinguished the effect of phonetic asymmetry in interlingual lexical activation and that in semantic activation, using a semantic priming paradigm. The lexical access of JM real words via SC pseudo-words was asymmetrical and influenced by interlingual category-goodness. However, when priming JM real words with SC pseudo-words, the semantic priming effect is symmetric and not affected by the interlingual category-goodness. Although it is strongly supported in the previous studies that the phonological and semantic activations happen in parallel in speech comprehension (Marslen-Wilson & Welsh, Reference Marslen-Wilson and Welsh1978; Grosjean, Reference Grosjean1980; Marslen-Wilson, Reference Marslen-Wilson, Bouma and Bouwhuis1984; Zwitserlood, Reference Zwitserlood1989; Van Petten, Coulson, Rubin, Plante & Parks, Reference Van Petten, Coulson, Rubin, Plante and Parks1999; O'Rourke & Holcomb, Reference O'Rourke and Holcomb2002; Rodriguez-Fornells et al., Reference Rodriguez-Fornells, Schmitt, Kutas and Münte2002), the steps of lexical activation and semantic activation should be independent to some extent, because the lexical stage (responses to the primes) and semantic stage (responses to the targets) showed different sensitivities to the phonetic asymmetry.
Knowing that SC and JM translation equivalents are phonologically similar and under the assumption of an integrated bilingual lexicon, the SC pseudo-word stimuli, beside activating the JM real-words, could also activate the SC cognates of these JM real-words, due to the segmental similarity between SC and JM translation equivalents (Lee, Reference Lee2007; Sereno & Lee, Reference Sereno and Lee2015). However, in Experiment 3, the primes rejected as real JM words also segmentally matched the SC cognates of the hinted JM real words but caused no semantic priming. This suggests that the activation of the corresponding SC words, if present, was limited to the stage before semantic activation. Also, note that even if the SC cognates were activated, the asymmetry in lexical access should not be attributed to SC activation because the segmental sharing was held the same across all the conditions. In sum, it is not necessary to assume that the SC cognates of the hinted JM real words mediated the activation of the primes.
5.3 Limitations
The present study has several limitations, addressed in the following paragraphs.
First, the SC high-rising tone has an earlier turning point (Moore & Jongman, Reference Moore and Jongman1997; Wu, Reference Wu2012) and a shorter duration (Blicher, Diehl & Cohen, Reference Blicher, Diehl and Cohen1990) than the SC low-rising tone. This may be an additional cause for the faster responses to the final high-rising SC pseudo-words in Experiment 3. Further studies involving other tones are necessary to evaluate the influence of duration and turning point. Nevertheless, the asymmetry found in Experiment 3 should probably still be attributed to the difference in interlingual category-goodness. On the one hand, SC high-rising and low-rising tones, unlike the other two SC tones, did not differ in isolating points in a perceptual gating experiment (Lai & Zhang, Reference Lai and Zhang2008), suggesting against the direct influence from duration and turning point. On the other hand, the final high-rising SC pseudo-words showed higher word-acceptance rates, which can only be attributed to their better interlingual category-goodness. The delay of turning point, even taking effect on reaction time, should not have affected the word-acceptance rate.
Second, since not many words fulfilled all the criteria (as described in the session 4.2) for selecting the stimuli, Experiment 3 did not control for both associative relatedness and semantic similarity. For example, coat and rack have high associative relatedness but low semantic similarity, while radish and carrot have low associative relatedness but high semantic similarity (Thompson-Schill, Kurtz & Gabrieli, Reference Thompson-Schill, Kurtz and Gabrieli1998).Footnote 6 Sharing either aspect alone could trigger priming (e.g., Seidenberg, Waters, Sanders & Langer, Reference Seidenberg, Waters, Sanders and Langer1984; Shelton & Martin, Reference Shelton and Martin1992), though the effect may vary with different designs and tasks (Seidenberg et al., Reference Seidenberg, Waters, Sanders and Langer1984; McNamara & Altarriba, Reference McNamara and Altarriba1988; Shelton & Martin, Reference Shelton and Martin1992; Thompson-Schill et al., Reference Thompson-Schill, Kurtz and Gabrieli1998). In the present study, the semantic relatedness was assessed with an instruction based on the associative relatedness. Thus, although some sets were low in semantic similarity (e.g., sign for – express delivery), most priming sets involved comparable associative relatedness.Footnote 7 Moreover, the single-presentation semantic priming paradigm is primarily sensitive to associative relatedness (McNamara & Altarriba, Reference McNamara and Altarriba1988; Shelton & Martin, Reference Shelton and Martin1992). The results were hence probably not severely affected by the difference of semantic similarity across the priming sets.
Third, the design cannot answer whether bilingual knowledge of the SC-to-JM tonal MAPPING was activated in bilingual lexical access. The findings support that bilinguals can process the same tonal realization differently depending on the target language (Antoniou et al., Reference Antoniou, Tyler and Best2012). Thus the SC tonal representations were at least partially neglected during JM lexical access. However, further studies need to compare the SC–JM bilinguals’ responses with the JM monolinguals’ responses to reveal the usage of interlingual tonal mapping knowledge in this process.
Finally, note that SC and JM are closely related Chinese dialects, which makes their relation, strictly speaking, inter-dialectal. Nevertheless, this fact should not prevent the generalization of the current findings to pairs of more remote languages (e.g., Thai–Chinese bilingualism), so long as both languages use lexical tones and have similar tonal categories, since the manipulation is based on tonal inventories. That is why the terms ‘interlingual’ and ‘bilingual’ were used instead of ‘inter-dialectal’ and ‘bi-dialectal’ in this article.
5.4 Conclusion
To sum up, the current study investigated two SC rising tones and one JM rising tone, forming a two-to-one interlingual tonal mapping in speech production, perception, and lexical access. In speech production and speech perception, the JM rising tone overlaps with both SC rising tones; in lexical access, both SC rising tones can activate JM real words via SC pseudo-words. This supports the theoretical claim that the tonal acoustic space can be divided in an overlapping way in bilingual lexical access and the acoustic input is captured by the native tonal categories. Nevertheless, the interlingual mapping is asymmetrical in production and perception. The asymmetry affects SC–JM bilinguals’ interlingual lexical access but not the subsequent semantic activation. This suggests some independence in the step between lexical activation and semantic activation.
Supplementary Material
For supplementary material accompanying this paper, visit http://dx.doi.org/10.1017/S1366728916000493
Crucial Stimuli