Introduction
The grapevine is among the most abundant perennial crops worldwide, covering over 7 million hectares and spanning all the continents except Antarctica. Although it is grown in temperate and tropical regions ranging from 50°N to 43°S, the highest concentration of vineyards is to be found in Europe. The optimum conditions for growth and development prevail in regions with dry summers and cold winters, which allow the plant's dormancy requirements to be met (Hidalgo, Reference Hidalgo2002; Ocete et al., Reference Ocete, Cantos, López-Gallardo, Pérez-Troncoso, Lara, Failla, Ferragut and Liñán2007). Spain has the largest surface area of vineyards, accounting for 0.14 of the world total, but is the world's third largest producer of wine grapes (OIV, 2015).
Climate is one of the factors most affecting wine production (Fernández-González et al., Reference Fernández-González, Rodriguez-Rajo, Jato, Aira, Ribeiro, Oliveira and Abreu2012); meteorological variables such as temperature and rainfall directly affect grapevine phenology (Kishino and Marur, Reference Kishino, Marur, Kishino, de Carvalho and Roberto2007; Fernández-González et al., Reference Fernández-González, Rodríguez-Rajo, Escuredo and Aira2013; Parker et al., Reference Parker, de Cortázar-Atauri, Chuine, Barbeau, Bois, Boursiquot, Cahurel, Claverie, Dufourcq, Gény, Guimberteau, Hofmann, Jacquet, Lacombe, Monamy, Ojeda, Panigai, Payan, Lovelle, Rouchaud, Schneider, Spring, Storchi, Tomasi, Trambouze, Trought and van Leeuwen2013). Knowledge of crop phenology is of great value since it enables cropping practices to be rationalized and optimized (Mandelli et al., Reference Mandelli, Tonietto, Camargo and Czermainski2004; Fernández-González et al., Reference Fernández-González, Rodriguez-Rajo, Jato, Aira, Ribeiro, Oliveira and Abreu2012). Comparison of data for cultivars growing in different areas also enables assessment of their capacity to adapt to varying environmental conditions and therefore estimate their potential range (Piña and Bautista, Reference Piña and Bautista2004; Parker et al., Reference Parker, de Cortázar-Atauri, Chuine, Barbeau, Bois, Boursiquot, Cahurel, Claverie, Dufourcq, Gény, Guimberteau, Hofmann, Jacquet, Lacombe, Monamy, Ojeda, Panigai, Payan, Lovelle, Rouchaud, Schneider, Spring, Storchi, Tomasi, Trambouze, Trought and van Leeuwen2013).
Vitis vinifera L. is mainly wind-pollinated, although its particular floral morphology also allows self-pollination (Kamel, Reference Kamel1959); the frequency of each type of pollination depends partly on the grape variety concerned.
A number of studies have shown that airborne Vitis pollen concentrations provide an indirect measure of pollination and can be used as a variable when predicting final crop outcomes (Fernández-González et al., Reference Fernández-González, Escuredo, Rodríguez-Rajo, Aira and Jato2011; Cunha et al., Reference Cunha, Ribeiro and Abreu2016). Since the 1990s, this technique has been used widely to forecast output for other major commercial crops in the Mediterranean area, including olive (Galan et al., Reference Galán, Vázquez, García-Mozo and Domínguez2004; Oteros et al., Reference Oteros, Orlandi, García-Mozo, Aguilera, Dhiab, Bonofiglio, Abichou, Ruiz-Valenzuela, Mar del Trigo, de la Guardia, Domínguez-Vilches, Msallem, Fornaciari and Galán2014). The joint use of samplers of different kinds, for example, volumetric in conjunction with passive samplers, may provide more reliable data for certain locations (Belmonte et al., Reference Belmonte, Canela and Guàrdia2000; West and Kimber, Reference West and Kimber2015). Passive samplers have been used in Mexico, in 17 US states and in Canada for fungal spore sampling (Kelly et al., Reference Kelly, Dufault, Walker, Isard, Schneider, Giesler, Wright, Marois and Hartman2015).
During the current study, airborne Vitis pollen concentrations and phenological behaviour were measured in order to achieve the following aims: (1) to compare observed phenological stages for grapevine cultivars and vineyards at different locations within the Montilla-Moriles Protected Designation of Origin (PDO) area; (2) to analyse the relationship between Vitis pollen concentration, phenological observations and weather-related parameters in the PDO area; and (3) to test for possible differences between volumetric and passive samplers located at several sites in the PDO area.
Materials and methods
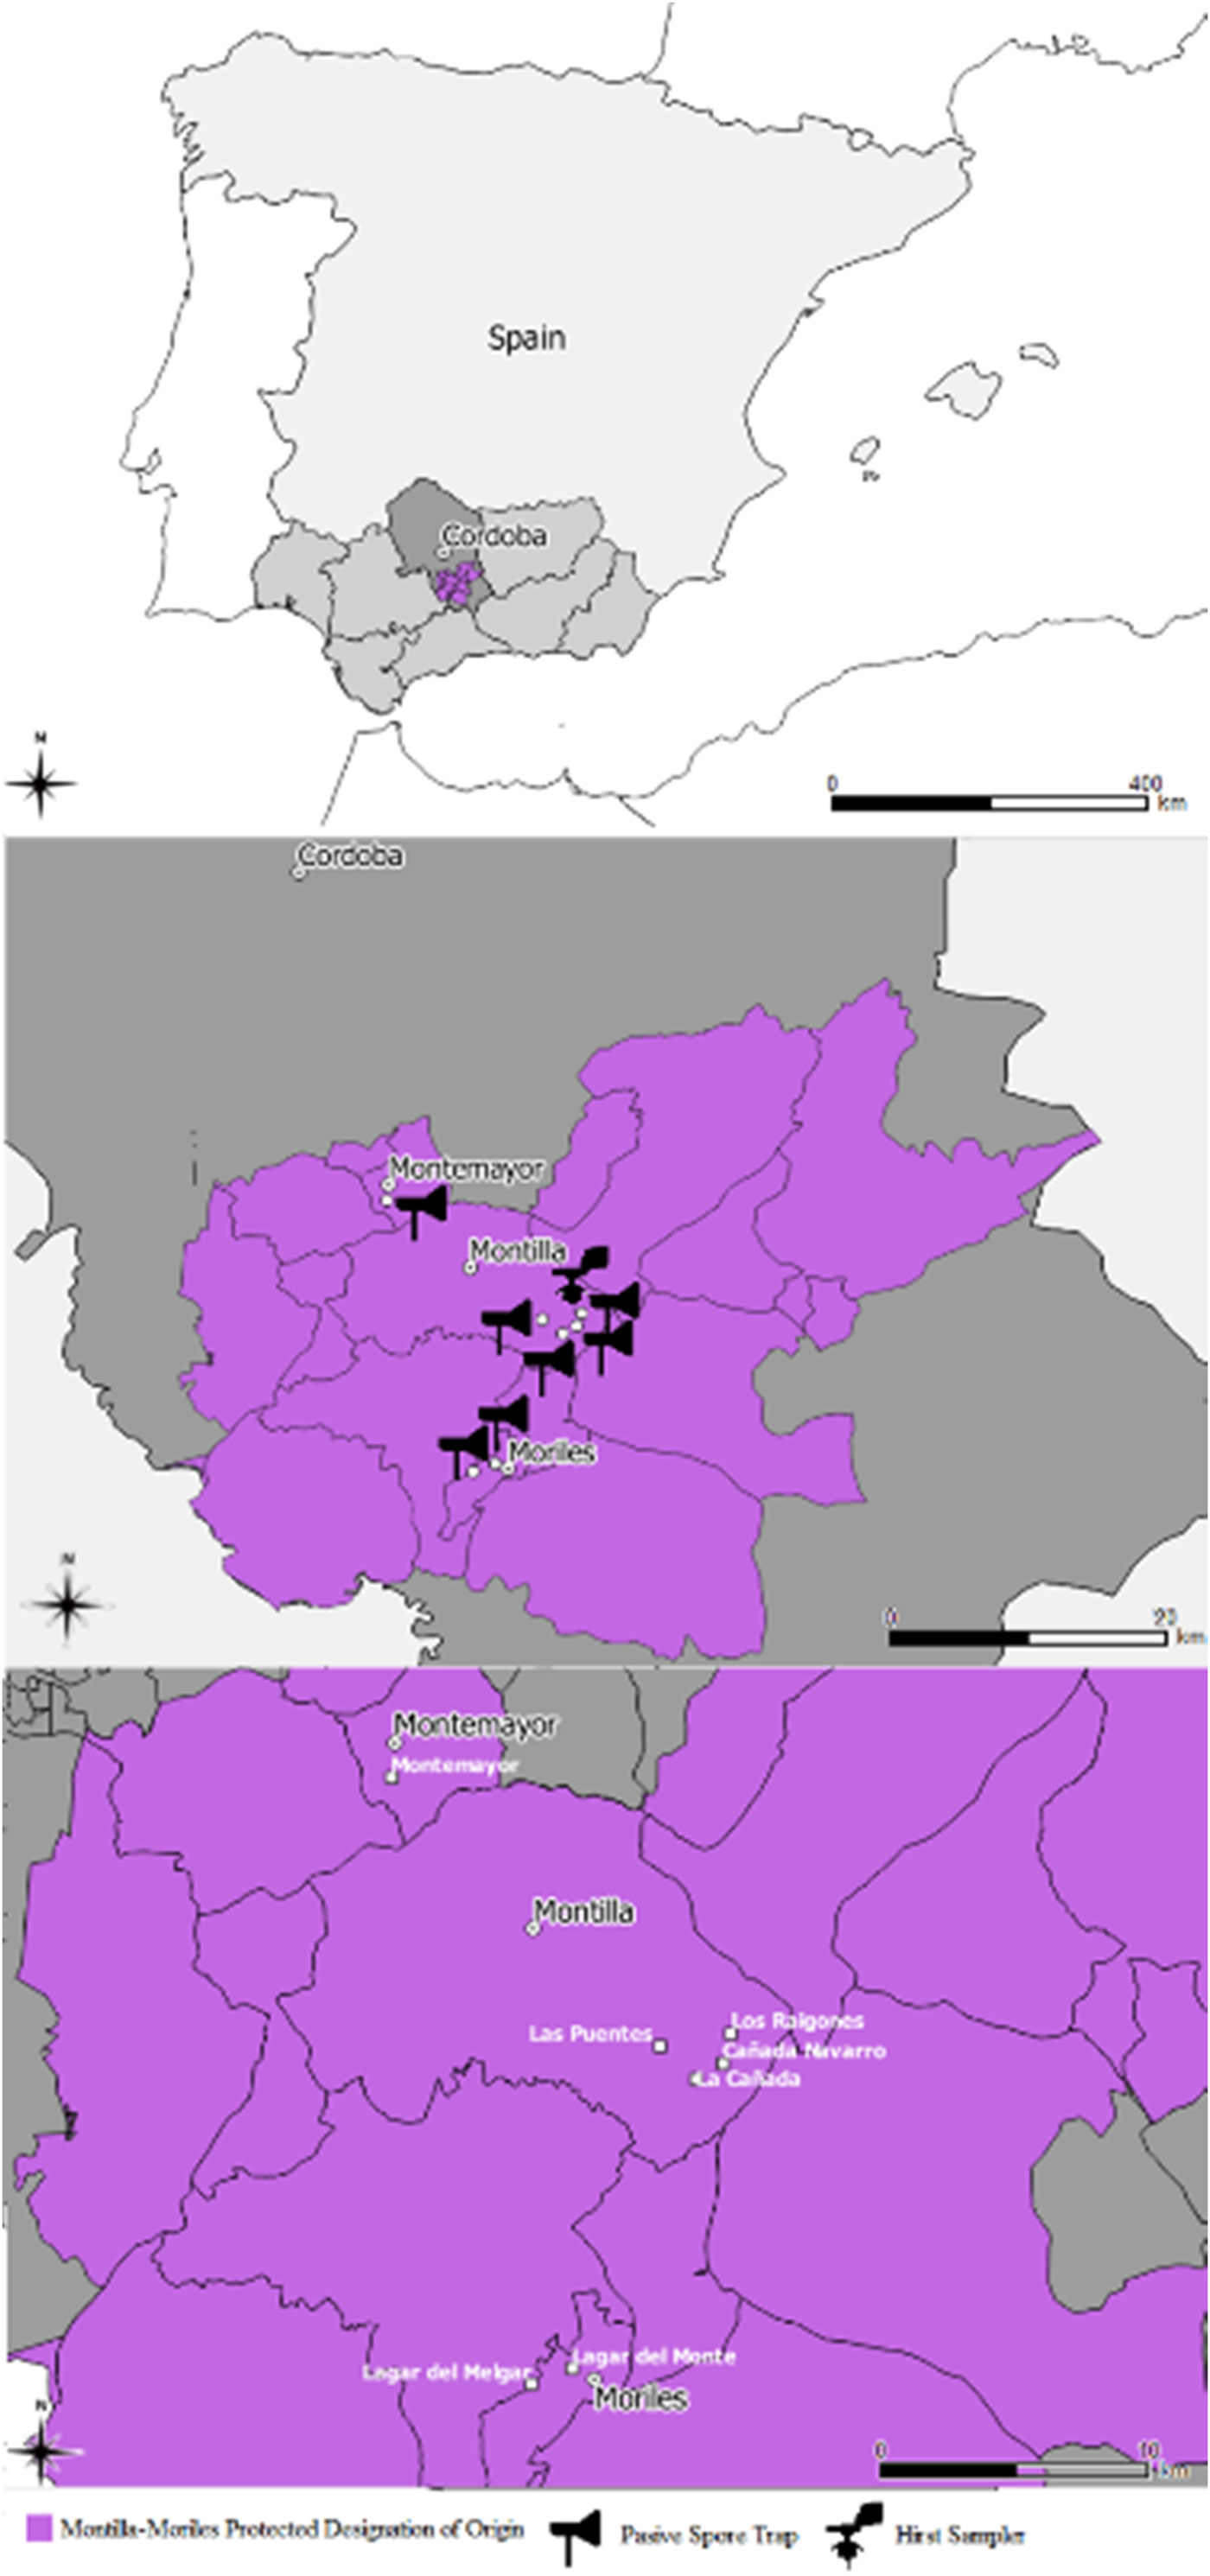
The current study was carried out in seven vineyards within the Montilla-Moriles PDO area (Fig. 1). This area is located in the south of Córdoba province (southern Spain), in the vicinity of the two main towns, Montilla and Moriles. The area has a Thermo-Mediterranean climate with hot, dry summers. Soils in most of the study area are predominantly white sandy loams, known locally as ‘albariza’ (whitish), with intercalations of calcarenite, and white or cream-coloured marls; these soils occupy much of the surface of the Sierra de Montilla (Álvarez et al., Reference Álvarez, Moreno, Jos, Cameán and González2007).
Location of Montilla Moriles Protected Designation of Origin and samplers used in the study.
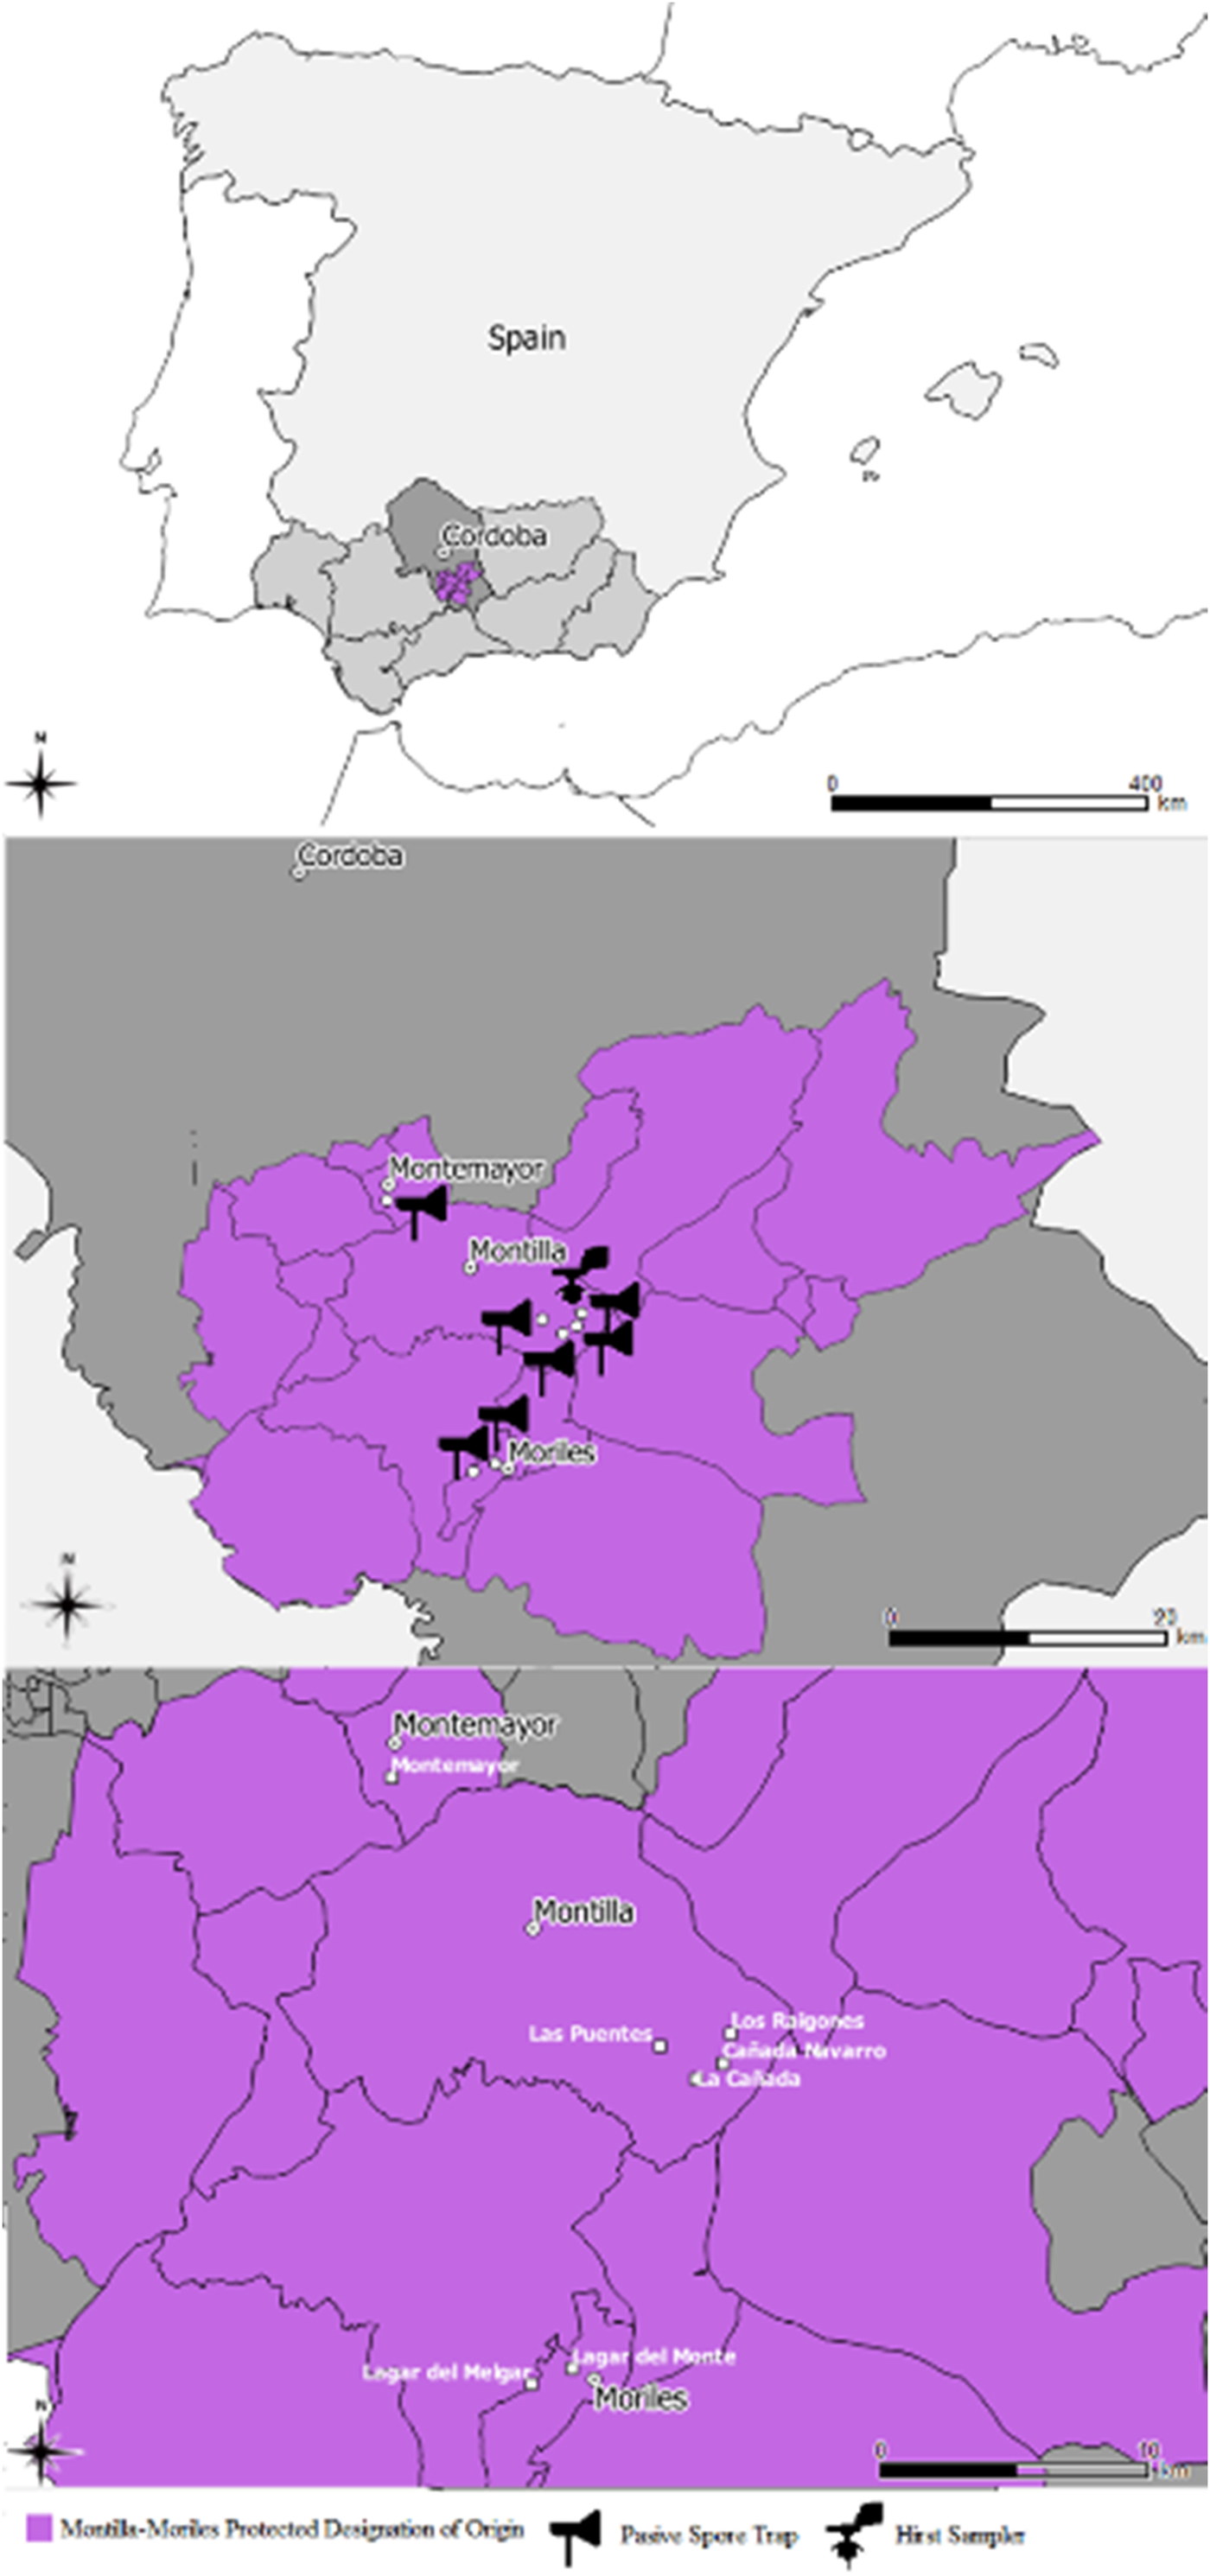
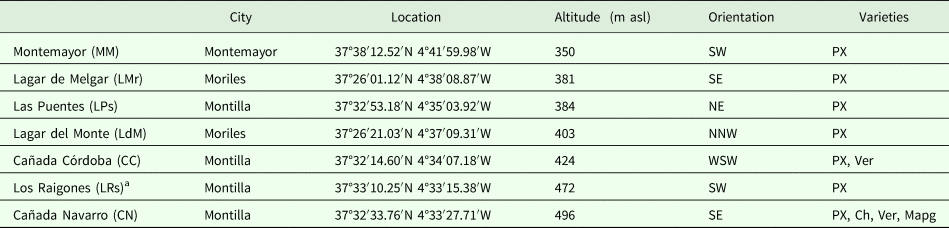
Airborne pollen concentrations were monitored using a Hirst-type volumetric spore trap (Hirst, Reference Hirst1952) located in the Sierra de Montilla, in conjunction with seven passive spore traps (PSTs) (Kelly et al., Reference Kelly, Dufault, Walker, Isard, Schneider, Giesler, Wright, Marois and Hartman2015) located in the study vineyards (Fig. 1 and Table 1). The sampling was carried out from stage 5 (inflorescence emergence) to harvest (Meier, Reference Meier1997). The Hirst type active spore trap has been described in detail by Hirst (Reference Hirst1952). Passive spore traps are also based on the impact principle and are formed by a cylindrical support holder over a base, on which it rotates thanks to bearings and a vane that places it downwind. Inside the cylindrical support, the impact unit is inserted which, impregnated with the same solution used for the Hirst sensor, traps the airborne particles. While the Hirst-type spore trap is volumetric PSTs are non-volumetric, depending on wind velocity. Hirst-type traps were changed once a week, giving daily and hourly data; however, PSTs supply only weekly data in the current study and were also changed once a week. Both types of the trap were used in Los Raigones (LRs), while only passive samplers were used in Cañada Navarro (CN), Cañada Córdoba (CC), Las Puentes (LPs), Lagar del Monte (LdM), Lagar de Melgar (LMr) and Montemayor (MM). Hirst trap location and data analysis were in accordance with the standard protocol developed by the Spanish Aerobiology Network (REA) (Galán et al., Reference Galán, Cariñanos, Alcázar and Dominguez-Vilches2007) and the minimum recommendations of the European Aeroallergen Society (EAS) (Galán et al., Reference Galán, Smith, Thibaudon, Frenguelli, Oteros, Gehrig, Berger, Clot and Brandao2014). In this case, the location of the Hirst sampler was 8 m above ground level. Airborne pollen was expressed as a daily average number of pollen grains/m3 of air. The Vitis pollen season was defined using the Hirst sampler for reference purposes; the start date was defined as the first of 5 consecutive days with a concentration of over five pollen grains/m3. The current study considered the Seasonal Pollen Integral (SPIn), i.e. summing the average daily concentration over the Pollen Season (Galán et al., Reference Galán, Ariatti, Bonini, Clot, Crouzy, Dahl, Fernandez-González, Frenguelli, Gehrig, Isard, Levetin, Li, Mandrioli, Rogers, Thibaudon, Sauliene, Skjøth, Smith and Sofiev2017). Passive spore traps were placed in the centre of each vineyard, 1.5 m above ground level, and slides were changed once a week. Concentrations were performed for six longitudinal transects per slide, thus covering >0.10 of the total surface area. Values were expressed as pollen grains/cm2/week. Daily concentrations from Hirst-type traps were summed to obtain weekly data for better comparison with PSTs data.
Characteristics of the different study locations

PSW, south-west; SE, south-east; NE, north-east; NNW, north-north-west; WSW, west-south-west; PX, Pedro Ximenez; Ver, Verdejo; Ch, Chardonnay; Mapg, Muscat à petit grains.
a Location of the Hirst-type spore trap.
Phenological observations were carried out weekly (twice-weekly during the flowering season, as recommended by Fernández-González et al., Reference Fernández-González, Escuredo, Rodríguez-Rajo, Aira and Jato2011) throughout the active Vitis life-cycle in 2015 and 2016. The seven study vineyards contained four Vitis cultivars: Pedro Ximénez, Verdejo, Muscat Blanc à petits grains and Chardonnay. Data were obtained from 20 individual plants per vineyard. The location of the vineyards is shown in Fig. 1 and characteristics are provided in Table 1: LRs, LPs, LdM, LMr and MM contained only Pedro Ximénez; CC Pedro Ximénez and Verdejo, and CN all four cultivars. The phenological scale developed by Lorenz et al. (Reference Lorenz, Eichhorn, Bleiholder, Klose, Meier and Weber1994), and adapted by Biologische Bundesanstalt, Bundessortenamt und Cemische Industrie as a standardized scale for grapevine phenological observations (Meier, Reference Meier1997), was selected as the standard tool. The five principal stages were monitored: stage 0 (sprouting), stage 1 (leaf development), stage 5 (inflorescence emergence), stage 6 (flowering), stage 7 (development of fruits) and stage 8 (ripening of berries). The phenological calendar was drawn up taking as the start date of each phenological stage the date on which over 0.50 of the vines studied had reached that stage. The mean date of each stage was calculated as the average for the 20 individual plants studied at each sampling site, which were selected randomly from a plot containing 100 plants.
Weather data were obtained from a Campbell-type station located in the main town in the study area (Montilla), at a distance of 200 m from the Hirst-type volumetric sampler. The following weather-related parameters were measured: daily maximum, mean, minimum temperature, rainfall, relative humidity, solar radiation and dew point.
Spearman correlations tests were applied to test for correlations between pollen concentrations and weather-related parameters. Significance was calculated for P < 0.001, P < 0.01 and P < 0.05; the R program (R Core Team, 2014) was used for statistical analysis.
Finally, back-trajectories were performed for days with high airborne pollen concentrations prior to the starting dates observed in the field for the phenological stage 6 (flowering), using the Hybrid Single-Particle Lagrangian Integrated Trajectory (HYSPLIT) online model (Stein et al., Reference Stein, Draxler, Rolph, Stunder, Cohen and Ngan2015), in order to identify the source of pollen grains. Three episodes were studied: 20 April 2015, 27 April 2016 and 4 May 2017.
Results
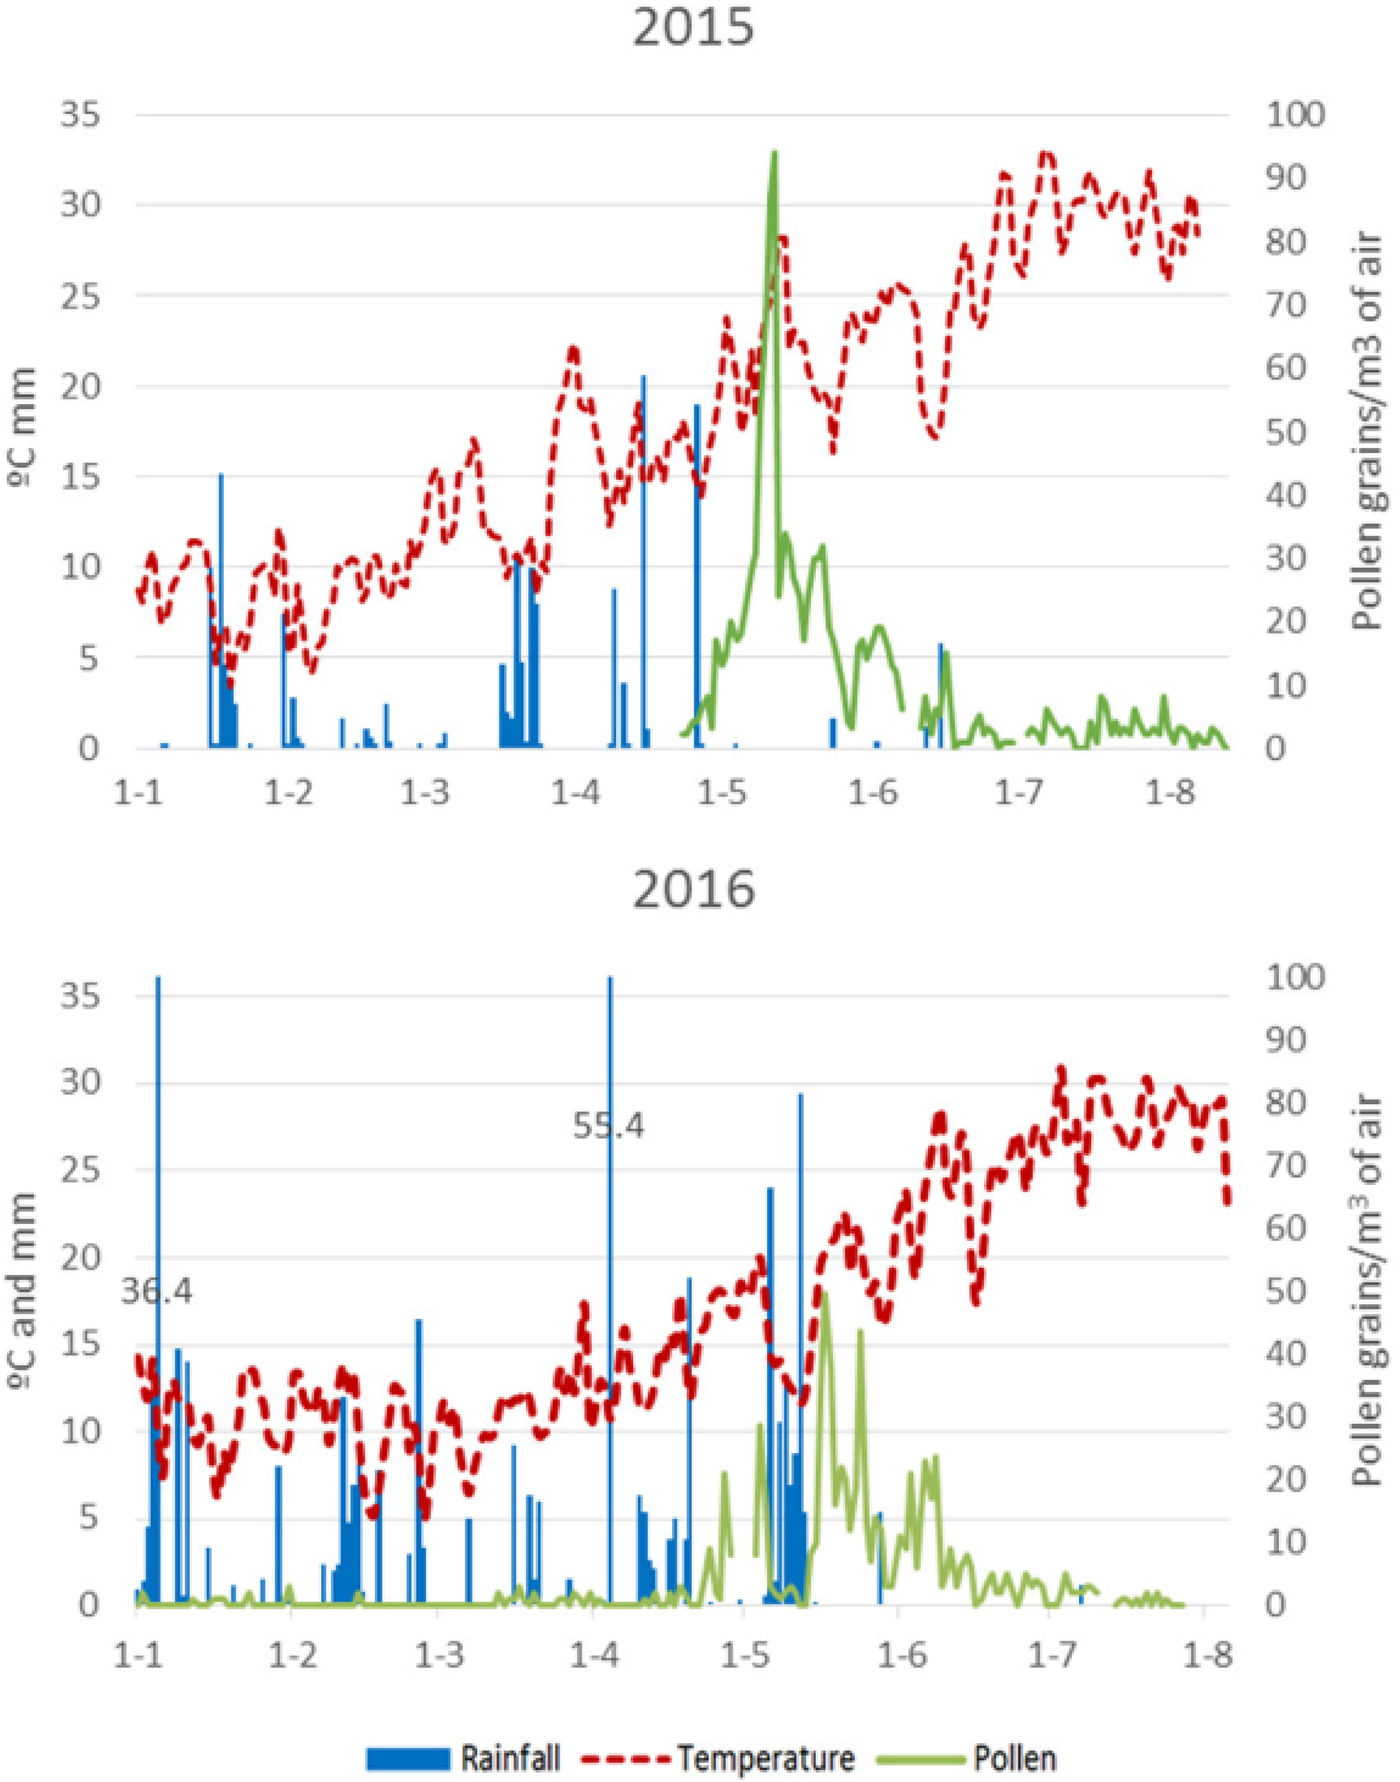
Average temperature and rainfall for the study area during the Vitis vinifera phenological period were determined using data for previous years (2009–2016) and then compared with the data for 2015–2016. During 2009–2016, the average temperature was 19.12 °C and average rainfall 245.71 mm. Both temperature and rainfall were, therefore, lower than the local average in 2015 (17.40 °C and 160.2 mm); in 2016, temperatures were also lower (18.86 °C), while rainfall was higher than average (313.0 mm).
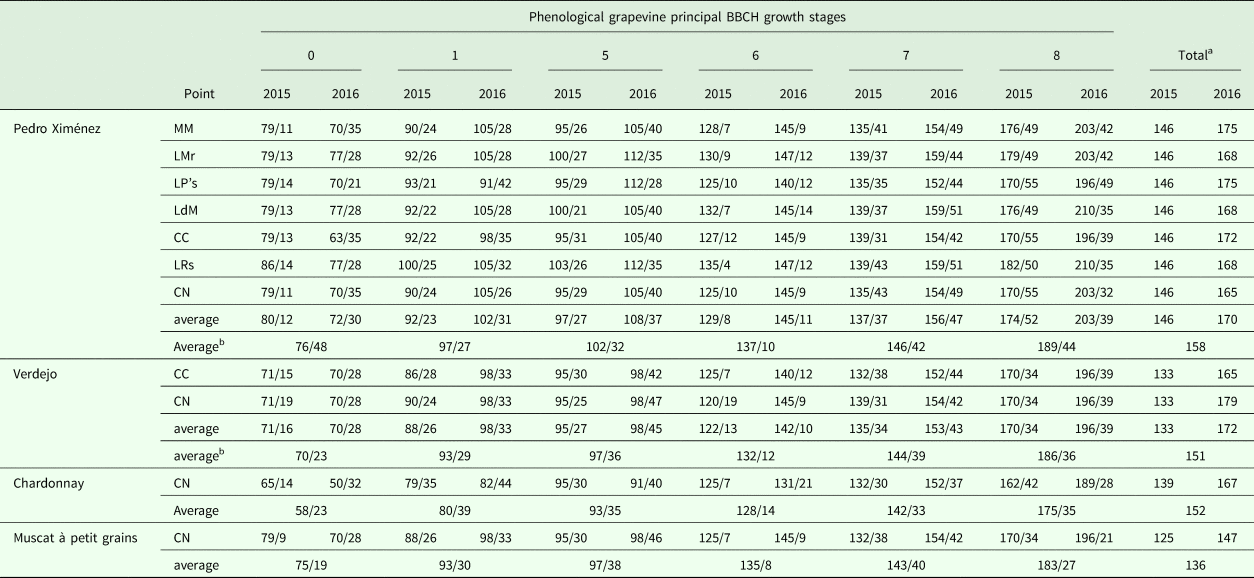
The vine life-cycle (from stage 0 to harvest) lasted between 125 and 179 days at all study sites in both years. Data for different cultivars (Table 2) showed that the shortest life-cycle was recorded for Muscat Blanc à petits grains (125–147 days), followed by Verdejo (133–179 days), Chardonnay (139–167 days) and finally Pedro Ximénez (146–175 days).
Start DOY/ duration of each stage and total days of the cycle in the studied vineyards

DOY, day of year; BBCH, Biologische Bundesanstalt, Bundessortenamt und Chemische Industrie.
a number of days spent in the total cycle.
b average between the two years of study.
The earliest start date for each stage was recorded for Chardonnay; start dates were slightly later for Muscat Blanc à petits grains and Verdejo, while the last variety to start each stage was Pedro Ximénez (Table 2). The duration of each phenological stage was generally shorter in 2015 than in 2016, with the exception of flowering, which lasted longer in 2015. Comparison of start dates for Pedro Ximénez at different study sites revealed that the latest start was at LRs.
Phenological stage start dates (Julian days) and duration in both study years are shown in Table 2, taking into account all cultivars at all sites. Stage 0 (Sprouting) started between late February and early March; Stage 1 (Leaf development) between late March and early April; Stage 5 (Inflorescence emergence) during April; Stage 6 (flowering) between late April and early May in 2015 and during the second fortnight in May in 2016; Stage 7 (development of fruits) started between early May (2015) and early June (2016); and finally Stage 8 (ripening of berries) started between late June and late July in both study years.
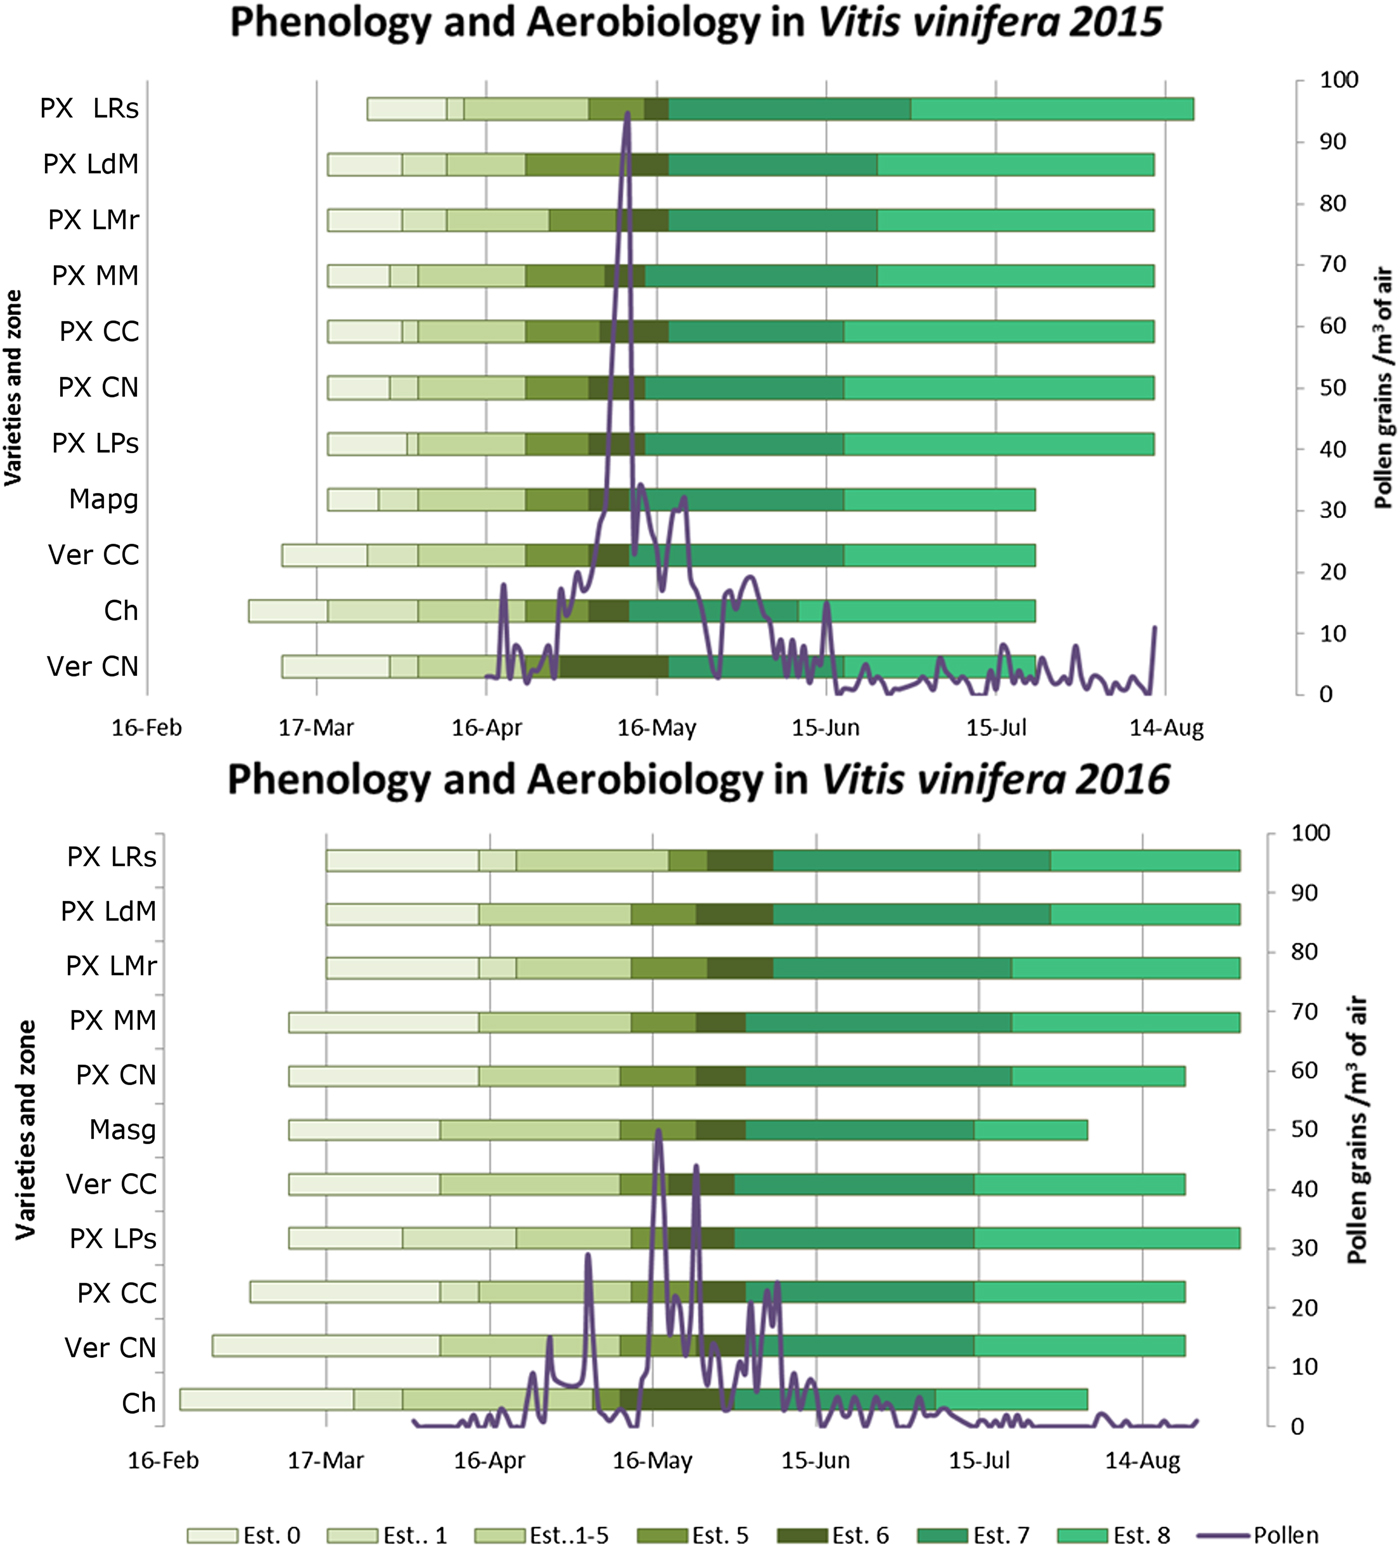
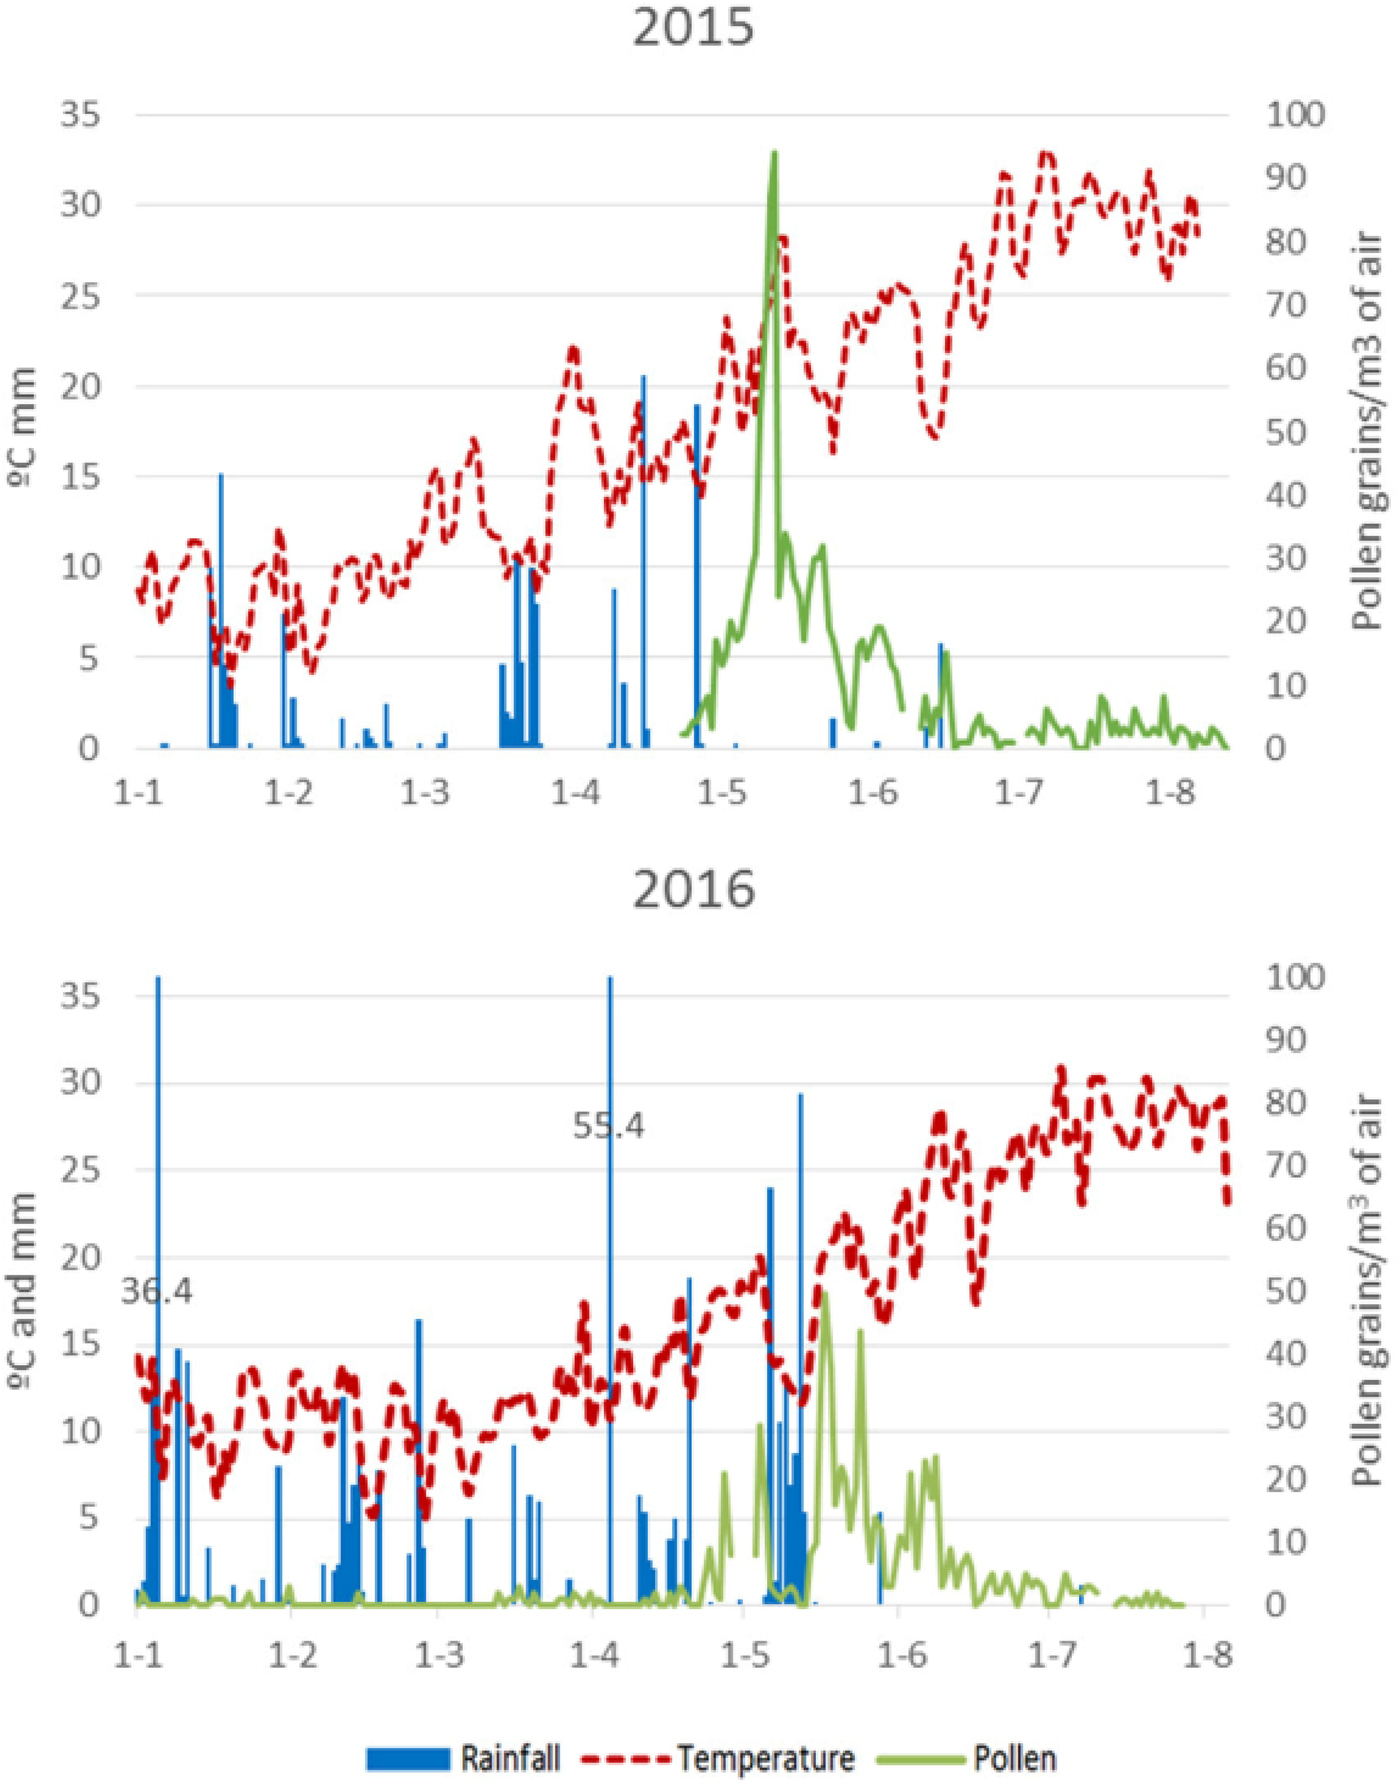
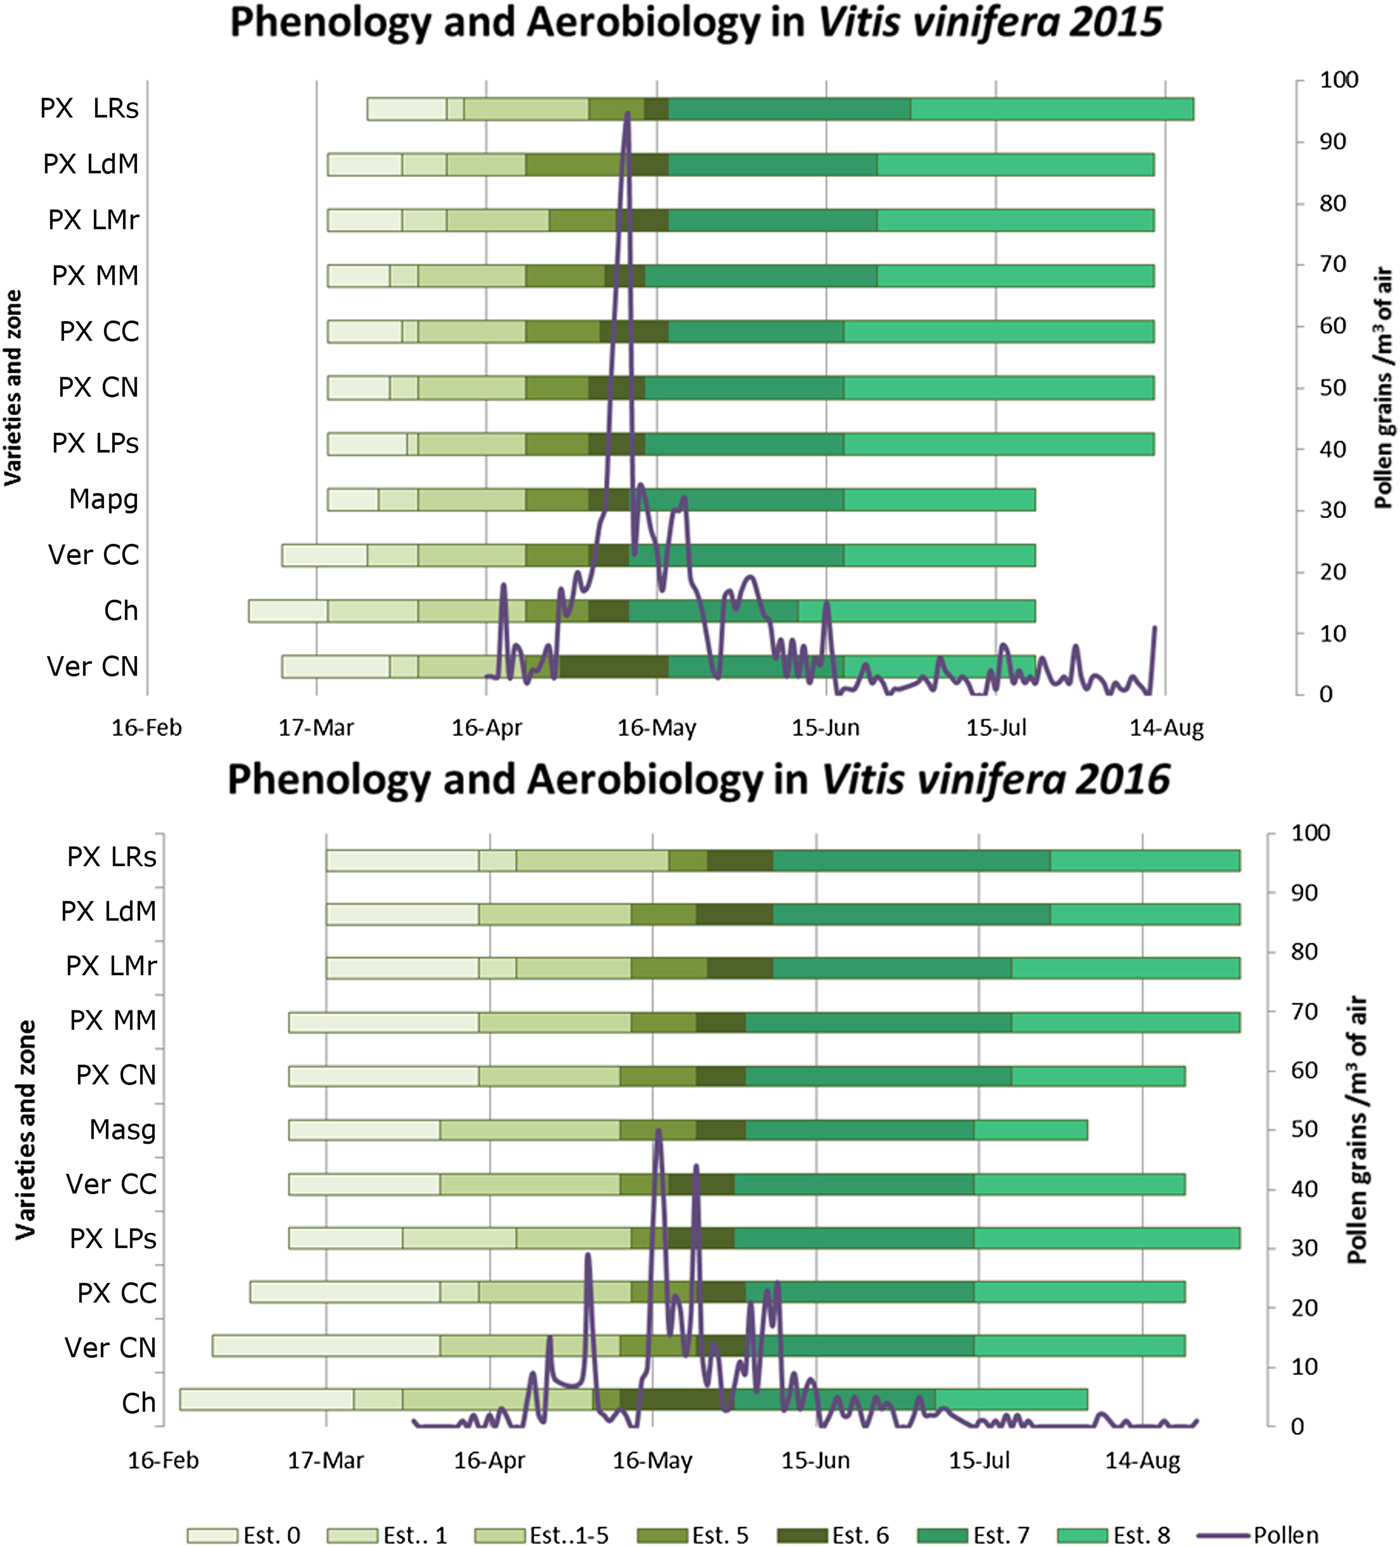
The pollen season, defined using data from the Hirst-type spore trap, started on 30 April and ended on 17 July in 2015, with a SPIn of 1018 pollen grains/m3. In 2016, it started on 14 May and ended on 7 June, with a SPIn of 458 pollen grains/m3. Pollen concentrations, temperatures and rainfall in the 2 study years are shown in Fig. 2. The peak daily concentration for 2015 (94 pollen grains/m3) was recorded on 12 May, coinciding with flowering at most study vineyards. In 2016, the peak concentration was recorded on 17 May (50 pollen grains/m3) when only Chardonnay was in flower, although a second, lower, peak was observed on 24 May, when the other cultivars had started to flower (Fig. 3).
Pollen concentration, temperature and precipitation in the 2 years of study.
Phenology of the studied vineyards and pollen concentration.
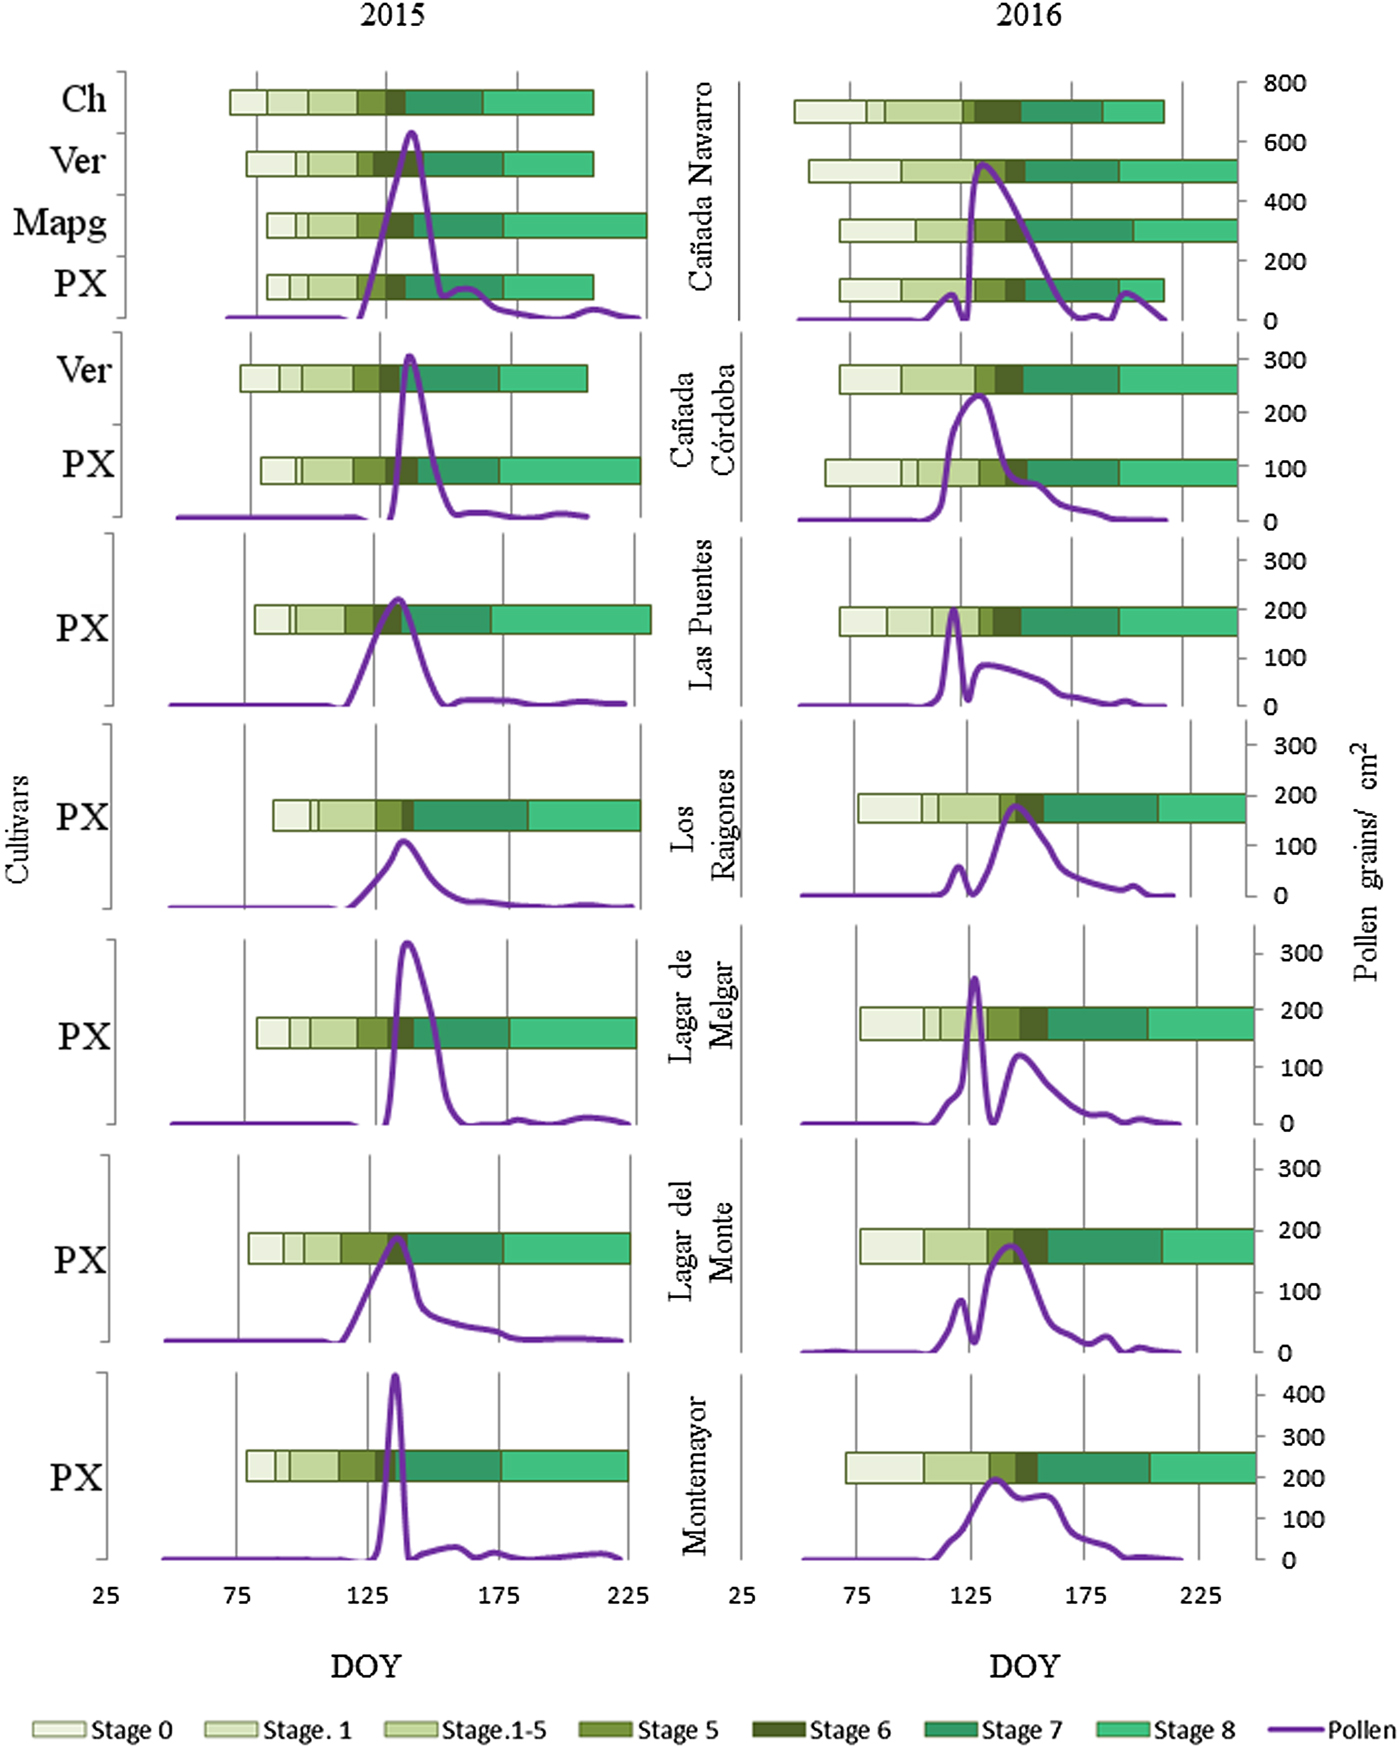
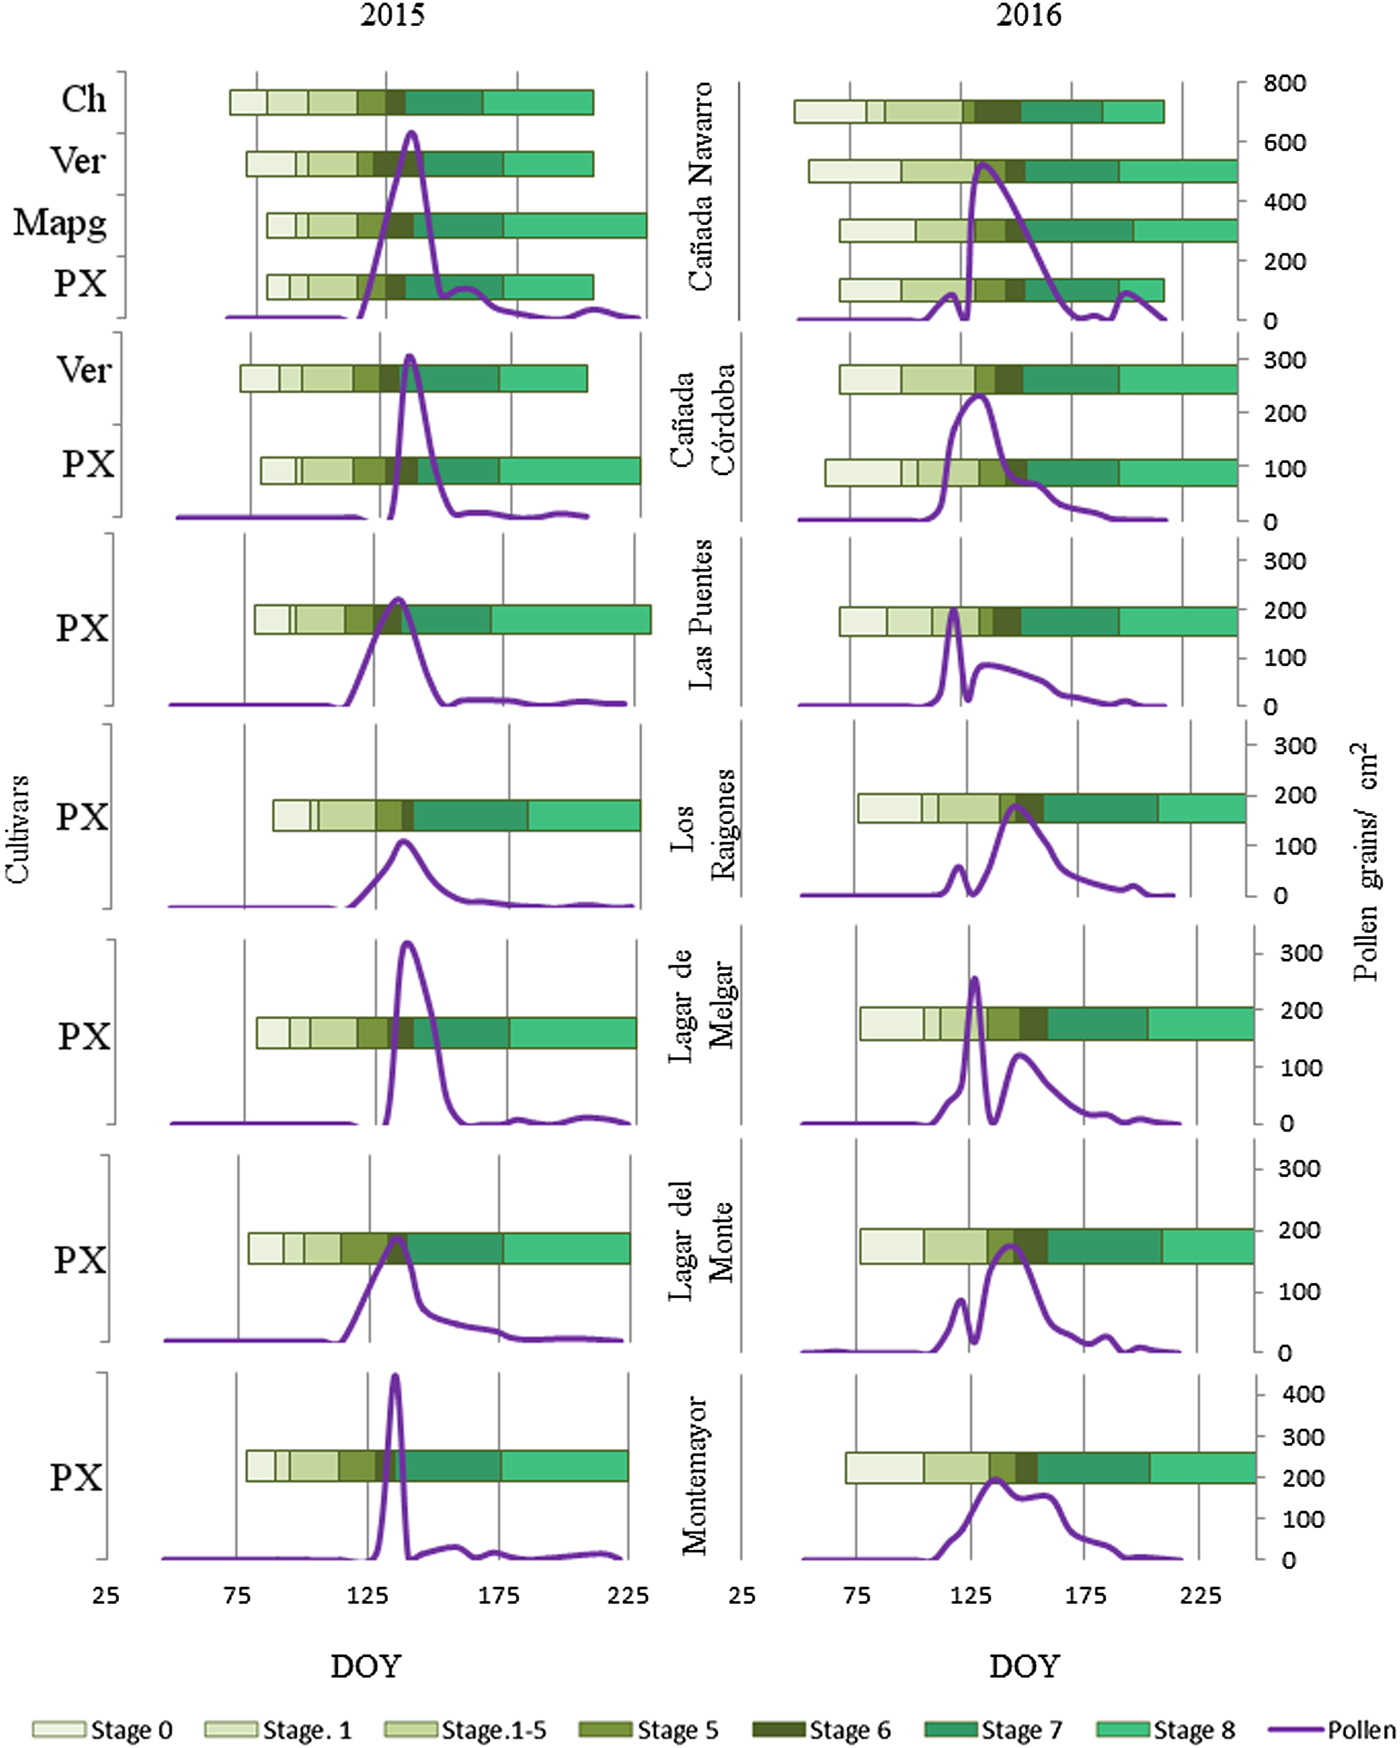
As well as with the Hirst, PSTs pollen concentrations were compared with phenology (Fig. 4). During 2015, pollen concentrations matched the phenology; weekly peaks were counted during flowering. On the other hand, during 2016, one peak was found in all cases before flowering, but in most cases, the highest pollen concentrations were found during stage 6 (flowering).
Phenology and pollen concentration of PSTs in each cultivar.
Correlations between the main weather-related parameters and pollen season data are shown in Table 3. Daily differences were compared using data from the Hirst-type volumetric pollen trap. Temperature and dew point were found to be significant parameters in 2015 (P < 0.001 and <0.05, respectively), while in 2016 temperature, relative humidity, solar radiation and dew point all proved significant (P < 0.001 for the three first, and <0.01 for dew point). Daily concentrations of the pre-peak of Vitis pollen type were compared with meteorological parameters: in this case, temperature affected pollen concentrations positively and significantly in both years (P < 0.001). Solar radiation also had a positive significant relationship with pollen concentration (P < 0.05). Rainfall affected pollen concentrations negatively and this relationship was only statistically significant in 2016 (P < 0.01).
Spearman correlation between Hirst-type pollen concentrations and the daily main environmental factors

***P < 0.001; **P < 0.01; *P < 0.05.
Pre-15: Prepeak of 2015; Pre-16: Prepeak2 of 2016.
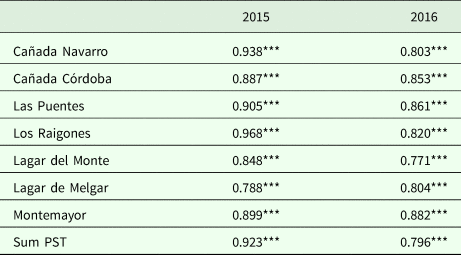
Correlations between data from the Hirst-type sampler and from the PSTs are shown in Table 4. All correlations were significant (P < 0.001); the strongest correlation was recorded in 2015 between the Hirst-type sampler and the nearest PSTs (CN, LPs and LRs), while in 2016 the greatest correlations were observed between Hirst and CC, LPs and MM. In all cases, a highly significant (P < 0.001) positive correlation was observed between Hirst and the sum of all PSTs.
Spearman correlations between the pollen concentration in Hirst-type spore trap with PSTs

***P < 0.001; **P < 0.01; *P < 0.05.
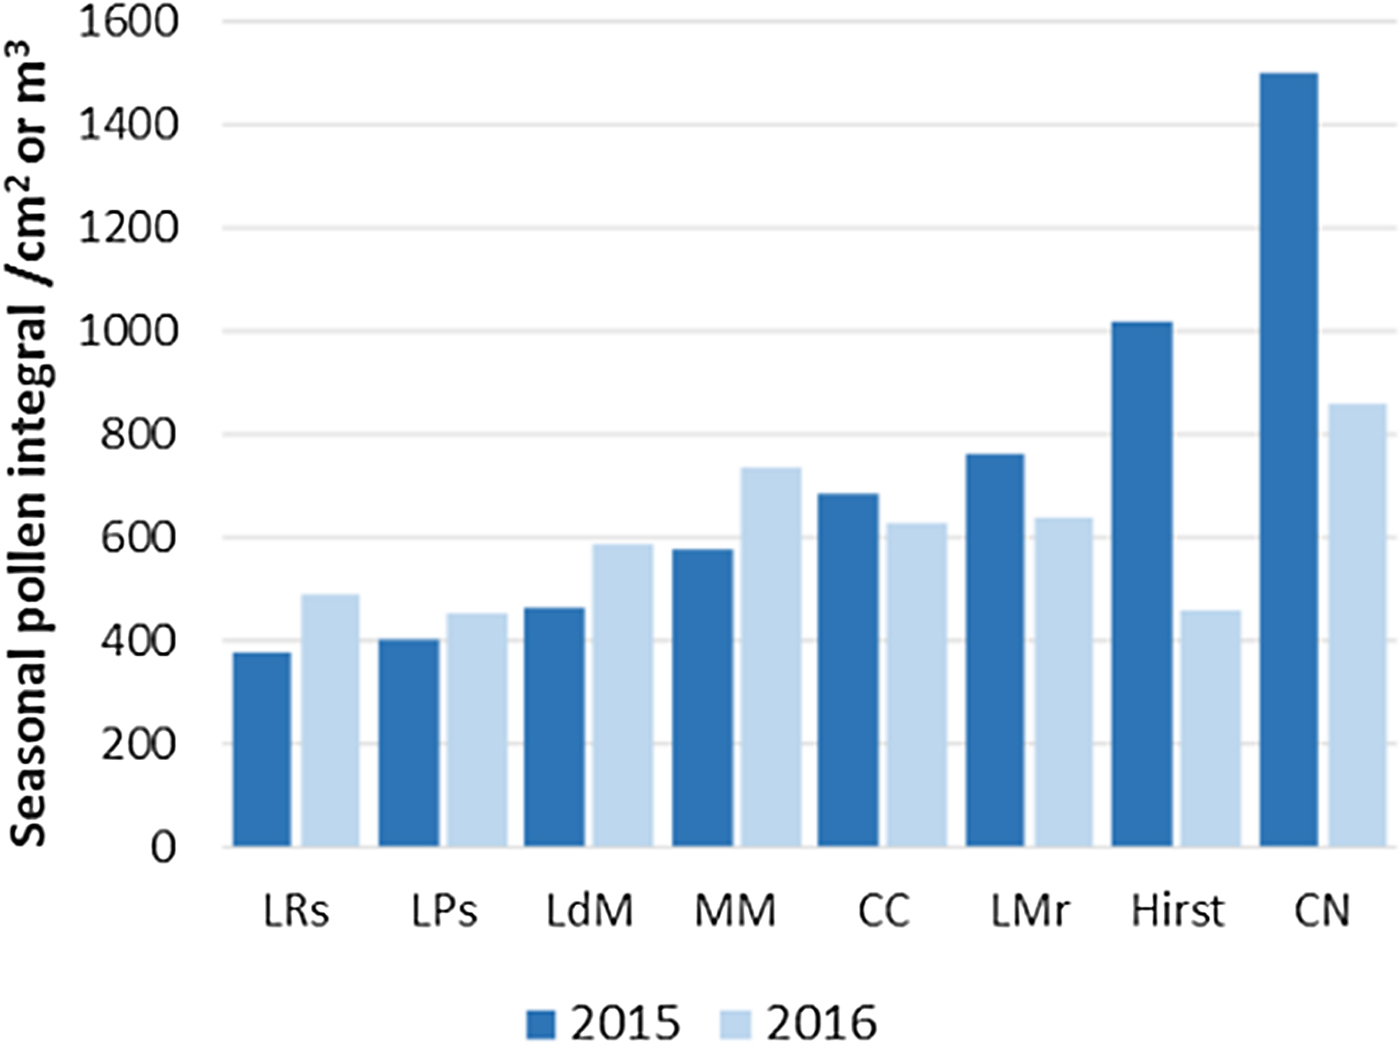
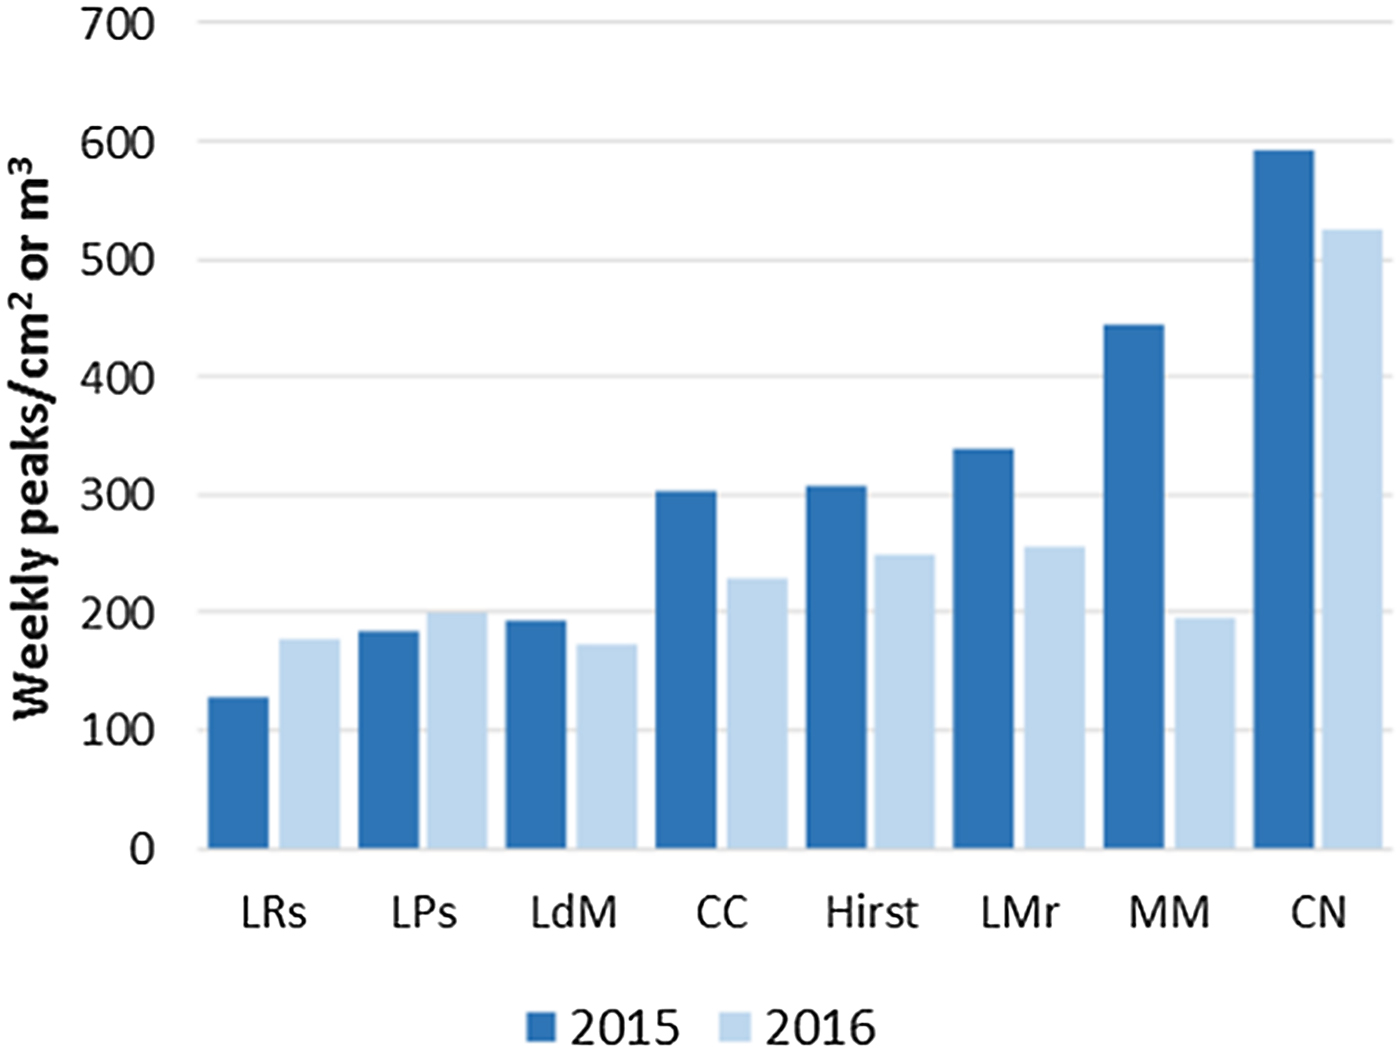
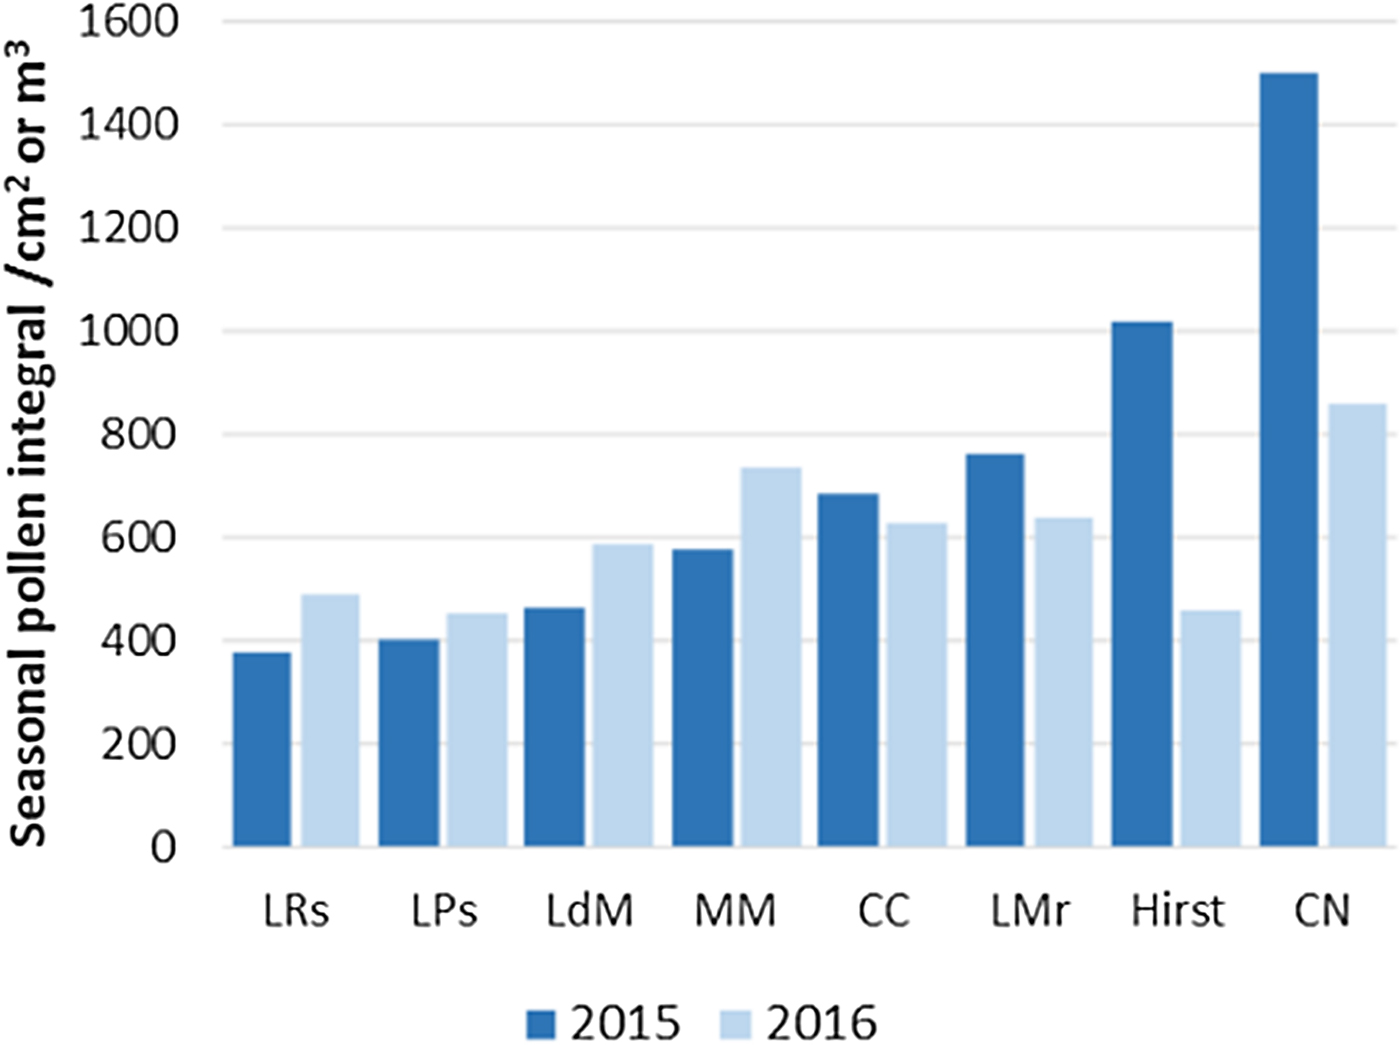
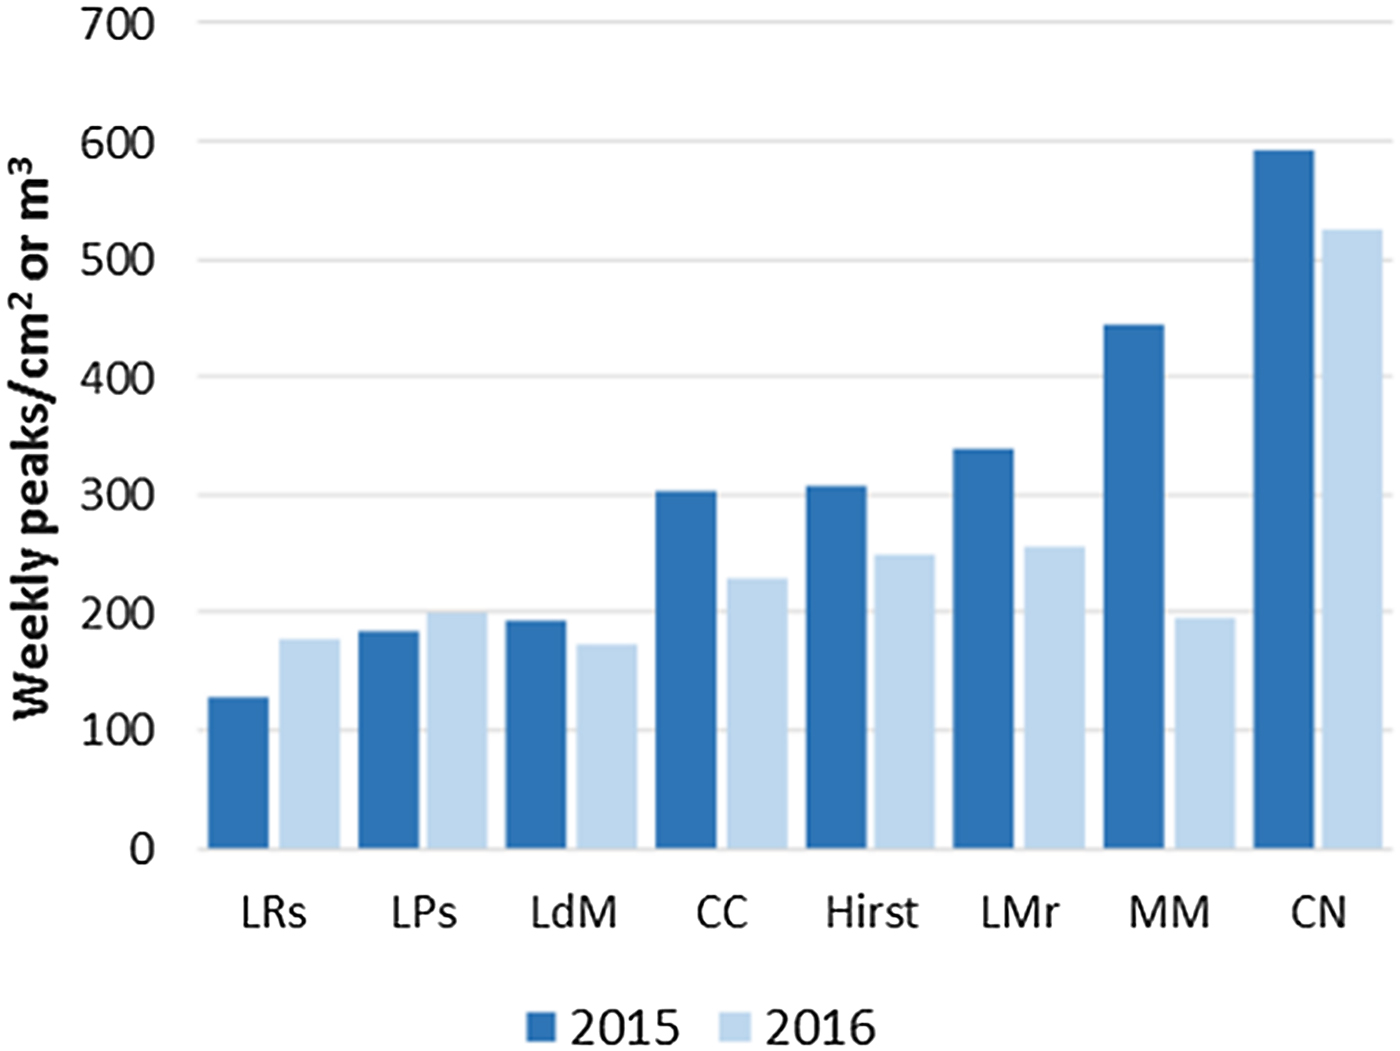
The SPIn was higher in 2015 than in 2016 for CC, LMr, CN and the Hirst-type sampler, while the opposite was found at the other sites (Fig. 5). The highest weekly pollen concentrations were recorded at CN and MM in 2015; weekly pollen concentrations were lower in 2016 at all sites except LPs and LRs (Fig. 6).
Seasonal pollen Integral of all the samplers in the study in both years.
Maximum weekly concentration of all the samplers in the study in both years.
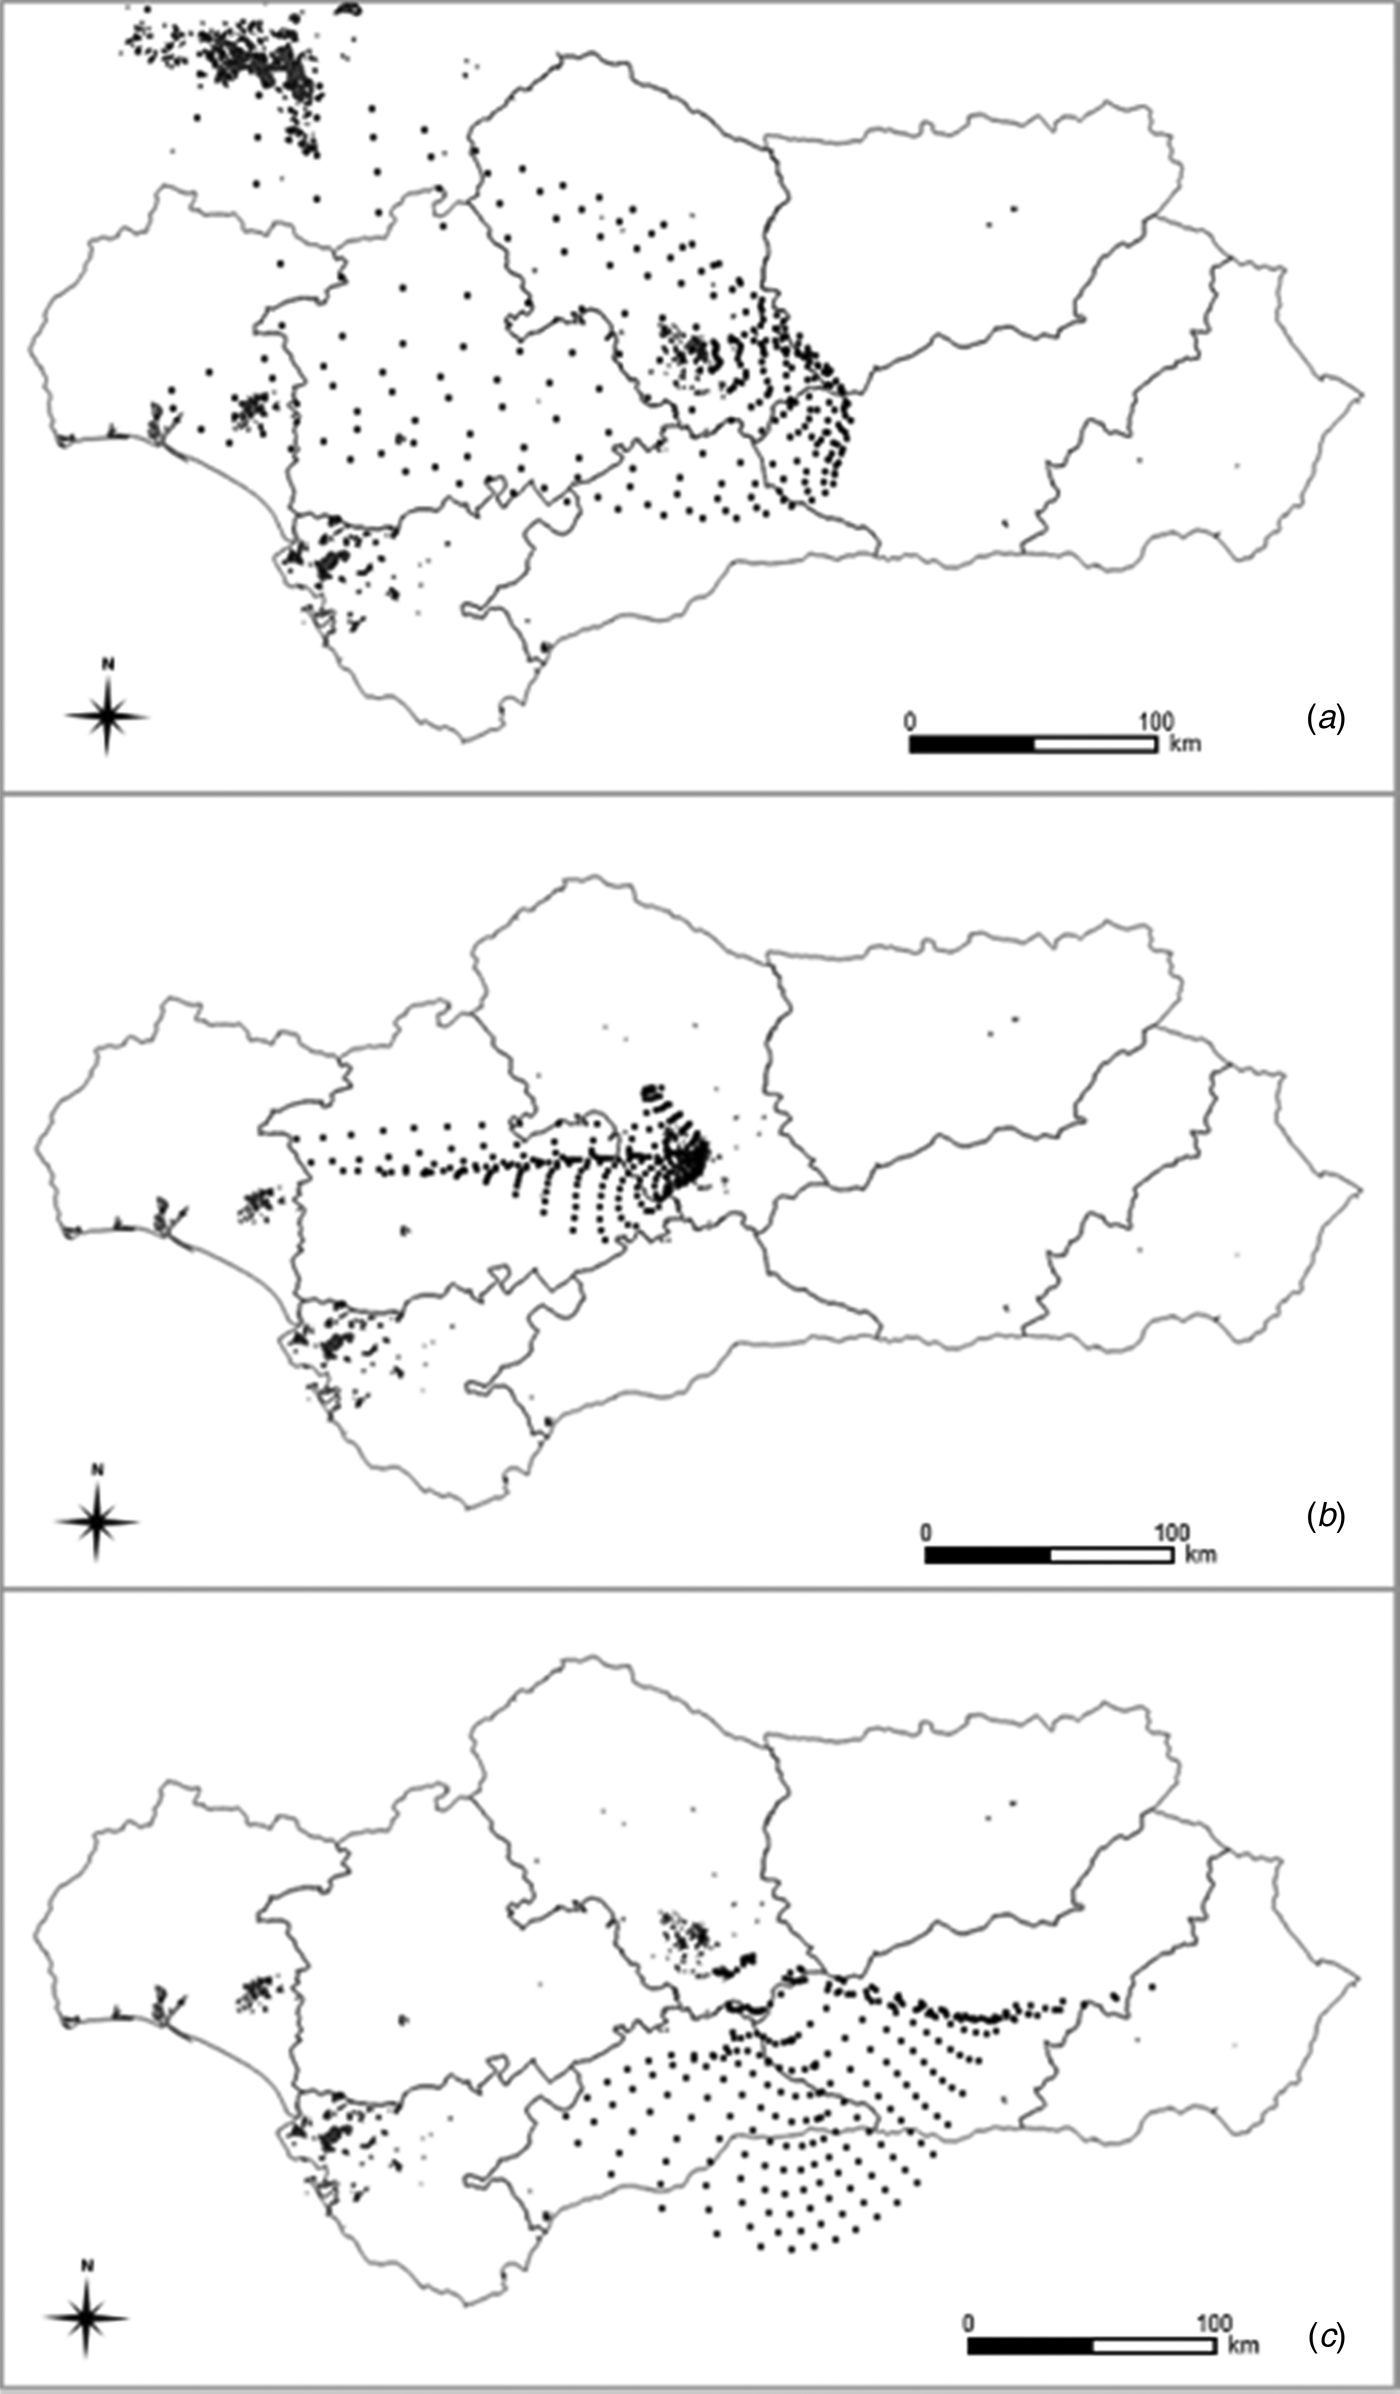
Back-trajectory analysis (Fig. 7) showed that on 20 April 2015 (Fig. 7a), the pollen collected had come from western and north-western Andalusia. In 2016, pollen collected on 27 April had come from west of the study area (Fig. 7b), while pollen collected on 4 May (Fig. 7c) had come from the south. In all cases, areas marked in the map indicate local vineyards, while black spots represent hourly wind changes.
Retrotrajectories during days with a higher concentration of pollen before flowering. Each point corresponds to 1 h and trajectories have been changed each hour between 00:00 and 12:00 UTM. (a) 20 April 2015, (b) 27 April 2016, (c) 4 May 2016.

Discussion
The duration of phenological stages may vary between regions due to differing soil and climate conditions (Pedro Júnior and Sentelhas, Reference Pedro Júnior, Sentelhas and Pommer2003). In the present investigation, however, the study sites shared the same soil and climate conditions. Fernández-González (Reference Fernández-González, Rodríguez-Rajo, Escuredo and Aira2013) reports that in areas with a high-temperature regime, vegetative growth tends to be faster and therefore the vine life-cycle is shorter; while in colder temperate regions, growth is slower and the life-cycle therefore longer. Year-on-year differences in cycle length in the present study may thus be attributable to differences in prevailing weather conditions.
Muscat Blanc à petits berries had an average cycle of 136 days; similar findings are reported for Cabernet Sauvignon (130 days) and Tannat (131 days) in sub-tropical regions (Sato et al., Reference Sato, Jubileu, de Assis and Roberto2011). The average cycle for Chardonnay, Verdejo and Pedro Ximénez was around 150 days and thus shorter than the 193 days reported by Jones and Davis (Reference Jones and Davis2000) for Cabernet Sauvignon in colder temperate regions such as Bordeaux (France). Longer cycles of between 191 and 219 days have also been observed for Cabernet Franc, Merlot Sangiovese and Syrah in the mountains of Brazil (Gris et al., Reference Gris, Burin, Brighenti, Vieira and Bordignon-Luiz2010), and for Treixadura and Godello (193 days) in northern Spain (Fernández-González et al., Reference Fernández-González, Rodríguez-Rajo, Escuredo and Aira2013). Due to local climate conditions, the life-cycles recorded in the current study were longer than in sub-tropical regions and shorter than in colder temperate regions with higher humidity.
In the present study, Chardonnay was the first variety to flower, followed by Verdejo, Muscat Blanc à petits grains and finally Pedro Ximénez. These findings differ from those reported by Parker et al. (Reference Parker, de Cortázar-Atauri, Chuine, Barbeau, Bois, Boursiquot, Cahurel, Claverie, Dufourcq, Gény, Guimberteau, Hofmann, Jacquet, Lacombe, Monamy, Ojeda, Panigai, Payan, Lovelle, Rouchaud, Schneider, Spring, Storchi, Tomasi, Trambouze, Trought and van Leeuwen2013), whose classification of several grapevine cultivars by flowering date showed that Muscat Blanc à petits grains flowered earlier than Chardonnay. The discrepancy is probably due to climate differences between southern Spain and the various sites sampled in Parker's study.
Parker et al. (Reference Parker, de Cortázar-Atauri, Chuine, Barbeau, Bois, Boursiquot, Cahurel, Claverie, Dufourcq, Gény, Guimberteau, Hofmann, Jacquet, Lacombe, Monamy, Ojeda, Panigai, Payan, Lovelle, Rouchaud, Schneider, Spring, Storchi, Tomasi, Trambouze, Trought and van Leeuwen2013) classify Chardonnay and Muscat Blanc à petits grains as early-flowering cultivars. In the present study, Pedro Ximénez, Verdejo, Muscat Blanc à petits grains and Chardonnay flowered earlier than in northern Spain (Fernández-González et al., Reference Fernández-González, Rodríguez-Rajo, Escuredo and Aira2013), where these cultivars have been classified as ‘late cultivars’. In the current study, by contrast, they could be classified as ‘early cultivars’.
Flowering is a key stage in harvest forecasting models (Cunha et al., Reference Cunha, Abreu, Pinto and de Castro2003; Fernández-González et al., Reference Fernández-González, Escuredo, Rodríguez-Rajo, Aira and Jato2011; Oteros et al., Reference Oteros, Orlandi, García-Mozo, Aguilera, Dhiab, Bonofiglio, Abichou, Ruiz-Valenzuela, Mar del Trigo, de la Guardia, Domínguez-Vilches, Msallem, Fornaciari and Galán2014). In 2015 the pollen season was longer, and concentrations were higher than in 2016 when rainfall was heavier. Rainfall is one of the main factors affecting pollen concentrations since it causes airborne pollen to be washed out of the atmosphere (Humble and Metz, Reference Humble and Metz2017). Weaker correlations between pollen season concentrations and rainfall, relative humidity and dew point in 2015 may be attributed to lower total annual rainfall causing pollen resuspension after the peak. Pre-peak correlations show the importance of temperature and rainfall in the pollen concentrations. Nevertheless, the Vitis SPIn was higher in both 2015 and 2016 than those reported in earlier studies (Ribeiro, et al., Reference Ribeiro, Cunha and Abreu2003; Fernández-González et al., Reference Fernández-González, Rodríguez-Rajo, Escuredo and Aira2013).
In the case of PSTs, higher SPIns during 2016 were caused by higher peak and the lower SPIns were caused by lower peak. In the case of MM, the concentration of pollen was maintained during the phenological period, causing a higher SPIn. High local storms caused the cleaning of some PSTs; however, these storms did not affect the Hirst due to its structure, preventing water entry into the sample. Those differences explain the lower correlation between Hirst and PSTs in 2016.
Although different types of sensors provide essentially the same information – as demonstrated in earlier comparisons of Hirst and Cour samplers (Belmonte et al., Reference Belmonte, Canela and Guàrdia2000) – the Hirst-type volumetric sampler yields data for a wider area, while PST provide local data (West and Kimber, Reference West and Kimber2015). One of the factors affecting these differences is the location of the different samplers. Comparison of data from the two types of the sampler is valuable for determining whether local data are representative of the region as a whole (Kelly et al., Reference Kelly, Dufault, Walker, Isard, Schneider, Giesler, Wright, Marois and Hartman2015).
Back-trajectory analysis showed that pollen collected prior to flowering in the PDO area apparently came from elsewhere in Andalusia, for example from Huelva and Malaga, where flowering generally takes place earlier due to the more temperate coastal climate. Previous research in woody species has highlighted an advance in flowering in these areas of Andalusia (Alcázar et al., Reference Alcázar, García-Mozo, Trigo Mdel, Ruiz, González-Minero, Hidalgo, de la Guardia and Galán2011; Martínez-Bracero et al., Reference Martínez-Bracero, Alcázar, de la Guardia, González-Minero, Ruiz, Trigo Pérez and Galán2015; Velasco-Jiménez et al., Reference Velasco-Jiménez, Alcázar, Valenzuela, Gharbi, de la Guardia and Galán2018).
Conclusions
Airborne Vitis pollen grains in study vineyards were detected mainly during inflorescence emergence and flowering. Due to local bioclimatic conditions in the Montilla-Moriles PDO area, grapevine life-cycles were shorter than in temperate climates but longer than in tropical climates. In terms of flowering period, the grapevine cultivars in the current study may be classed as ‘early cultivars’. Data obtained using local passive samplers located directly in the vineyard confirmed that the airborne pollen concentrations recorded by the volumetric sampler were representative of the study area.
Financial support
This study was supported by the project ‘CGL2014-54731-R- FENOMED-Estudio de tendencias fenológicas en plantas del Mediterráneo Occidental y su relación con el cambio climático’. Ministerio de Economía y Competitividad. Spain Government.
Conflicts of interest
None
Ethical standards
Not applicable