I. INTRODUCTION
A variety of commercially available fuel cells have potential application in automobiles, portable devices (mobile phones and laptops), and stationary power supplies. Polymer electrolyte membrane also known as proton exchange membrane (PEM) fuel cells, which use hydrogen as the fuel and oxygen as the oxidant, have drawn particular attention from researchers throughout the world due to their high efficiency and minimal environmental impact.Reference Borup, Meyers, Pivovar, Kim, Mukundan, Garland, Myers, Wilson, Garzon, Wood, Zelenay, More, Stroh, Zawodzinski, Boncella, McGrath, Inaba, Miyatake, Hori, Ota, Ogumi, Miyata, Nishikata, Siroma, Uchimoto, Yasuda, Kimijima and Iwashita1, Reference Granovskii, Dincer and Rosen2 The PEM fuel cell is a very efficient source of energy when operated in the temperature range between 20 and 90 °C. The PEM fuel cell has demonstrated a short start-up time and quick response to the power demands of systems in this temperature range.
The PEM is sandwiched between the electrodes in the membrane electrode assembly (MEA) and facilitates the conduction of protons from anode to cathode when sufficiently hydrated. Typical membranes consist of ionomers whose chemistry consists of a backbone and side-chains. There are many different kinds of ionomers that have been investigated for use in the PEM fuel cell.Reference Buchi, Inaba and Schmidt3 These include perfluorosulfonic acid (PFSA) ionomers such as: Nafion® (DuPont de Nemours, Wilmington, DE), 3M and the SSC (short side-chain). All PFSA membranes have a similar polytetrafluoroethylene (PTFE) backbone but different side-chains. The chemistry of the monomers these PFSA membranes may be distinguished with the formula:  ; where m = 1 and n = 2 for Nafion®, m = 0 and n = 4 for 3M, and m = 0 and n = 2 for the SSC ionomer.
The cost and the lifetime of a PEM fuel cell depend on the components of the MEA. Aging of MEA affects the performance (current density and cell voltage) of the cell.Reference Borup, Meyers, Pivovar, Kim, Mukundan, Garland, Myers, Wilson, Garzon, Wood, Zelenay, More, Stroh, Zawodzinski, Boncella, McGrath, Inaba, Miyatake, Hori, Ota, Ogumi, Miyata, Nishikata, Siroma, Uchimoto, Yasuda, Kimijima and Iwashita1 The cell shows a gradual decline in performance after ∼5000 h of operation which mainly occurs due to the degradation of the membrane. The lifetime of a membrane can be affected mechanically, thermally, and by the chemical environment in which the PEM fuel cell operates.Reference Wu, Yuan, Martin, Wang, Zhang, Shen, Wu and Merida4, Reference Collier, Wang, Zi Yuan, Zhang and Wilkinson5 Mechanical degradation can occur due to various factors, such as microcracks or tears. The operation of PEM fuel cells at temperatures greater than 90 °C can lead to membrane breakdown, pinhole formation or morphological change in the membrane.Reference Sethuraman, Weidner, Haug and Protsailo6–Reference Yuji Shibahara, Izumi, Nishijima, Honda, Kimura, Tagawa and Isoyama9 The operation of these cells at low relative humidity also adversely affects the membrane.Reference Sethuraman, Weidner, Haug and Protsailo6–Reference Knights, Colbow, St-Pierre and Wilkinson8, Reference Endoh, Terazono, Widjaja and Takimoto10 Membrane degradation can accelerate due to the presence of ionic impurities.Reference Inaba, Kinumoto, Kiriake, Umebayashi, Tasaka and Ogumi7, Reference Chen, Levitin, Hess and Fuller11–Reference Bauer, Waldner, Fallmann, Hager, Klare, Krutzler, Malato and Maletzky18 The exposure of the membrane to an oxidizing medium on the anode side and to a reducing medium on the cathode side of the PEM cell can cause chemical degradation of the membrane. Researchers have speculated that the crossover of H2 or O2 to the opposite side of the cell might cause physical degradation of the membrane and affect the efficiency of the cell. But, it has been proven that crossing of the gasses is relatively slow and the loss in efficiency is only about 1–3%.Reference Inaba, Kinumoto, Kiriake, Umebayashi, Tasaka and Ogumi7, Reference Cheng, Zhang, Tang, Song, Shen, Song and Zhang19–Reference Aoki, Uchida and Watanabe24 The crossover of gases might lead to the exothermic combustion of H2, which can cause pinhole formation in the membrane.Reference Inaba, Kinumoto, Kiriake, Umebayashi, Tasaka and Ogumi7
Chemical degradation of a membrane due to the presence of hydrogen peroxide (H2O2) in the fuel cell has been discussed in the literature.Reference Kinumoto, Inaba, Nakayama, Ogata, Umebayashi, Tasaka, Iriyama, Abe and Ogumi15, Reference LaConti, Hamdan and McDonald25, Reference Cipollini26 The formation of H2O2 has been confirmed by examining the exhaust gases.Reference Teranishi, Kawata, Tsushima and Hirai27 The drain water has also been tested during operation to check for the presence of H2O2.Reference Inaba, Kinumoto, Kiriake, Umebayashi, Tasaka and Ogumi7 Direct examination of the membrane of an operating fuel cell has also confirmed this finding.Reference Liu and Zuckerbrod28 The mechanism of H2O2 formation can be understood in terms of Laconti’s proposal: the hydrogen gas is adsorbed on the Pt catalyst at the anode and resides in atomic form (i.e., Pt–H). The oxygen gas permeates through the membrane from the cathode side and is reduced at the Pt catalyst by atomic hydrogen to form H2O2.Reference LaConti, Hamdan and McDonald25 Hence, the reactions for the formation of H2O2 are:



The above reactions produce •OOH and H2O2, which are oxidizing in nature. H2O2 will also form the oxidizing radicals •OOH and •OH. The presence of metallic impurities, such as Fe2+ and Cu2+, in the membrane accelerates the formation of these reactive radicals, and membrane degradation has been observed at an enhanced rate.Reference Inaba, Kinumoto, Kiriake, Umebayashi, Tasaka and Ogumi7 The reactions for the formation of oxidative radicals are shown in reactions [Eqs. (2a)–(2e)]:





Chemical degradation of PFSA membranes yields fluoride ions, sulfonate ions, and low molecular weight perfluoro-fragments, which were verified by examining drain water during the operation of a PEM fuel cell.Reference Chen, Levitin, Hess and Fuller11, Reference Kinumoto, Inaba, Nakayama, Ogata, Umebayashi, Tasaka, Iriyama, Abe and Ogumi15, Reference Delaney and Liu29, Reference Qiao, Saito, Hayamizu and Okada30 The cathode outlet gas has also been tested by direct gas mass spectroscopy under open circuit voltage (OCV) conditions, and the formation of HF, H2O2, CO2, SO, SO2, H2SO2, and H2SO3 was confirmed.Reference Teranishi, Kawata, Tsushima and Hirai27 PFSA ionomers have C–C and C–F bonds in the backbone. The backbone has no α–hydrogen atoms, which are susceptible to attack by reactive radicals. Due to the absence of an α–hydrogen, the backbones of these ionomers should be stable against the radical attack.Reference Mitov, Panchenko and Roduner31 However, during the manufacturing process of a PFSA membrane, it is possible that carboxylic acid end-groups are present in the polymer,Reference Borup, Meyers, Pivovar, Kim, Mukundan, Garland, Myers, Wilson, Garzon, Wood, Zelenay, More, Stroh, Zawodzinski, Boncella, McGrath, Inaba, Miyatake, Hori, Ota, Ogumi, Miyata, Nishikata, Siroma, Uchimoto, Yasuda, Kimijima and Iwashita1, Reference Curtin, Lousenberg, Henry, Tangeman and Tisack32–Reference Hamrock and Yandrasits34 which can lead to backbone degradation in the presence of reactive radicals.
The side-chain of all PFSA ionomers has an ether linkage, fluorinated ethylene groups, and terminal sulfonic acid group (–SO3H). Solid-state 19F and 13C nuclear magnetic resonance (NMR) spectroscopy measurements of the membrane before and after in situ tests of PEM fuel cells have demonstrated that the membranes degrade predominantly in the side-chain containing SO3H, CF3, OCF3, and CF groups.Reference Ghassemadeh, Marrony, Barrera, Kreuer, Maier and Muller35 An in situ infrared spectroelectrochemical study showed that membrane degradation occurs due to the loss of CF2 groups in the backbone and loss of side-chain fragments containing SO3− groups, and the C–O bond cleavage leads to side-chain degradation.Reference Fang, Shen, Song, Stergiopoulos and Tsiakaras36 An ex situ Fenton test of SSC (Hyflon, Solvay Solexis, Bollate, Italy) and Nafion membranes by solid-state 19F NMR spectroscopy showed that the SSC membrane with its shorter side-chains is more stable against side-chain attack due to the absence of an additional tertiary carbon in the side-chain.Reference Ghassemzadeh, Kreuer, Maier and Mueller37 A study of the relative bond dissociation energies of PFSA ionomers using density functional theory (DFT) indicated that the C–S bond is the weakest bond among all bonds in the side-chain and backbone of a neutral polymer molecule; however, the C–S bond is stronger when the molecule is ionized while it weakens the C–O bond connecting the side-chain with the backbone.Reference Tokumasu, Ogawa, Koyama, Ishimoto and Miyamoto38 Ghassemzadeh et al.Reference Ghassemzadeh, Kreuer, Maier and Muller39 proposed two mechanisms for side-chain degradation of a Nafion membrane: radical attack on the weakest bond, i.e., on C–S bond; and radical attack on the tertiary backbone-carbon bearing the side-chain or on the tertiary carbon between two ether groups within the side-chain. A few experimental studies support the presence of radical compounds in the degradation products resulting from C–S bond cleavage.Reference Bosnjakovic, Kadirov and Schlick12, Reference Kadirov, Bosnjakovic and Schlick40, Reference Carlsson, Jorissen and Tillmetz41 Most of the studies support the C–O bond cleavage leading to side-chain degradation. Hence, the side-chain degradation mechanism is not completely understood, and is therefore the impetus of the present study.
Of all oxidizing agents, •OH has the highest reduction potential, which makes it the most aggressive one.Reference Coms42 In the present work, side-chain degradation due to •OH radicals is examined. The degradation is examined in terms of the energy of homolytic bond cleavage and the energy of the reaction of the side-chain with •OH. The degradation is also studied through a series of reactions, which result in smaller fragments and, finally, splitting of the backbone.
The article is organized as follows. The computational section describes methods of calculation of (i) the energy of homolytic bond cleavage, (ii) the energy of reaction, and (iii) the activation energy of the reaction starting from both the reactants and the products. It also outlines the method used to determine the structures of various fragments along with their optimized energies. This section is followed by a discussion of the results for the side?chain degradation including the energies of homolytic cleavage of various bonds and the reactions of the side?chain with •OH. Results of the C–S bond cleavage and a detailed discussion of the mechanism are also presented. Finally, conclusions are presented.
II. COMPUTATIONAL METHOD
The energy of homolytic bond cleavage, the energy of reaction, and the activation energy of reaction were computed in this study. The homolytic cleavage of a bond produces two radical components, having one unpaired electron on the respective atom of each radical. The energy of homolytic bond cleavage was calculated according to: Eradical1 + Eradical2 − Eionomer fragment, where, Ex represents the internal energy of the component x. The energy of a reaction was calculated by Eproducts − Ereactants; where Eproducts/reactants represents the summation of the internal energies of all products/reactants. The activation energy of a reaction is the difference between the internal energy of the transition state (TS) of the reaction and the internal energy of the reactant complex or the product complex (ETS − Ereactant-/product complex). The internal energy of the reactant/product complex is the energy of the system when all reactants (products) are at an optimal interaction distance to undergo the respective reaction.
All electronic structure calculations were performed with the Gaussian 03 suite of programs.Reference Frisch, Trucks, Schlegel, Scuseria, Robb, Cheeseman, Montgomery, Vreven, Kudin, Burant, Millam, Iyengar, Tomasi, Barone, Mennucci, Cossi, Scalmani, Rega, Petersson, Nakatsuji, Hada, Ehara, Toyota, Fukuda, Hasegawa, Ishida, Nakajima, Honda, Kitao, Nakai, Klene, Li, Knox, Hratchian, Cross, Adamo, Jaramillo, Gomperts, Stratmann, Yazyev, Austin, Cammi, Pomelli, Ochterski, Ayala, Morokuma, Voth, Salvador, Dannenberg, Zakrzewski, Dapprich, Daniels, Strain, Farkas, Malick, Rabuck, Raghavachari, Foresman, Ortiz, Cui, Baboul, Clifford, Cioslowski, Stefanov, Liu, Liashenko, Piskorz, Komaromi, Martin, Fox, Keith, Al-Laham, Peng, Nanayakkara, Challacombe, Gill, Johnson, Chen, Wong, Gonzalez and Pople43 Hybrid density functional (DFT) theory with Becke’s three-parameter functional (B3LYP)Reference Becke44–Reference Stephens, Devlin, Chabalowski and Frisch47 and the 6-311++G** basis set was used for all calculations. Optimization of the molecules, anions, and radicals was performed without any symmetry constraints. Frequency calculations were subsequently performed on the optimized structures. The energy of the optimized structure was corrected for zero-point vibrational energy. This corrected energy of the optimized structure represents the total internal energy of the component in the gas phase. A potential energy scan (PES) was performed on the reactant complex (or product complex) by varying the distance of the departing atoms leading to the product complex (or reactant complex). Transition state of a reaction was located by the synchronous transit-guided quasi-Newton (STQN) method (QST3).Reference Peng and Schlegel48 The obtained transition state was confirmed by the presence of an imaginary frequency. Finally, an intrinsic reaction coordinate (IRC) calculationReference Gonzalez and Schlegel49, Reference Gonzalez and Schlegel50 was performed at the transition state to confirm its connectivity to the reactant complex and product complex.
It should be pointed out that the electronic structure calculations reported in this investigation have not included either implicit or explicit water molecules. We have previously shown that the inclusion of water as a dielectric continuum in calculation of proton transfer barriers in functionalized phosphonic acid molecules has in some cases had a qualitative impact.Reference Wang and Paddison51 In the present work this is simply too expensive computationally and therefore has been deferred.
III. RESULTS AND DISCUSSION
A. Side chain degradation
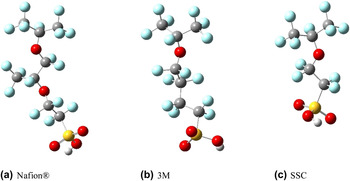
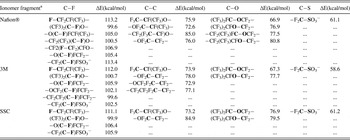
The side chains of three different PFSA ionomers were examined: Nafion®, 3M, and SSC. Prior work has shown that electronic structure calculations on fragments of various ionomers are able to reveal differences in local hydration and proton transfer,Reference Eikerling, Paddison and Zawodzinski52–Reference Clark, Paddison, Eikerling, Dupuis and Zawodzinski56 and hence a similar methodology was applied in the present study. Fully optimized structures (B3LYP/6-311++G**) of fragments of these ionomers are shown in Fig. 1. As the membrane is hydrated in a PEM fuel cell during operation the anionic form of the side chain (i.e., –SO3−) was assumed (i.e., the acidic proton is dissociated in the water). Prior theoretical and experimental work has revealed that the majority of the protons will exist as dissociated and hydrated species at water contents as low as 3 H2O/SO3H.Reference Paddison53, Reference Laporta, Pegoraro and Zanderighi57–Reference Kreuer, Paddison, Spohr and Schuster59 As pointed out earlier, the rate of chemical degradation is affected by the relative humidity of the PEM, with conditions of low water content resulting in enhanced degradation perhaps due to the accumulation of H2O2 and other impurities.Reference Inaba, Kinumoto, Kiriake, Umebayashi, Tasaka and Ogumi7 Hence, degradation in this work was studied by examining the bond strength of all bonds in the ionomer fragments under the assumption of homolytic bond cleavage. Computed homolytic bond dissociation energies for the C–F, C–C, C–O, and C–S bonds are presented in Table I. These energies clearly indicate, as expected, that the C–F bond is the strongest among all bonds with strengths from 99.6 to 113.4 kcal/mol. The high electronegativity of the fluorine atoms gives these bonds their strength and makes them the least likely to break in the oxidizing medium of a PEM fuel cell. The C–C and C–O bonds are slightly weaker. The energy of homolytic bond cleavage of the C–C bonds varies from 72.5 to 85.0 kcal/mol, and for C–O bonds, from 67 to 81 kcal/mol. The energy of the homolytic bond cleavage of the C–S bond is ∼60 kcal/mol for all three side-chains. It is clearly the weakest bond and hence the most likely to be cleaved. Undoubtedly, the strength of the bond will impact the activation of energy associated with the cleavage.
Side-chain fragments of PFSA membranes: (a) Nafion®, (b) 3M, and (c) short-side-chain (SSC). Blue, dark gray, light gray, red, and yellow spheres represent F, C, H, O and S atoms, respectively.

Homolytic bond dissociation energies (HBDE) for ionomer fragments. The HBDE of a bond (shown in bold) is ∆E and was calculated by Eradical1 + Eradical2 – Eionomer fragment, where radicals 1 and 2 are generated by the homolytic cleavage of the bond of the ionomer fragment. All structures were fully optimized using B3LYP/6-311++G** level of theory.

a The structures of side-chain fragments of the ionomers have been shortened. The full structures are shown in Fig. 1.
As the PEM fuel cell operates in a strong oxidizing medium of •OH radicals, the degradation of the anionic side-chain fragments of PFSA ionomers was studied via a series of reactions with •OH. Different products result depending on which bond in the side-chain fragments the •OH attacks. All combinations of possible products were considered, and the energy of each reaction calculated. The reaction involving the C–S bond cleavage was found to be the most exothermic [see Eqs. (4a), (5a), and (6a)]. This finding supports the observation that the C–S bond is the weakest link in the side-chain, and the cleavage of this bond initiates the degradation of the side chain. The sequence of reactions of the side-chain degradation of the PFSA ionomers (Nafion®, 3M and SSC) is given in Eqs. (4)–(6). The C–S bond cleavage of the anionic Nafion® ionomer in the presence of a •OH leaves the fragment with a hydroxyl end-group yielding (CF3)2CFOCF2CF(CF3)O(CF2)2OH, as shown in Eq. (4a). The reaction is exothermic releasing 38.3 kcal/mol of energy.
1. Nafion®

ΔEr = −38.3 kcal/mol,

ΔEr = −29.8 kcal/mol,

ΔEr = −8.2 kcal/mol,

ΔEr=−117.0 kcal/mol.
The fragment (CF3)2CFOCF2CF(CF3)O(CF2)2OH further reacts with •OH yielding various combinations of products according to the cleavage of the different bonds (e.g., C–C and C–O) in the fragment. The most probable one is given in Eq. (4b). This reaction shows that the fragment has the weakest link at the C–C bond of the tertiary carbon with –CF3 group as a pendant. The reaction yields an alcohol and a radical product releasing 29.8 kcal/mol of energy. The radical product has an unpaired electron on the secondary carbon atom that is stabilized by the presence of the more electronegative oxygen atom. The alcohol product, (CF3)2CFOCF2OH, has two oxygen atoms on the same carbon and is therefore unstable decomposing exothermically into (CF3)2CFOH and CF2O and releasing 8.2 kcal/mol of energy [see Eq. (4c)]. The fragment (CF3)2CFOH possesses part of the backbone and reacts with •OH according to Eq. (4d) releasing 117.0 kcal/mol of energy. The backbone fragments end with –OH and –CFO groups and are unstable in the •OH medium and further degrade in the oxidizing medium.
The sequence of reactions of the side-chain degradation of a 3M ionomer is shown in the following equations.
2. 3M membrane

ΔEr = −37.7 kcal/mol,

ΔEr = −30.3 kcal/mol,

ΔEr = −95.0 kcal/mol,

ΔEr = −4.5 kcal/mol.
Equation (5a) shows the C–S bond cleavage of a 3M ionomer in the presence of •OH. The reaction is exothermic and releases 39.7 kcal/mol of energy. This reaction results in an –OH end-group in the side-chain: (CF3)2CFO(CF2)4OH. Unlike Nafion®, the 3M membrane takes a different path after cleavage of the C–S bond. This alcohol product reacts with •OH splitting the backbone into two parts, as shown in Eq. (5b). The reaction releases 30.3 kcal/mol of energy. One part of the backbone terminates with a –OH group yielding CF3OH and the other is a radical (on the secondary carbon) fragment. This radical combines with a •OH yielding a diol, HOCF(CF3)O(CF2)4OH and 95.0 kcal/mol of energy, as shown in Eq. (5c). This product is unstable if the membrane is not sufficiently hydrated, because a carbon atom is bonded with two oxygen atoms. It further decomposes into CF3CFO and HO(CF2)4OH releasing 4.5 kcal/mol of energy, as shown in Eq. (5d). The fragment CF3CFO is a part of the backbone and can further degrade in the oxidizing medium of fuel cell. The other fragment HO(CF2)4OH is a diol and is a part of the side-chain detached from the backbone. This diol can also break into smaller molecules in the presence of the oxidizing medium.
The degradation of the side-chain of the SSC ionomer is similar to that of the 3M ionomer. The reaction sequence is shown in Eqs. (6a)–(6d).
3. SSC membrane

ΔEr = −39.1 kcal/mol,

ΔEr = −30.4 kcal/mol,

ΔEr = −94.5 kcal/mol,

ΔEr = −4.1 kcal/mol.
All the above reactions are exothermic and release 39.1, 30.4, 94.5, and 4.1 kcal/mol of energy, respectively.
The degradation reactions shown above suggest that the side-chains of PFSA membranes break into smaller species in the presence of a medium of •OH. The products of the degradation reactions are similar to the molecules found by Ghassemzadeh et al.Reference Ghassemadeh, Marrony, Barrera, Kreuer, Maier and Muller35 in their experimental studies. One of the reactions in the sequence of the side-chain degradation reactions causes scission in the membrane backbone and, as a consequence, the backbone ends with the –OH and –CFO end-groups. These end-groups are highly unstable in the oxidizing medium of the operating fuel cell and can produce a –COOH end-group in the backbone of PFSA membranes after oxidation leading to backbone degradation.
B. Kinetics of the C–S bond cleavage mechanism
In the above section, we found that the C–S bond is the weakest bond in the side-chain of PFSA membranes. Thus, side-chain degradation probably begins with cleavage of the C–S bond generating SO3 containing compounds, such as SO3, H2SO4, HSO4−, and •SO3−. A few experimental results show the presence of these compounds in the degradation products in fuel cell testing.Reference Ghassemzadeh, Kreuer, Maier and Muller39, Reference Carlsson, Jorissen and Tillmetz41 Some degradation modelsReference Schiraldi60, Reference Zhou, Guerra, Qiu, Zawodzinski and Schiraldi61 and experimental resultsReference Ghassemzadeh, Kreuer, Maier and Muller39 support the cleavage of other bonds generating sulfonic acid ending perfluoro-compounds. To study the mechanism of the C–S bond cleavage we selected the side-chain of a SSC ionomer, CF3O(CF2)2SO3H, as this fragment has the critical components of the side-chains of Nafion® and 3M ionomers; hence, the C–S bond degradation mechanism should be similar. The sulfonate terminated side chain can react with •OH and can either lead to the cleavage of C–S bond or produce a fragment radical, CF3O(CF2)2SO3•, which can further lead to the C–S bond cleavage via decomposition. The C–S bond cleavage by these mechanisms is discussed in the following subsections.
1. Reaction of CF3O(CF2)2SO3− with •OH
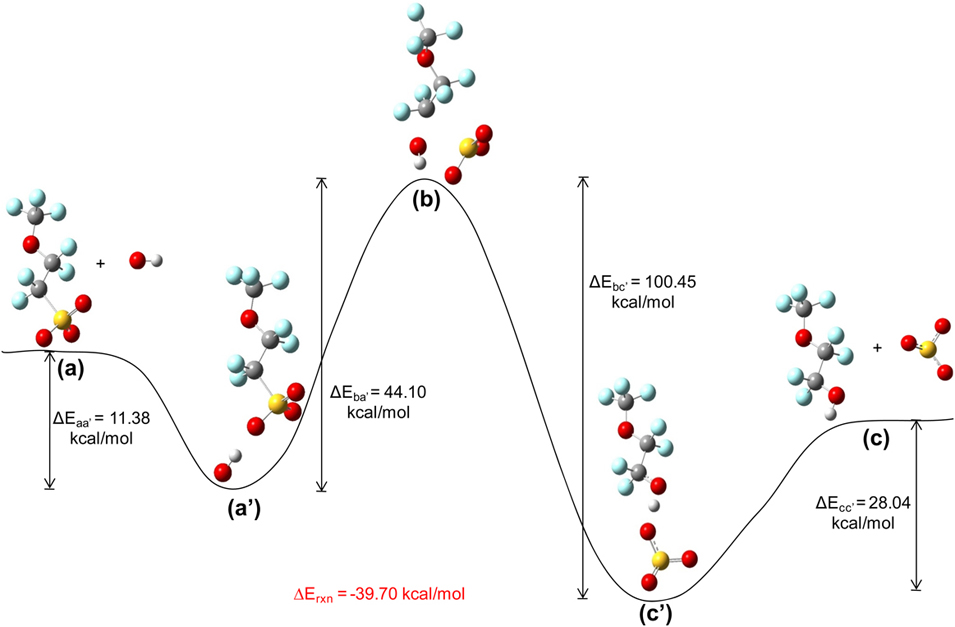
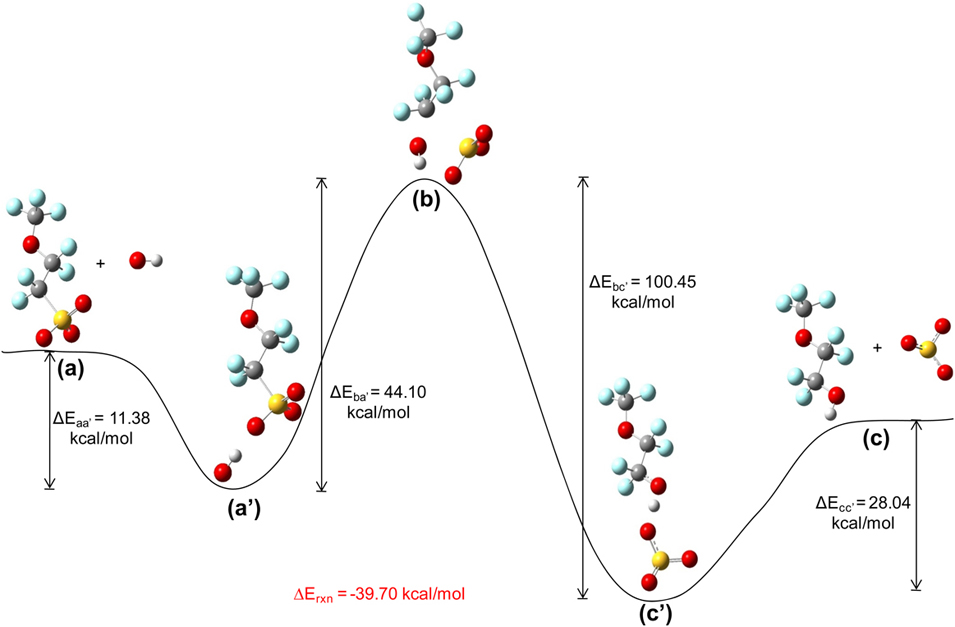
The reaction of CF3O(CF2)2SO3− with •OH produces CF3O(CF2)2OH and •SO3−. The schematics of the reaction mechanism along with the relative energies of the reactants, transition state, and products are shown in Fig. 2. The structure of the reactant- (or product-) complex was obtained by bringing structures of the reactants (or products) close to each other and fully optimizing the pair. The transition state structure was obtained by using the QST3 method with the geometries of the reactant complex and product complex. The figure shows that the transition state is 44.1 and 100.45 kcal/mol higher than the reactant- and product complexes, respectively. The reaction is exothermic releasing 39.7 kcal/mol of energy.
A schematic diagram of the potential energy surface for the reaction CF3O(CF2)2SO3−+ •OH → CF3O(CF2)2OH+ •SO3−. The structures shown are: (a) reactants; (a′)reactant complex; (b) transition state; (c′) product complex; and (c) products. All structures were optimized at theB3LYP/6-311++G** level of theory. Transition state (b) was determined by using the STQN method along with the geometries of reactant- and product complexes and validated by the determination of one imaginary frequency. ∆Exy = Ex – Ey, and is the change in energy of the system going from state y to state x. ∆Erxn is the energy of the reaction. Energy of reactants (a) [or products (c)] is the sum of internal energies of all reactants (or products).
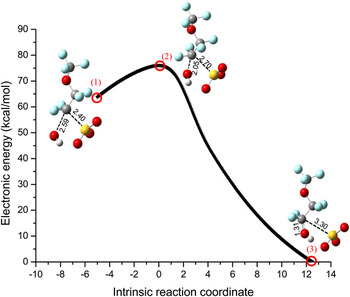
To confirm the connectivity of the transition state to the reactants and products, an IRC calculation was performed and the result is shown in Fig. 3. If the left side of the curve from the transition state is traversed the atomic distance between C and O increases from 2.05 to 2.59 Å and the distance between C and S decreases from 2.70 to 2.40 Å. This shows that the •OH is moving away and –SO3− is coming closer to CF3O(CF2)2 forming reactants; thus, the transition state connects to the reactants. If the right side of the curve is traversed, the atomic distance between C and O decreases from 2.05 to 1.31Å forming a C–O bond; i.e., a CF3O(CF2)2OH molecule, and the distance between C and S increases from 2.70 to 3.30 Å forming •SO3−; thus, the transition state connects to the products.
The potential energy surface for the reaction CF3O(CF2)2SO3− + •OH → CF3O(CF2)2OH + •SO3−obtained from an IRC calculation at the transition state. The calculation was performed at B3LYP/6-311++G** level of theory. The structures shown indicate the points marked by red circles. The structure (2) is the transition state and is the same as the structure (b) in Fig. 2. Structures (1) and (3) represent reactant- and product-sides, respectively. The atomic distances are in Angstrom (Å). The electronic energy was calculated with respect to the energy of structure (3). The movement of atoms, S and O, along the curve confirms that the transition state connects reactants and products.

The high activation energy indicates that this reaction is very slow. Hence, it is almost impossible to break C–S bond via this mechanism.
2. Decomposition of CF3O(CF2)2SO3•
The anionic side-chain fragment, CF3O(CF2)2SO3−, can react with •OH via the abstraction of an electron generating CF3O(CF2)2SO3• and OH−.Reference Ghassemzadeh, Kreuer, Maier and Muller39 The hydroxide ion is neutralized by the acidic medium in the membrane forming H2O. The radical fragment can decompose with the cleavage of the C–S bond producing CF3O(CF2)2• and SO3. This mechanism is in agreement with the ESR experiments on UV-induced Fenton-treated membranes producing –O(CF2)2SO3•and–O(CF2)2•.Reference Bosnjakovic, Kadirov and Schlick12, Reference Kadirov, Bosnjakovic and Schlick40 The structure of SO3 is pyramidal in CF3O(CF2)2SO3• and is planar in the SO3 molecule.
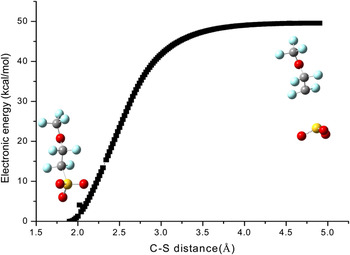
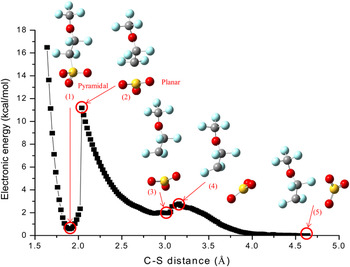
To understand the mechanism of the structural change of SO3 and, thus, the cleavage of the C–S bond in the radical fragment, a PES was performed on the optimized radical fragment, CF3O(CF2)2SO3•, by increasing the C–S bond distance. The scanned energy is shown in Fig. 4. The figure shows that the potential energy increases with increasing atomic distance and achieves a plateau. Approximately 50 kcal/mol is required to break the C–S bond and hence the reaction will be very slow. The structure of the SO3 fragment does not change during the scan even if the C…S distance is made greater than 4.5Å. The transition state structure could not be determined by this method. This scanned potential energy curve does not give enough information for the reaction mechanism. To understand the C–S bond cleavage mechanism and the structural change of SO3, the PES of the optimized product complex, CF3O(CF2)2•…SO3, was performed by decreasing the C–S atomic distance. The resulting potential energy profile and associated structures is shown in Fig. 5. The change in the structure of the product complex is also shown. Structure (5) represents the optimized product complex. If the atomic distance between C and S is reduced, the lateral movement of the SO3 occurs, and the potential energy of the complex increases. The energy reaches a local maxima at structure (4). Further decrease of the C…S distance lowers the potential energy, and at structure (3), the energy attains local minima. The structural change of the product complex from (5) to (3) shows the lateral movement of SO3 along with its axial movement. The structure of SO3 does not change in this course. If the C–S atomic distance is further decreased, only axial movement of SO3 occurs. The potential energy increases and attains other local maxima, which is also a global maximum, at structure (2). The potential energy decreases sharply if the C–S distance is further decreased in this structure. This is due to a change in the molecular geometry of the sulfonate group from trigonal pyramidal to trigonal planar. The structure (1) represents the radical fragment CF3O(CF2)2SO3•. The calculations indicate that ∼11 kcal/mol energy is required to attain the structure (2) from structure (1), which can lead to the cleavage of the C–S bond in the membrane fragment.
The potential energy surface scan of CF3O(CF2)2SO3• by increasing the C–S bond distance. The calculation was performed at B3LYP/6-311++G** level of theory. The structures shown refer to the initial and final points on the curve. The electronic energy was calculated with respect to the energy of structure at the initial point. The energy of the system increases with increasing C–S bond distance and reaches a plateau. The shape of SO3 remains trigonal pyramidal.

The potential energy profile for change of C–S distance in CF3O(CF2)2SO3•. The structures on the curve represent the structures of the complex, CF3O(CF2)2•…SO3, at the points denoted by red circles. The PES scan calculation was performed at B3LYP/6-311++G** level of theory by decreasing the C–S bond distance in the complex, CF3O(CF2)2•…SO3,starting from structure (5). The shape of SO3groupremains trigonal planar molecular geometry up to structure (2), but it changes to trigonal pyramidal at structure (1) with a steep decrease in energy of ∼11 kcal/mol. This energy is the activation energy to break the C–S bond of CF3O(CF2)2SO3•. The electronic energy was calculated with respect to the energy of structure (5).

The activation energy in this case is ∼11 kcal/mol, and this energy is required to change the geometry of SO3 from trigonal pyramidal to trigonal planar structure. The activation energy is much lower than that obtained in the first mechanism, but still quite high. It seems that the C–S bond cleavage via this mechanism is energetically possible, but kinetically hindered.
IV. CONCLUSIONS
Side-chain degradation of PFSA membranes was examined through extensive electronic structures. Calculated homolytic bond cleavage energies of the side-chain fragments of three different PFSA ionomers suggest that the degradation starts with the cleavage of the C–S bond as this bond was found to have the lowest dissociation energy (∼58–61 kcal/mol). Analysis of the reactions associated with the chemical degradation of the side chain due to reaction with a hydroxyl radical indicate that the first step involves the abstraction of an electron from the sulfonate anion end group of the side-chain. It was further determined that the cleavage of the C–S bond is accompanied by change in the symmetry of the SO3 from trigonal?pyramidal to trigonal?planar. However, this final step may be kinetically hindered due to the rather high energy barrier associated with the bond cleavage ∼11 kcal/mol.
ACKNOWLEDGMENTS
This work was supported by the U.S. Department of Energy under the Energy Efficiency and Renewable Energy (EERE) program and through the Sustainable Energy Education and Research Center (SEERC) at the University of Tennessee.