


1. Introduction
The flow past bodies moving along solid surfaces has captured the interest of scholars over the last decades, due to its relevance from both a fundamental and an applicative viewpoint (Thompson, Leweke & Hourigan Reference Thompson, Leweke and Hourigan2021). Indeed, it is a relevant element in many applications where an object moving in a fluid interacts with a near wall. Examples are the industrial processes of surface manufacturing such as polishing and sand blasting, and the flow past cars or trains, to cite just a few.
The proximity to the wall changes the structure of the flow and influences the wake transition mechanism (Stewart et al. Reference Stewart, Thompson, Leweke and Hourigan2010b). In free stream, the primary instability of the two-dimensional flow past a bluff body is a Hopf bifurcation leading a symmetric steady state towards a time-periodic state that gives origin to the von Kármán vortex shedding (Noack & Eckelmann Reference Noack and Eckelmann1994). Although the triggering mechanism is not fully understood yet, it is known that it is the result of a global instability (Jackson Reference Jackson1987; Monkewitz & Nguyen Reference Monkewitz and Nguyen1987; Monkewitz Reference Monkewitz1988). Increasing the Reynolds number  $Re=U_\infty D/\nu$ (here
 $U_\infty$ is the free stream velocity,
 $D$ the cylinder thickness and
 $\nu$ the kinematic viscosity), the unsteady flow undergoes a secondary instability and becomes three-dimensional. The circular cylinder is the natural prototype of a bluff body, due to its simple geometry, and has been extensively investigated over the years (Zdravkovich Reference Zdravkovich1997). The first bifurcation occurs at a Reynolds number of
 $Re \approx 47$ (Provansal, Mathis & Boyer Reference Provansal, Mathis and Boyer1987). The secondary instability occurs at
 $Re \approx 190$ due to the so-called mode A, and a second three-dimensional mode, i.e. mode B, becomes unstable at a slightly larger
 $Re$ (Barkley & Henderson Reference Barkley and Henderson1996; Williamson Reference Williamson1996a,Reference Williamsonb). In proximity of a wall, depending on the gap height, the low-
 $Re$, steady two-dimensional flow may bifurcate either towards an unsteady two-dimensional state through the Hopf bifurcation or towards a steady three-dimensional state through a regular bifurcation. In fact, when the distance from the ground is reduced, the absolute instability causing the von Kármán instability weakens, and a steady three-dimensional mode appears (Bearman & Zdravkovich Reference Bearman and Zdravkovich1978; Price et al. Reference Price, Sumner, Smith, Leong and Païdoussis2002). For the circular cylinder, Rao et al. (Reference Rao, Thompson, Leweke and Hourigan2013) found that the flow bifurcates first towards a steady three-dimensional state for
 $g=G/D \lessapprox 0.25$ (here
 $G$ denotes the gap height). For
 $g \gtrapprox 0.25$, they observed that the flow becomes first unstable through a Hopf bifurcation, and that the shedding frequency of the ensuing two-dimensional periodic state increases (by approximately
 $0.014D/U_\infty$) when the distance from the ground is reduced from
 $g=4$ to
 $g \approx 1$, and decreases for smaller
 $g$. Huang & Sung (Reference Huang and Sung2007) report the same dependence of the shedding frequency on the gap height for a Reynolds number up to
 $Re =600$. Rao et al. (Reference Rao, Thompson, Leweke and Hourigan2015b) considered the flow past a rotating cylinder translating near a wall. For small gaps, they found that forward rotations promote the onset of three-dimensionality, namely the Reynolds number of its first onset decreases with respect to the non-rotating cylinder, while reverse rotations produce the opposite effect, namely a delay of the onset of three-dimensionality to higher Reynolds numbers. Similar results were obtained by Stewart et al. (Reference Stewart, Thompson, Leweke and Hourigan2010a,Reference Stewart, Thompson, Leweke and Houriganb) in the limit of null gap height, when investigating circular cylinders and spheres rolling over a wall. For the circular cylinder translating with null rotating velocity, Stewart et al. (Reference Stewart, Thompson, Leweke and Hourigan2010b) found that the transition to unsteady flow is delayed to
 $Re \approx 160$, while the onset of three-dimensionality occurs at
 $Re \approx 70$. Several authors found that the proximity to the wall suppresses the wake vortex shedding also at larger Reynolds numbers. For the non-rotating circular cylinder, Huang & Sung (Reference Huang and Sung2007) found that the critical gap height below which the Hopf bifurcation is suppressed is almost invariably
 $g \approx 0.25$ up to
 $Re=600$. Experimental investigations at larger Reynolds numbers showed that the scenario does not change in the turbulent regime, and that the critical gap height is almost independent on
 $Re$ (Nishino, Roberts & Zhang Reference Nishino, Roberts and Zhang2007).
Rao, Thompson & Hourigan (Reference Rao, Thompson and Hourigan2016) referred to the three-dimensional regular bifurcation as mode E. They speculated that this mode is the universal primary three-dimensional instability in the flow around two-dimensional bluff bodies, irrespective of the flow configuration. They noticed that mode E is actually observed only when the two-dimensional Hopf bifurcation is delayed or suppressed. For the circular cylinder, for instance, this occurs when the isolated cylinder rotates with a non-dimensional rotation rate  $\alpha =\omega D/(2 U) \gtrapprox 5$ (Rao et al. Reference Rao, Radi, Leontini, Thompson, Sheridan and Hourigan2015a), or when it is near to a wall with
 $g \lessapprox 0.2$ (Rao et al. Reference Rao, Thompson, Leweke and Hourigan2015b). Rao et al. (Reference Rao, Thompson, Leweke and Hourigan2015b) observed this mode to be continuous across the parameter range investigated. However, they conjectured that the mechanism triggering this instability changes depending on the flow set-up. For a slowly rotating cylinder in free stream, they found that mode E has some similarities with the Crow instability (Crow Reference Crow1970) of a counter-rotating vortex pair. In contrast, for large rotation rates, the hyperbolic instability plays a role in the triggering mechanism, as the base flow qualitatively changes and the stagnation point detaches from the cylinder surface (Pralits, Giannetti & Brandt Reference Pralits, Giannetti and Brandt2013). Considering a cylinder rolling over a wall, Stewart et al. (Reference Stewart, Thompson, Leweke and Hourigan2010b) propose that the regular three-dimensional instability is elliptic, as both the wavelength and the perturbation fields resemble that expected by the theory (Kerswell Reference Kerswell2002).
Most of the works present in the literature dealing with two-dimensional bluff bodies translating near a wall have considered circular and square cylinders only. However, as stated by Thompson et al. (Reference Thompson, Leweke and Hourigan2021), studies dealing with different geometries are needed to extend the current knowledge to a broader set of applications. The effect of the wall proximity on the flow past rectangular cylinders is expected to be more complicated, and it is of great interest for a large number of applications, especially in the field of wind engineering. Despite the simple geometry, the flow past rectangular cylinders presents features of the flow past more complex geometries, such as separation induced by the cylinder edges, several recirculating regions and, depending on the Reynolds number, a shear layer instability and an unstable wake. In free stream, already at Reynolds numbers less than  $200$, the flow dynamics changes with the aspect ratio
 ${A{\kern-4pt}R} =L/D$, where
 $L$ and
 $D$ are the streamwise and vertical dimensions of the cylinder. Chiarini, Quadrio & Auteri (Reference Chiarini, Quadrio and Auteri2021) investigated the primary instability of the flow past isolated rectangular cylinders and detailed its dependence on the aspect ratio. They found that the critical Reynolds number corresponding to the first onset of the Hopf bifurcation increases with
 ${A{\kern-4pt}R}$, meaning that a longer cylinder leads to a more stable flow. At intermediate Reynolds numbers, i.e.
 $Re \approx 300\unicode{x2013}400$, the flow is time-periodic and the dependence of the flow on
 ${A{\kern-4pt}R}$ is even more evident. For
 ${A{\kern-4pt}R} >3$, vortex shedding occurs from both the leading-edge (LE) and the trailing-edge (TE) corners and the two phenomena lock to the same frequency (Nakamura & Nakashima Reference Nakamura and Nakashima1986; Hourigan, Thompson & Tan Reference Hourigan, Thompson and Tan2001). However, the interaction of the LE and TE vortices changes with the length of the cylinder and depends on whether the two phenomena are in phase or out of phase (Chiarini, Quadrio & Auteri Reference Chiarini, Quadrio and Auteri2022c). The vortex shedding from the LE corners also influences the secondary instability of the flow leading to three-dimensionality. Unlike for circular and short square cylinders and for elongated cylinders with elliptic leading edge (Robichaux, Balachandar & Vanka Reference Robichaux, Balachandar and Vanka1999; Ryan, Thompson & Hourigan Reference Ryan, Thompson and Hourigan2005), for elongated rectangular cylinders, the onset of three-dimensionality is due to an almost subharmonic mode triggered by the non-viscous interaction of the LE vortices simultaneously placed over the longitudinal side of the cylinder (Chiarini, Quadrio & Auteri Reference Chiarini, Quadrio and Auteri2022a).
In this work, a comprehensive study of the primary instability of the two-dimensional steady flow past rectangular cylinders moving along a solid wall is provided. The aspect ratio of the cylinder is varied in the range  $0.5 \le {A{\kern-4pt}R} \le 7$, while the gap height varies in the range
 $0.125 \le g \le 10$. The structure of the paper is as follows. In § 2, the mathematical formulation and the numerical methods employed are briefly presented. Section 3 describes the effect of wall proximity on the low-
 $Re$ steady base flow for different
 ${A{\kern-4pt}R}$. Then the influence of
 ${A{\kern-4pt}R}$ and
 $g$ on both the Hopf bifurcation and the three-dimensional regular bifurcation is addressed in § 4. In § 5, the mechanism triggering the three-dimensional regular bifurcation for small gaps is discussed, for both short and elongated cylinders. For this purpose, a local asymptotic analysis on the closed streamlines of the base flow, which relies on the short-wavelength approximation developed by Bayly (Reference Bayly1988), is used. In § 6, some concluding remarks are provided.
2. Problem formulation and numerical method
2.1. Flow configuration
The incompressible flow over a two-dimensional rectangular cylinder moving parallel to a wall is considered; see the schematic representation in figure 1. A Cartesian reference system moving with the body, with the origin set at the bottom leading-edge corner of the rectangle, is used, with the  $x$ axis aligned with the streamwise direction, the
 $y$ axis denoting the cross-stream direction and the
 $z$ axis indicating the spanwise direction. The cylinder has streamwise length
 $L$ and thickness
 $D$, and moves with velocity
 $U_\infty$ from right to left at a gap height
 $G$ from the wall. The Reynolds number is based on the cylinder thickness
 $D$ and
 $U_\infty$, and is defined as
 $Re=U_\infty D/ \nu$, where
 $\nu$ is the kinematic viscosity. The aspect ratio of the cylinder
 ${A{\kern-4pt}R} =L/D$ is varied in the range
 $0.5 \le {A{\kern-4pt}R} \le 7$, while the dimensionless gap height
 $g=G/D$ varies in the range
 $0.125 \le g \le 10$. Reynolds numbers up to
 $Re=300$ are considered. The fluid motion is described by the unsteady incompressible Navier–Stokes equations:
 \begin{equation} \left.\begin{aligned}
&\dfrac{\partial \boldsymbol{u}}{\partial t} + \boldsymbol{u} \boldsymbol{\cdot} \boldsymbol{\nabla}
\boldsymbol{u} =- \boldsymbol{\nabla} p + \dfrac{1}{Re} \nabla^2 \boldsymbol{u}, \\
&\boldsymbol{\nabla} \boldsymbol{\cdot} \boldsymbol{u}=0, \end{aligned}\right\} \end{equation}
where  $\boldsymbol {u}=(u,v,w)$ is the velocity vector and
 $p$ is the reduced pressure. In the following, if not otherwise indicated, all quantities are made dimensionless with the cylinder thickness
 $D$ and with the free stream velocity
 $U_\infty$.
Sketch of the computational domain with the geometry and the reference system.

2.2. Global stability analysis
The onset of the instability is studied via linear theory and a normal-mode analysis (Theofilis Reference Theofilis2011). The velocity and the pressure are decomposed in a two-dimensional time-independent base flow  $\{\boldsymbol {U},P\}$ and a small three-dimensional unsteady perturbation
 $\{\boldsymbol {u}',p'\}$:
 \begin{equation} \left.\begin{gathered} \boldsymbol{u}(x,y,z,t)=\boldsymbol{U}(x,y)+\frac{\epsilon}{2{\rm \pi}} \int_{-\infty}^{\infty} \boldsymbol{u}'(x,y,\beta,t)\exp({\rm i} \beta z)\,\text{d} \beta, \\ p(x,y,z,t)=P(x,y)+\frac{\epsilon}{2{\rm \pi}} \int_{-\infty}^{\infty} p'(x,y,\beta,t) \exp({\rm i} \beta z)\,\text{d} \beta, \end{gathered}\right\} \end{equation}
where the amplitude  $\epsilon$ is assumed to be small and the Fourier transform is used to deal with the homogeneous spanwise direction. The base flow is governed by the steady two-dimensional incompressible Navier–Stokes equations. In a global, normal mode stability analysis, the unsteady perturbations are assumed in the following form:
 \begin{equation} \boldsymbol{u}'(\boldsymbol{x},\beta,t)=\hat{\boldsymbol{u}}(\boldsymbol{x},\beta)\exp(\gamma t) \quad\text{and}\quad p'(\boldsymbol{x},\beta,t)=\hat{p}(\boldsymbol{x},\beta)\exp(\gamma t), \end{equation}
where  $\gamma$ is a complex number and
 $\{\hat {\boldsymbol {u}},\hat {p}\}$ is the global (direct) mode. Introducing this decomposition into the Navier–Stokes equations and collecting terms of order
 $\epsilon$,
 $\{\hat {\boldsymbol {u}},\hat {p}\}$ is found to satisfy the linearised unsteady Navier–Stokes equations
 \begin{equation} \left.\begin{aligned}
&\gamma \hat{\boldsymbol{u}} + \boldsymbol{L}_\beta \{ \boldsymbol{U},Re \} \hat{\boldsymbol{u}} +
\boldsymbol{\nabla}_\beta \hat{p} = 0 \\
&\boldsymbol{\nabla}_\beta \boldsymbol{\cdot}
\hat{\boldsymbol{u}}=0, \end{aligned}\right\} \end{equation}
where  $\boldsymbol {\nabla }_\beta \equiv (\partial /\partial x, \partial /\partial y, \textrm {i}\beta )$ is the Fourier-transformed gradient operator and
 $\boldsymbol {L}_\beta$ stands for the Fourier-transformed linearised Navier–Stokes operator
 \begin{equation} \boldsymbol{L}_\beta \{ \boldsymbol{U},Re \} \hat{\boldsymbol{u}} = \boldsymbol{U} \boldsymbol{\cdot} \boldsymbol{\nabla}_\beta \hat{\boldsymbol{u}} + \hat{\boldsymbol{u}} \boldsymbol{\cdot} \boldsymbol{\nabla}_\beta \boldsymbol{U} - \frac{1}{Re} \boldsymbol{\nabla}_\beta^2 \hat{\boldsymbol{u}}. \end{equation}
The flow stability is ascertained by the solution of the generalised eigenvalue problem (2.4) for the complex frequency  $\gamma$. When the real part of
 $\gamma$ is negative,
 $\mbox {Re}(\gamma )<0$, the flow is stable, while when
 $\mbox {Re}(\gamma )>0$, the associated global mode is unstable and grows exponentially in time. When
 $\beta =0$, the global mode is two-dimensional.
2.3. Asymptotic inviscid stability theory
A theory for studying local stability is used in § 5 to describe the evolution of the three-dimensional regular instability for small gap heights. The analysis relies on the short-wavelength approximation (WKBJ) developed by Bayly, Orszag & Herbert (Reference Bayly, Orszag and Herbert1988). This theory has been successfully used to study elliptic, hyperbolic and centrifugal instabilities of two-dimensional base flows (Sipp, Lauga & Jacquin Reference Sipp, Lauga and Jacquin1999) and to characterise the primary three-dimensional instability of the flow past a bump (Gallaire, Marquillie & Ehrenstein Reference Gallaire, Marquillie and Ehrenstein2007) and of an open cavity flow (Citro et al. Reference Citro, Giannetti, Brandt and Luchini2015), and the secondary instability of the periodic wake past a circular cylinder (Giannetti Reference Giannetti2015), to cite a few. In the following, this approach is briefly presented; for a detailed description, the reader is referred to the work of Lifschitz & Hameiri (Reference Lifschitz and Hameiri1991). In this theory, the velocity and pressure perturbation is the solution of the linearised Euler equations, and is sought in the form of a localised rapidly oscillating wavepacket evolving along a closed Lagrangian trajectory  $\boldsymbol {X}(t)$, such that
 \begin{equation} \left.\begin{gathered} \boldsymbol{u}(\boldsymbol{X}(t),t)=\boldsymbol{a}(\boldsymbol{X}(t),t,\epsilon)\exp({{\rm i}\phi(\boldsymbol{X}(t),t)/\epsilon}) \\ =\sum_{n} \boldsymbol{a}_n(\boldsymbol{X}(t),t)\epsilon^n \exp({{\rm i}\phi(\boldsymbol{X}(t),t)/\epsilon}), \\ p(\boldsymbol{X}(t),t) = b(\boldsymbol{X}(t),t,\epsilon)\exp({{{\rm i}\phi(\boldsymbol{X}(t),t)/\epsilon}}) \\ =\sum_n b_n(\boldsymbol{X}(t),t)\epsilon^{n+1} \exp({{\rm i}\phi(\boldsymbol{X}(t),t)/\epsilon}), \end{gathered}\right\} \end{equation}
where  $\boldsymbol {k}(t)=\boldsymbol {\nabla }\phi (\boldsymbol {X}(t),t)$ is the wave vector,
 $\boldsymbol {a}(\boldsymbol {X}(t),t)$ and
 $b(\boldsymbol {X}(t),t)$ are the velocity and pressure envelopes, and
 $\epsilon \ll 1$. Following Bayly et al. (Reference Bayly, Orszag and Herbert1988), in the limit of vanishing viscosity (
 $Re \rightarrow \infty$) and large wavenumber (
 $|\boldsymbol {k}| \rightarrow \infty$), the leading-order term for the growth rate associated with any closed streamline is evaluated by integrating the following set of equations:
 $$\begin{gather} \frac{{\rm D} \boldsymbol{k}}{{\rm D} t} =- \boldsymbol{L}^{{\rm T}}(\boldsymbol{X}(t))\boldsymbol{k}, \end{gather}$$
 $$\begin{gather}\frac{{\rm D} \boldsymbol{a}}{{\rm D} t} = \left(\frac{2 \boldsymbol{k}\boldsymbol{k}^{\rm T}}{|\boldsymbol{k}|^2} - \boldsymbol{I}\right) \boldsymbol{L}(\boldsymbol{X}(t))\boldsymbol{a}, \end{gather}$$
where
 \begin{equation}
\left.\begin{aligned}
&\dfrac{D \boldsymbol{X}}{D t} = \boldsymbol{U}(\boldsymbol{X}(t),t),\\
&\boldsymbol{X}(t=0)=\boldsymbol{x}_0 \end{aligned}\right\}
\end{equation}
identifies the selected Lagrangian trajectory and  $\boldsymbol {L}(\boldsymbol {X}(t),t)$ is the velocity-gradient matrix evaluated at the position
 $\boldsymbol {X}(t)$ at time
 $t$. Note that, in the present case, since the base flow is steady, the Lagrangian trajectories correspond to the flow streamlines. Two initial conditions have to be considered to solve the problem, i.e.
 $\boldsymbol {k}(t=0)=\boldsymbol {k}_0$ and
 $\boldsymbol {a}(t=0)=\boldsymbol {a}_0$.
A sufficient condition for inviscid instability is that the system (2.7)–(2.8) has at least one solution such that  $|\boldsymbol {a}| \rightarrow \infty$ when
 $t \rightarrow \infty$ (Lifschitz & Hameiri Reference Lifschitz and Hameiri1991). Since, in the present case, the base flow is two-dimensional, the third column of
 $\boldsymbol {L}$ is zero and, therefore, the transverse component of
 $\boldsymbol {k}$, i.e.
 $k_z=\beta$, remains constant as the time advances. The in-plane components of
 $\boldsymbol {k}$ evolve under the action of the deformation tensor. Generally, one has to solve first the equation for
 $\boldsymbol {k}$ and then the amplitude
 $\boldsymbol {a}$ can be found integrating the second equation. However, Bayly (Reference Bayly1988), Lifschitz & Hameiri (Reference Lifschitz and Hameiri1991) and Sipp & Jacquin (Reference Sipp and Jacquin2000) have shown that centrifugal and hyperbolic instabilities reach their maximum growth rate for purely transverse wavenumbers. Therefore, following Gallaire et al. (Reference Gallaire, Marquillie and Ehrenstein2007) and Citro et al. (Reference Citro, Giannetti, Brandt and Luchini2015), in the following, only solutions with
 $\boldsymbol {k}$ orthogonal to the base flow are considered, which are called pressureless modes (Godeferd, Cambon & Leblanc Reference Godeferd, Cambon and Leblanc2001). With this assumption, (2.8) reduces to
 \begin{equation} \frac{{\rm D} \boldsymbol{a}}{{\rm D} t} = \tilde{\boldsymbol{L}}(\boldsymbol{X}(t))\boldsymbol{a}, \end{equation}
where
 \begin{equation} \tilde{\boldsymbol{L}} = \begin{bmatrix} -1 & 0 & 0 \\ 0 & -1 & 0 \\ 0 & 0 & 1 \end{bmatrix} \boldsymbol{L}. \end{equation}
In this work, the self-excited nature of the three-dimensional regular instability is investigated by applying this theory on closed orbits/streamlines within the flow recirculating regions. Therefore, (2.10) reduces to a linear ordinary differential equation (ODE) with periodic coefficients that can be solved using the Floquet theory. First, the fundamental Floquet matrix  $\boldsymbol {A}(T)$ is built by solving the system
 \begin{equation} \frac{{\rm D} \boldsymbol{A}}{{\rm D} t} = \tilde{\boldsymbol{L}}(\boldsymbol{X}(t)) \boldsymbol{A} \quad \text{with}\ \boldsymbol{A(0)}=\boldsymbol{I}. \end{equation}
Then the growth rate is extracted by evaluating the Floquet exponents associated with the eigenvalues  $\mu _1 (\boldsymbol {x}_0)$,
 $\mu _2 (\boldsymbol {x}_0)$ and
 $\mu _3 (\boldsymbol {x}_0)$, and eigenvectors
 $\boldsymbol {a}_1(\boldsymbol {x}_0)$,
 $\boldsymbol {a}_2(\boldsymbol {x}_0)$ and
 $\boldsymbol {a}_3(\boldsymbol {x}_0)$ of the
 $\boldsymbol {A}(T(\boldsymbol {x}_0))$ matrix. Since the base flow is two-dimensional and the wave vector
 $\boldsymbol {k}$ is orthogonal to the base flow, one Floquet multiplier is always
 $\mu _3=1$ and the associated eigenvector
 $\boldsymbol {a}_3=\hat {\boldsymbol {e}}_z$. For the incompressibility constraint, the other two multipliers are reciprocal of each other, i.e.
 $\mu _1(\boldsymbol {x}_0)=1/\mu _2(\boldsymbol {x}_0)$. Eventually, the
 $i_{th}$ Floquet exponent
 $\sigma _i(\boldsymbol {x}_0)$ is obtained from the
 $i_{th}$ Floquet multiplier
 $\mu _i(\boldsymbol {x}_0)$ by the following relation:
 \begin{align} \sigma_i(\boldsymbol{x}_0) = \mbox{Re}(\sigma_i(\boldsymbol{x}_0)) + {\rm i}\mbox{Im}(\sigma_i(\boldsymbol{x}_0)) = \frac{\log (\mu_i(\boldsymbol{x}_0 ))}{T{\boldsymbol{x}_0}} + {\rm i}\frac{2 n {\rm \pi}}{T(\boldsymbol{x}_0)} \quad\text{with}\ n=1,2,3..., \end{align}
where  $T(\boldsymbol {x}_0)$ indicates the revolution period of the closed orbit passing for
 $\boldsymbol {x}_0$. The growth rate is given by the real part of the Floquet exponent, i.e.
 $\sigma _{i,r}(\boldsymbol {x}_0)=\mbox {Re}(\sigma _i (\boldsymbol {x}_0))$, while the frequency is given by the imaginary part, i.e.
 $\sigma _{i,i}(\boldsymbol {x}_0) = \mbox {Im}(\sigma _i (\boldsymbol {x}_0) )$.
2.4. The numerical method
The results of the global stability analysis presented in this work are obtained with the numerical code used and validated by Chiarini et al. (Reference Chiarini, Quadrio and Auteri2021). In the numerical set-up, a reference frame moving with the cylinder is used. In this non-accelerating frame, the free stream and the bottom wall move at uniform speed  $U_\infty$ and the cylinder stands still. For the base flow, therefore, the velocity field is set to
 $\boldsymbol {U}=(U_\infty,0,0)$ on all boundaries of the computational domain, except for the outlet boundary, where outflow boundary conditions
 \begin{equation} P\boldsymbol{n} - \frac{1}{Re} \boldsymbol{\nabla} \boldsymbol{U} \boldsymbol{\cdot} \boldsymbol{n}=0 \end{equation}
are used;  $\boldsymbol {n}$ denotes the surface normal vector. Similarly, the perturbation velocity field is set to zero on all the boundaries, except at the outlet boundary, where the same outflow boundary condition (2.14) is used.
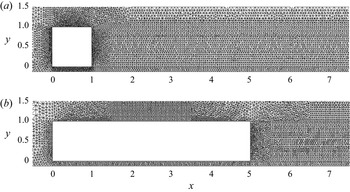
The base flow is obtained by solving the two-dimensional, steady version of the Navier–Stokes equations (2.1) using Newton's iteration. A finite-element formulation is employed using quadratic elements (P2) for the velocity and linear elements (P1) for the pressure. The used numerical method is implemented in the non-commercial software FreeFem++ (Hecht Reference Hecht2012). The distribution and size of the triangles have been chosen to properly refine the region close to the cylinder and close to the wall, paying particular attention to the near-corner regions and to the wake (see figure 26 in the Appendix). Depending on the aspect ratio and the gap height, the number of triangles varies between  $5.5 \times 10^4$ and
 $12 \times 10^4$, with the minimum being for
 ${A{\kern-4pt}R} =0.5$ and
 $g=0.125$, and the maximum for
 ${A{\kern-4pt}R} =7$ and
 $g=10$. Then, the generalised eigenvalue problem (2.4) is solved using the implicitly restarted Arnoldi algorithm implemented in the ARPACK package (Lehoucq, Sorensen & Yang Reference Lehoucq, Sorensen and Yang1998). The simple shift-invert power iteration method (Saad Reference Saad2011) is used when only one eigenvalue is required.
The computational domain extends in the ranges  $-25 \le x \le 80$ and
 $-g \le y \le 80$ in the two directions corresponding to
 $L_x=105$ and
 $L_y=80+g$; the cylinder is placed at
 $0 \le x \le {A{\kern-4pt}R}$ and
 $0 \le y \le 1$. (Recall that lengths are made dimensionless with the cylinder thickness
 $D$.) These dimensions have been shown to be more than adequate to investigate the onset of the first bifurcation for elongated cylinders up to
 ${A{\kern-4pt}R} =30$ in free stream (Chiarini et al. Reference Chiarini, Quadrio and Auteri2021; Chiarini, Quadrio & Auteri Reference Chiarini, Quadrio and Auteri2022b). In the Appendix, the sensitivity of the results on both the grid resolution and domain size is assessed.
3. Base flow
The proximity to the wall modifies the low- $Re$, steady, two-dimensional flow and, therefore, changes the sequence of bifurcations the flow undergoes at larger
 $Re$. Indeed, the primary instability consists of a Hopf bifurcation towards a two-dimensional unsteady state for
 $g \ge 0.5$ (red surface in figure 2) and of a regular bifurcation towards a steady three-dimensional state for smaller
 $g$ (blue surface in figure 2).
Qualitative description of the flow bifurcation scenario in the  ${A{\kern-4pt}R} - g- Re$ parameter space. The neutral surface of the first two-dimensional instability is depicted in red, while the neutral curve of the first three-dimensional instability is in blue.

The effect of the proximity to the ground on the low- $Re$, steady, two-dimensional flow is detailed in figure 3 for
 ${A{\kern-4pt}R} =1$ and
 ${A{\kern-4pt}R} =5$ at
 $Re=45$ and
 $Re=99$, respectively, which approximately correspond to the first onset of the primary instability in free stream (Chiarini et al. Reference Chiarini, Quadrio and Auteri2021). These aspect ratios have been considered as they are representative of short and elongated cylinders. As shown in figure 2 and detailed in § 4, for
 ${A{\kern-4pt}R} =1$ and
 $g >2$ (
 ${\le }2$), the critical Reynolds number corresponding to the first onset of the primary bifurcation is
 $Re_c \approx 45$ (
 ${>}45$). For
 ${A{\kern-4pt}R} =5$ and
 $g \ge 1$ (
 ${<}1$),
 $Re_c \le 99$ (
 ${>}99$). Grey diamonds are used for elliptical stagnation points, corresponding to a local maximum or minimum of the streamfunction
 $\psi$ defined as
 $\nabla ^2 \psi = -\varOmega _z$, where
 $\varOmega _z=\partial V/\partial x - \partial U/\partial y$ is the spanwise vorticity; they identify the recirculating regions of the flow. Green diamonds refer to hyperbolic stagnation points, corresponding to saddle points of
 $\psi$.
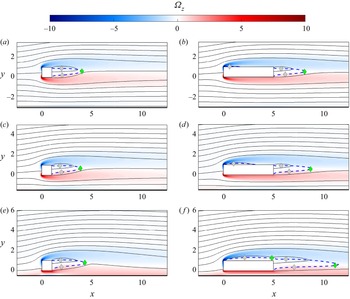
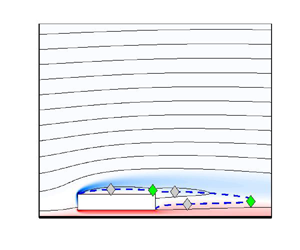
Streamlines superimposed on the vorticity map for (a,c,e)  ${A{\kern-4pt}R} =1$ at
 $Re=45$ and (b,d,f)
 ${A{\kern-4pt}R} =5$ at
 $Re=99$. The gap height from top to bottom is
 $g=3,1.5,0.5$. The blue-to-red colour map is in the range
 $-10 \le \varOmega _z \le 10$. Grey/green diamonds indicate elliptical/hyperbolic stagnation points. The blue dashed line is for
 $U=0$.

In free stream, two shear layers with vorticity  $\varOmega _z$ of opposite sign detach from the LE corners and delimit the two symmetric wake recirculating regions after the TE. When the cylinder is long enough (
 ${A{\kern-4pt}R} >5$), after separating at the LE, the flow reattaches over the longitudinal walls generating two symmetric recirculating regions, and eventually separates at the TE corners. When the gap height is reduced, the flow loses its symmetry. The bottom-wake recirculating region detaches from the cylinder and moves downstream, while the top one remains attached to the cylinder and slightly moves upwards. This is conveniently visualised in figure 3; see the influence of the ground proximity on the
 $\psi =0$ line and on the elliptical stagnation points downstream the TE. Over the longitudinal sides of the cylinder, the reattachment point
 $x_r$ (when present) moves downstream and upstream over the top and bottom sides, respectively, resulting in an enlargement and contraction of the top and bottom side recirculating regions (see figures 3 and 4b). For small
 $g$, the bottom side recirculating region disappears and the top one encompasses the entire side of the cylinder. In this case, the flow does not reattach over the top side. The top LE shear layer delimits the recirculating regions over the side and in the wake, with a hyperbolic stagnation point separating them, which is located near the TE corner (green diamond in figure 3f). For
 ${A{\kern-4pt}R} =5$, for example, this happens for
 $g \le 0.5$. A boundary layer forms near the moving wall due to the non-uniform pressure field produced by the cylinder. When the gap height is reduced, the boundary layer thickens and the associated negative vorticity becomes more intense. For
 $g \le 1$, it interacts with the shear layer separating from the bottom LE corner, and the viscous effects become dominant in the gap; in this case, the potential flow region with
 $\varOmega _z=0$ disappears (see figure 3).
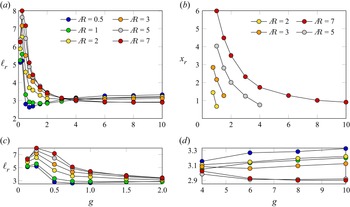
(a) Length of reverse flow region in the wake  $\ell _r$ as a function of
 $g$ for different
 ${A{\kern-4pt}R}$. Here,
 $\ell _r$ is measured at the Reynolds number corresponding to the first onset of the instability in free stream, being
 $Re_c=37.44, 44.56, 63.20, 78.31, 98.79, 114.31$ for
 ${A{\kern-4pt}R} =0.5,1,2,3,5,7$ (Chiarini et al. Reference Chiarini, Quadrio and Auteri2021). (b) Streamwise coordinate
 $x_r$ of the reattachment point on the top side of the cylinder in the same conditions. (c,d) Zoom of the dependence of
 $\ell _r$ on
 $g$ for (c)
 $0 \le g \le 2$ and (d)
 $4 \le g \le 10$.

The size of the wake recirculating regions changes with  $g$ in a way that depends on
 ${A{\kern-4pt}R}$. Figure 4(a) details the length
 $\ell _r$ of the reverse flow region in the wake, defined as the flow region delimited by the
 $U=0$ line downstream the TE, for different
 ${A{\kern-4pt}R}$ and
 $g$. For large gap heights (
 $g >4$),
 $\ell _r$ decreases with
 ${A{\kern-4pt}R}$ due to the increasing diffusion of the separating shear layers (Chiarini et al. Reference Chiarini, Quadrio and Auteri2021). In contrast, for smaller gaps,
 $\ell _r$ increases with
 ${A{\kern-4pt}R}$. For
 ${A{\kern-4pt}R} \le 3$,
 $\ell _r$ has a non-monotonic dependence on
 $g$. Indeed, when the gap height is reduced,
 $\ell _r$ decreases for intermediate and large
 $g$, but increases for small
 $g$, with a maximum attained for
 $g \approx 0.25$. The decrease of
 $\ell _r$ is only marginal for
 ${A{\kern-4pt}R} =2$ and
 ${A{\kern-4pt}R} =3$ (see figure 4d) with a minimum attained for
 $g \approx 4- 6$, while it is stronger for
 ${A{\kern-4pt}R} =0.5$ and
 ${A{\kern-4pt}R} =1$ with a minimum for
 $g \approx 0.5- 1$. In contrast, for
 ${A{\kern-4pt}R} \ge 5$,
 $\ell _r$ increases monotonically when
 $g$ is reduced, with a slope that grows with
 ${A{\kern-4pt}R}$. As shown in the following discussion, this non-monotonic dependence of
 $\ell _r$ on both
 ${A{\kern-4pt}R}$ and
 $g$ is explained with the different influence of the ground proximity on the gap flow, i.e. the flow in the gap between the wall and the bottom cylinder side (
 $0 \le x \le {A{\kern-4pt}R}$ and
 $-g \le y \le 0$).
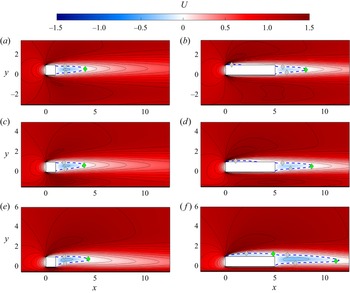
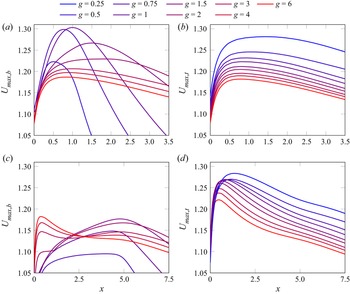
When the gap height is reduced and the flow loses its symmetry, the front stagnation point moves downwards, towards the bottom LE corner for all  ${A{\kern-4pt}R}$. The curvature of the streamlines passing over the top LE corner increases and the flow acceleration becomes stronger; see figures 5 and 6(b,d). As a result, for both short and elongated cylinders,
 $U_{max,t}(x)=\max _{y>0.5}U(x,y)$, i.e. the maximum streamwise velocity over the top side at a given
 $x$-position, which is representative of the flow velocity along the top LE shear layer, increases when the gap height is reduced. (Here and in the following, the
 ${\cdot }_t/{\cdot }_b$ subscript refers to quantities in the regions above/below the top/bottom side of the cylinder.) To be quantitative, for
 ${A{\kern-4pt}R} =1$ and
 ${A{\kern-4pt}R} =5$, the percentage increase is respectively
 $5.8\,\%$ and
 $7.6\,\%$ at
 $x={A{\kern-4pt}R} /2$, and
 $5.9\,\%$ and
 $6.5\,\%$ at
 $x={A{\kern-4pt}R} +1$. The
 $x$-position where
 $U_{max,t}$ is maximum changes with
 $g$ and follows the enlargement/contraction of the top wake recirculating bubble. For
 ${A{\kern-4pt}R} =1$, it moves upstream as the gap height is reduced in the range
 $1.5 \le g \le 10$, and then moves downstream for smaller gaps. For
 ${A{\kern-4pt}R} =5$, it consistently moves downstream as
 $g$ decreases.
Dependence of the map of  $U$ on the gap height for short and elongated cylinders, using (a,c,e)
 ${A{\kern-4pt}R} =1$ at
 $Re=45$ and (b,d,f)
 ${A{\kern-4pt}R} =5$ at
 $Re=99$ as examples. From top to bottom, the gap height is
 $g=3,1.5$ and
 $0.5$. The blue-to-red colour map is for
 $U$ in the range
 $-1.5 \le U \le 1.5$, black lines indicate isovalues of
 $U$, with an increase of
 $0.1$. The blue dashed line is for
 $U=0$ and delimits the reverse flow regions. Grey/green diamonds indicate elliptical/hyperbolic stagnation points. The flow goes from left to right.

Effect of the ground proximity on  $U$. (a,b) Dependence of (a)
 $U_{max,b}(x)=\max _{y<0.5}U(x,y)$ and (b)
 $U_{max,t}=\max _{y>0.5}U(x,y)$ on
 $g$ for
 ${A{\kern-4pt}R} =1$ at
 $Re=45$. (c,d) Dependence of (c)
 $U_{max,b}(x)$ and (d)
 $U_{max,t}(x)$ on
 $g$ for
 ${A{\kern-4pt}R} =5$ at
 $Re=99$.

The influence of the ground proximity on the gap flow changes with the aspect ratio. For  ${A{\kern-4pt}R} \le 1$, the velocity in the gap increases when the gap height is reduced in the range
 $1 \le g \le 10$, due to blockage. In fact, the streamlines are constricted by the wall and the cylinder themselves. For smaller gap heights, the velocity in the gap decreases and, for the smallest
 $g$, the maximum speed in the gap
 $U_{max,b}(x)=\max _{y<0.5}U(x,y)$ is only marginally larger than the
 $U=1$ value at the ground (see figures 5a,c,e and 6a). For these gaps, the shear layer separating from the bottom LE corner interacts with the boundary layer developing on the ground and the viscous effects dominate; see the above discussion. For
 $g \ge 0.5$, the velocity in the region below the bottom cylinder side is larger than that in the region over the top side at all
 $x$-positions (see the evolution with
 $x$ of
 $U_{max,t}$ and
 $U_{max,b}$): the shear layer separating from the bottom LE corner is more accelerated than that separating from the top TE corner. Overall, for
 ${A{\kern-4pt}R} \le 1$ and
 $g \ge 1$, a decrease of the gap height results into a stronger acceleration of both the top and bottom LE shear layers (although in a non-symmetric way). As a result, as
 $g$ decreases, the vorticity increases in the shear layers yielding a shorter reverse flow region in the wake, i.e. a decrease of
 $\ell _r$, by self-induction (see figure 4a,c). For smaller gaps, the bottom LE shear layer progressively weakens as the viscous effect becomes dominant in the gap. In this case, the flow topology changes and the presence of the wall straightens the flow streamlines, resulting into a large increase of
 $\ell _r$.
For  ${A{\kern-4pt}R} \ge 2$, the influence of the ground proximity on the gap flow is different. Indeed, close to the LE, a decrease of the gap height produces a weaker flow acceleration for all
 $g$. The curvature of the streamlines passing over the bottom LE corners progressively decreases and, in this case, the confinement effect results into a stronger acceleration of the the gap flow in the aft part of the cylinder side only (see figure 6c). In fact, a local maximum of
 $U_{max,b}$ is detected close to the TE, with a value that increases as
 $g$ is reduced in the range
 $1 < g \le 10$. For smaller gaps,
 $g \le 1$, the flow acceleration is weaker due to the viscous effects. As the the gap height is reduced, the maximum of
 $U_{max,b}$ moves closer to the TE. This flow acceleration is due to the streamline constriction that increases in the aft side of the cylinder as a result of the contraction of the potential flow region delimited by the bottom LE shear layer and the ground boundary layer. Because of this acceleration, for
 $g>0.5$ and close to the TE, the flow velocity is larger over the bottom side than over the top one, like for shorter cylinders. As shown in the following, this flow asymmetry is responsible for the asymmetric triggering mechanism of the first unsteady two-dimensional flow instability described in § 4. The decrease of
 $U$ close to the LE and the increase of
 $U$ close to the TE over the bottom side of the cylinder explain, at least partially, the absence of the strong decrease of
 $\ell _r$ observed in figure 4 for
 ${A{\kern-4pt}R} \ge 2$. In fact, the lower
 $U$ close to the LE results into a weaker shear layer that, therefore, undergoes a weaker self-induction, while the presence of the wall straightens the flow streamlines enlarging the wake reverse flow region. Owing to the above-described different influence of the ground proximity on the gap flow, the dependence of the gap flow rate per unit gap height
 $q$, i.e.
 \begin{equation} q= \frac{1}{g} \int_{-g}^{0}U(0,y)\,\text{d}y, \end{equation}
on  $g$ changes with
 ${A{\kern-4pt}R}$; see figure 7. For
 ${A{\kern-4pt}R} < 3$,
 $q$ slightly increases when the gap height is reduced in the range
 $1.5 < g \le 10$, before decreasing for smaller gaps when the viscous effects dominate the flow in the gap; for
 ${A{\kern-4pt}R} =0.5$, the gap flow rate is
 $q \approx 1.04, 1.05$ and
 $0.55$ for
 $g=10, 2$ and
 $0.0625$, respectively. For
 ${A{\kern-4pt}R} \ge 3$,
 $q$ monotonically decreases when the gap height is reduced; for
 ${A{\kern-4pt}R} =5$,
 $q \approx 1.03,0.97$ and
 $0.51$ for
 $g=10,2$ and
 $0.0625$, respectively.
Influence of  $g$ on the flow rate within the gap for different
 ${A{\kern-4pt}R}$. Here,
 $q$ is the gap flow rate per unit gap height.

Figure 8(a,b) shows the dependence on  $g$ of the drag and lift coefficients
 \begin{equation} C_d = \frac{2 F_x}{\rho D} \quad\text{and}\quad C_\ell = \frac{2 F_y}{\rho D}, \end{equation}
where  $F_x$ and
 $F_y$ are the aerodynamic forces in the
 $x$ and
 $y$ directions, and
 $\rho$ is the fluid density. For all
 $g$, the drag monotonically decreases as
 ${A{\kern-4pt}R}$ increases, though the variation is very small at the largest
 ${A{\kern-4pt}R}$ tested. Drag monotonically decreases also when
 $g$ is increased, with a slope which is steep for low
 $g$ and decreases as
 $g$ is increased. For
 ${A{\kern-4pt}R} =0.5$ and
 ${A{\kern-4pt}R} =1$, the lift coefficient increases according to a power law for
 $g<1$, and the data are well approximated by a curve of the form
 $C_\ell \sim (g)^b$, where
 $b \approx -0.165$. A power law, but with different coefficients, was also observed by Stewart et al. (Reference Stewart, Thompson, Leweke and Hourigan2010b) for a cylinder rolling on a wall at different rotation rates for very small gap heights
 $g \approx 5 \times 10^{-3}$. The rise of the drag for small
 $g$ is mainly due to the increase of the pressure at the LE, rather than due to the decrease of the base pressure behind the TE. To be quantitative, for
 ${A{\kern-4pt}R} =5$ at the LE, we measure a maximum pressure of
 $0.55$,
 $0.66$,
 $0.80$ and
 $1.03$ for
 $g=1$,
 $0.5$,
 $0.25$ and
 $0.125$, respectively, while at the TE, we measure a local minimum pressure of
 $-0.21$,
 $-0.24$,
 $-0.26$ and
 $-0.27$ for the same gap heights. Due to the flow symmetry, in free stream, the lift is null for all
 ${A{\kern-4pt}R}$ for Reynolds numbers below the first bifurcation. When the gap height is reduced, the lift nonlinearly grows with a rate that increases with
 ${A{\kern-4pt}R}$.
Effect of  $g$ on the drag and lift coefficients for different
 ${A{\kern-4pt}R}$ measured at the Reynolds number corresponding to the first onset of the primary instability in free stream: (a) drag coefficient
 $C_d$; (b) lift coefficient
 $C_\ell$.

4. The global modes
The global stability of the two-dimensional base flow is investigated studying the leading global mode  $\{\hat {\boldsymbol {u}},\hat {p}\}$, which is the global mode with largest growth rate
 $\mbox {Re}(\gamma )$. Figure 9 depicts the evolution with
 $g$ and
 ${A{\kern-4pt}R}$ of the critical Reynolds number of the first two-dimensional (
 $Re_{c,2\text{-}D}$) and three-dimensional (
 $Re_{c,3\text{-}D}$) instabilities, i.e. the Reynolds numbers corresponding to the first onset of the instabilities or, equivalently, the Reynolds numbers at which
 $\gamma$ crosses the imaginary axis.
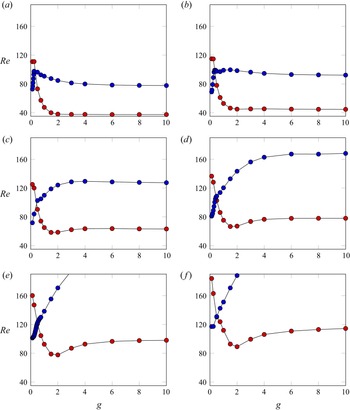
Neutral curves of the first two-dimensional and three-dimensional instability in the  $g$–
 $Re$ plane for different
 ${A{\kern-4pt}R}$. Each panel is a two-dimensional slice of the three-dimensional visualisation in figure 2. Red circles,
 $Re_{c,2\text{-}D}(g)$ of the first two-dimensional instability. Blue circles,
 $Re_{c,3\text{-}D}(g)$ of the first three-dimensional instability. (a)
 ${A{\kern-4pt}R} =0.5$, (b)
 ${A{\kern-4pt}R} =1$, (c)
 ${A{\kern-4pt}R} =2$, (d)
 ${A{\kern-4pt}R} =3$, (e)
 ${A{\kern-4pt}R} =5$ and (f)
 ${A{\kern-4pt}R} =7$.

For all  ${A{\kern-4pt}R}$, the primary instability consists of a regular steady three-dimensional bifurcation for
 $g \lessapprox 0.5$ and of a Hopf bifurcation for larger gaps, as in the circular cylinder case (Thompson et al. Reference Thompson, Leweke and Hourigan2021). In fact, the former bifurcation is associated with a real eigenvalue changing sign, while the latter with a couple of complex conjugate eigenvalues crossing the imaginary axis. For
 $g \gtrapprox 0.5$, therefore, the wake undergoes a Hopf bifurcation while it is still two-dimensional and the three-dimensionality develops at larger Reynolds numbers from the resulting unsteady periodic flow. For smaller
 $g$, the three-dimensional transition occurs before the flow becomes unsteady. The limiting gap height for which the primary instability switches from the steady, three-dimensional bifurcation to the unsteady, two-dimensional one slightly increases with
 ${A{\kern-4pt}R}$, being in the range
 $0.25 < g < 0.5$ for the considered
 ${A{\kern-4pt}R}$; note in figures 2 and 9 that for larger
 ${A{\kern-4pt}R}$, the intersection between the neutral curves moves towards larger
 $g$. This is similar to what is observed for the circular cylinder case, for which the limiting gap is
 $g \approx 0.28$ (Rao et al. Reference Rao, Thompson, Leweke and Hourigan2015b), and agrees with the earlier works by Durão, Gouveia & Pereira (Reference Durão, Gouveia and Pereira1991) and Bosch & Rodi (Reference Bosch and Rodi1996) that, at larger Reynolds numbers, for the square cylinder, reported a limiting gap height between
 $g = 0.35$ and
 $g =0.5$. For all
 $g$, the two critical Reynolds numbers
 $Re_{c,2\text{-}D}$ and
 $Re_{c,3\text{-}D}$ are increasing functions of
 ${A{\kern-4pt}R}$, meaning that a longer cylinder yields invariably a more stable flow.
4.1. The Hopf bifurcation
For  $g > 0.25- 0.5$, the flow becomes first unstable through a Hopf bifurcation towards an unsteady two-dimensional periodic regime. As shown in figure 9, for large gaps, the two-dimensional critical Reynolds number
 $Re_{c,2\text{-}D}$ asymptotically approaches
 $Re_{c,2\text{-}D}$ of the primary instability measured in free stream (Chiarini et al. Reference Chiarini, Quadrio and Auteri2021). For validation purposes, note that
 $Re_{c,2\text{-}D} \approx 44.6$ for
 ${A{\kern-4pt}R} =1$ and
 $g=10$ is in good agreement with other existing results for the square cylinder in free stream: for example, Yoon, Yang & Choi (Reference Yoon, Yang and Choi2010) report
 $Re_{c,2\text{-}D} \approx 45$, Park & Yang (Reference Park and Yang2016)
 $Re_{c,2\text{-}D}=44.7$ and Jiang & Cheng (Reference Jiang and Cheng2018)
 $Re_c=46$.
4.1.1. The critical Reynolds number and the frequency
The dependence of the two-dimensional critical Reynolds number  $Re_{c,2\text{-}D}$ on the gap height changes with
 ${A{\kern-4pt}R}$ (see the red circles in figure 9). For
 ${A{\kern-4pt}R} \le 1$,
 $Re_{c,2\text{-}D}$ increases monotonically when the gap height is reduced. The
 $Re_{c,2\text{-}D}$ remains almost constant for
 $g \gtrapprox 2$, while rapidly increases for smaller gap heights. In contrast,
 $Re_{c,2\text{-}D}$ does not have a monotonic dependence on
 $g$ for
 ${A{\kern-4pt}R} \ge 2$. Starting from the free stream case,
 $Re_{c,2\text{-}D}$ first decreases when
 $g$ is reduced, with the most unstable flow configuration (minimum of
 $Re_{c,2\text{-}D}$) attained for
 $g \approx 1.5- 2$, before largely increasing for smaller gap heights.
For all  ${A{\kern-4pt}R}$, the increase of
 $Re_{c,2\text{-}D}$ when
 $g$ reaches small values is due to the viscous effects that reduce the flow velocity in the gap and weaken the shear layer detaching from the bottom LE. The decrease of
 $Re_{c,2\text{-}D}$ for
 ${A{\kern-4pt}R} \ge 2$ and intermediate
 $g$ is due to the local increase of
 $U$ in the aft part of the gap flow (see § 3). This local increase of the flow velocity destabilises the bottom shear layer, and leads to a decrease of the critical Reynolds number. As shown later, this is confirmed by the structural sensitivity map (Giannetti & Luchini Reference Giannetti and Luchini2007) that, for these gaps, localises the main pocket of the instability in the lower side of the wake reverse-flow region. For
 ${A{\kern-4pt}R} \ge 2$,
 $Re_{c,2\text{-}D}$ is minimum for
 $1.5 \le g \le 2$, that is, close to the gap at which
 $U_{max,b}$ is maximum (see § 3).
Recently, Chiarini et al. (Reference Chiarini, Quadrio and Auteri2022b) observed that the primary Hopf instability in the steady flow past two-dimensional symmetric bluff bodies is well described using some measure of the length of the wake recirculating region and of the backflow within it. The former dictates the spatial extent of the absolute instability pocket (Chomaz Reference Chomaz2005), while the latter directly impacts the local amplification of the unstable wave packets (Hammond & Redekopp Reference Hammond and Redekopp1997). Using  $\ell _r$ as the length scale and the largest reverse-flow speed (
 $U_{rev}$) as the velocity scale, the resulting Reynolds number (
 $\hat {R}e=U_{rev} \ell _r / \nu$) evaluated at the onset of the bifurcation collapses to approximately the same value for bodies of different shape and aspect ratio, even in the presence of small flow asymmetries (Chiarini et al. Reference Chiarini, Quadrio and Auteri2022b). Figure 10(a) plots
 $\hat {R}e$, measured at
 $Re=Re_{c,2\text{-}D}$ for the free stream case, for different
 ${A{\kern-4pt}R}$ and
 $g$. To account for small flow asymmetries, only gap heights in the range
 $1.5 \le g \le 10$ are considered. For
 ${A{\kern-4pt}R} \le 1$,
 $\hat {R}e$ decreases when the gap height is reduced, in agreement with the flow stabilisation and the increase of
 $Re_{c,2\text{-}D}$. In contrast, for
 ${A{\kern-4pt}R} \ge 2$, a decrease of
 $g$ corresponds to an increase of
 $\hat {R}e$, consistent with the decrease of
 $Re_{c,2\text{-}D}$ and the flow destabilisation. Note that for
 ${A{\kern-4pt}R} =2$ and
 $3$, when the gap is reduced,
 $\hat {R}e$ slightly decreases at large
 $g$ before increasing. This is consistent with a marginal increase of
 $Re_{c,2\text{-}D}$ before the decreasing trend dominates, which is hardly visible in figure 9. Overall, this indicates that an inspection of the two-dimensional steady base flow is sufficient to determine the effect of the ground proximity on the two-dimensional Hopf bifurcation, and whether it stabilises or destabilises the flow.
(a) Evolution of  $\hat {Re}=U_{rev}\ell _r / \nu$ with
 $g$ for different
 ${A{\kern-4pt}R}$, measured at a Reynolds number corresponding to the first onset of the instability in free stream. (b) Evolution of
 $f_s=\mbox {Im}(\gamma )/2{\rm \pi}$ with
 $g$ for different
 ${A{\kern-4pt}R}$ at
 $Re=Re_{c,2\text{-}D}$.

Figure 10(b) plots the dependence of the frequency  $f_s=\mbox {Im}(\gamma )/2{\rm \pi}$, measured at criticality, on
 $g$ and
 ${A{\kern-4pt}R}$; here,
 $\mbox {Im}(\gamma )$ is the imaginary part of the eigenvalue
 $\gamma$. For large gap heights
 $g \gtrapprox 6$,
 $f_s$ approaches a horizontal asymptote that identifies the free stream value. For this range of
 $g$, the frequency does not have a monotonic dependence on the aspect ratio (Chiarini et al. Reference Chiarini, Quadrio and Auteri2021). It generally decreases with
 ${A{\kern-4pt}R}$, but increases for
 $1 \le {A{\kern-4pt}R} \le 3.5$. Therefore, for
 $g=10$, the largest frequency is found for
 ${A{\kern-4pt}R} =3$, while the smallest one corresponds to
 ${A{\kern-4pt}R} =1$. In contrast, when the gap height is reduced below
 $g \le 3$, the frequency shows a monotonically decreasing trend with
 ${A{\kern-4pt}R}$: the frequency of the resulting periodic regime is lower for longer cylinders. The evolution of the frequency with the gap strongly depends on
 ${A{\kern-4pt}R}$. For
 ${A{\kern-4pt}R} \le 3$,
 $f_s$ increases monotonically when
 $g$ is reduced in the range
 $1 \le g \le 10$, before decreasing for smaller gaps when the viscous effects dominate in the gap. A similar dependence of the shedding frequency on
 $g$ has been observed with nonlinear time-dependent simulations in the flow past a circular cylinder, although at larger Reynolds numbers (Huang & Sung Reference Huang and Sung2007). It is worth noting that this dependence of
 $f_s$ on
 $g$ is consistent with the dependence of the size of the wake recirculating region and of the maximum of
 $U_{max,b}$ on
 $g$. For
 ${A{\kern-4pt}R} > 3$, a further slightly decreasing trend is observed for intermediate gaps
 $2 \le g \le 6$. For
 ${A{\kern-4pt}R} =5$, this slight decrease has been detected also at larger Reynolds numbers with two-dimensional, unsteady simulations (not shown).
4.1.2. Direct and adjoint modes
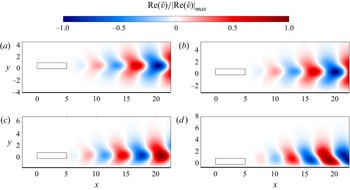
The shape of the leading direct global mode  $\{\hat {\boldsymbol {u}},\hat {p}\}$ is qualitatively similar for all the considered
 ${A{\kern-4pt}R}$. Figure 11 shows the evolution of the real part of the vertical component
 $\hat {v}$ of the direct mode with
 $g$ for
 ${A{\kern-4pt}R} =5$ at
 $Re=Re_{c,2\text{-}D}$. The global mode propagates downstream, like for the circular cylinder case (Giannetti & Luchini Reference Giannetti and Luchini2007; Marquet, Sipp & Jacquin Reference Marquet, Sipp and Jacquin2008). In free stream, it is antisymmetric about the horizontal axis of symmetry, i.e.
 $\{\hat {u},\hat {v},\hat {p}\}(x,\tilde {y}) = \{-\hat {u},\hat {v},-\hat {p}\}(x,-\tilde {y})$, where
 $\tilde {y}$ is the vertical coordinate of a reference system placed on the symmetry plane of the cylinder, i.e.
 $\tilde {y}=y-0.5$. When the gap height is reduced, the symmetry is broken and the mode progressively moves upwards due to the
 $\hat {v}=0$ boundary condition at the sliding wall. At the smallest gaps,
 $g \lessapprox 1$, the unstable mode depicts a one-sided vortex shedding, consistent with what was observed by several authors for the circular cylinder case at larger Reynolds numbers with unsteady simulations (Huang & Sung Reference Huang and Sung2007; Mahir Reference Mahir2009; Rao et al. Reference Rao, Thompson, Leweke and Hourigan2013, Reference Rao, Thompson, Leweke and Hourigan2015b; Houdroge et al. Reference Houdroge, Leweke, Hourigan and Thompson2017) (in their simulations, a roll up of the shear layers, due to the nonlinear effects, is also observed).
Evolution of the real part of the vertical component of the direct eigenmode  $\mbox {Re}(\hat {v})$ associated with the Hopf bifurcation for
 ${A{\kern-4pt}R} =5$ at
 $Re=Re_{c,2\text{-}D}$. The panels are for (a)
 $g=4$, (b)
 $g=3$, (c)
 $g=1.5$ and (d)
 $g=0.5$. The flow goes from left to right.

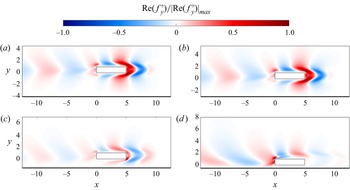
Figure 12 shows the evolution of the real part of the vertical component of the adjoint velocity field  $\boldsymbol {f}^+$ with
 $g$. The adjoint field
 $\{\boldsymbol {f}^+,m^+\}$, obtained by solving the adjoint of the linearised Navier–Stokes equations (2.4), is commonly used to study the receptivity of the modes to an external forcing, i.e. the process with which the mode incorporates the external disturbances that trigger its amplification. Here,
 $\boldsymbol {f}^+$ and
 $m^+$ represent the vector and scalar adjoint fields, respectively, counterparts of the velocity and pressure fields in the adjoint equations. In fact, the receptivity of a mode to a periodic forcing in the momentum and/or continuity equation is proportional to
 $\boldsymbol {f}^+$ and
 $m^+$ (Luchini & Bottaro Reference Luchini and Bottaro2014). The aim of this paragraph is to investigate how the mode receptivity is modified by the presence of the ground. Unlike the direct mode, the adjoint mode propagates upstream, due to the opposite transport of perturbations by the base flow in the direct and adjoint operators (Chomaz Reference Chomaz2005). In free stream, the adjoint mode is antisymmetric like the direct one, with the largest value detected close to the TE corners (Chiarini et al. Reference Chiarini, Quadrio and Auteri2021). When the gap height is reduced, the symmetry is broken. For large and intermediate gaps, large receptivity is observed close to the TE, with the largest values located close to the bottom TE corner. This is consistent with the destabilisation of the shear layer separating from the bottom leading-edge corner, as is discussed above. Moreover, the receptivity of the mode over the bottom longitudinal side progressively decreases as
 $g$ is reduced, until it becomes negligible for small gaps
 $g \le 1$ when the viscous effects dominate (see in figure 12 the decrease of
 $\mbox {Re}(\,f_y^+)$ as
 $g$ is reduced). For these gaps, the receptivity is larger over the top side of the cylinder and the maximum is placed close to the top LE corner.
As in figure 11, but for the real part of the vertical component of the adjoint eigenmode  $\mbox {Re}(\,f_y^+)$. The flow goes from left to right.

4.1.3. Structural sensitivity
The structural sensitivity of the leading global mode is used to identify the core of the global instability. It has been proposed by Giannetti & Luchini (Reference Giannetti and Luchini2007) as a way to locate the so-called wave-maker region (Monkewitz, Huerre & Chomaz Reference Monkewitz, Huerre and Chomaz1993), i.e. the flow region where the instability mechanism arises to produce the self-sustained oscillations. The structural sensitivity  $S$ identifies where in space a modification in the structure of the problem leads to the largest drift of the eigenvalue
 $\gamma$, by putting together the information provided by the direct and adjoint perturbation modes. Following Giannetti & Luchini (Reference Giannetti and Luchini2007),
 $S$ is defined as
 \begin{equation} S(\boldsymbol{x}) = \frac{\|\hat{\boldsymbol{f}}^+(\boldsymbol{x})\|\,\| \hat{\boldsymbol{u}}^+ (\boldsymbol{x})\|}{(\hat{\boldsymbol{f}}^+,\hat{\boldsymbol{u}}^+) }, \end{equation}
where  $(\boldsymbol {u}_A,\boldsymbol {u}_B)=\int _\varOmega (\boldsymbol {u}_A^* \boldsymbol {\cdot } \boldsymbol {u}_B)\,\textrm {d} \varOmega$ is the inner product of
 $L^2(\varOmega )$, with
 $\boldsymbol {u}_A$ and
 $\boldsymbol {u}_B$ being two complex vector fields and
 $^*$ denoting the complex conjugate;
 $\|{\cdot }\|$ is the
 $\mathbb {R}^2$ vector norm. Large values of
 $S$ identify the region of the flow where the amplification of the perturbations and receptivity combine to trigger the instability.
Figure 13 plots the dependence of the structural sensitivity for  ${A{\kern-4pt}R} =5$ at
 $Re=Re_{c,2\text{-}D}$ on
 $g$, and shows how the presence of the ground modifies the wave-maker. For all the considered gap heights, the largest values of
 $S$ occur downstream of the TE close to the wake reverse-flow region, and it is almost null everywhere else in the domain, where the product between the direct and adjoint modes is small. Therefore, for all
 $g$, the side recirculating region that arises over the top cylinder side for elongated cylinders is only marginally involved in the triggering mechanism of the instability. In free stream, the map of
 $S$ is symmetric and the largest values occur in two lobes symmetrically located across the wake reverse-flow region. When the gap height decreases, the map of
 $S$ loses its symmetry. For
 $g > 1$, the largest values of
 $S$ occur in the bottom lobe, in agreement with the local maximum of the adjoint mode (see figure 12). This confirms that for these
 $g$, the instability is mainly triggered by the shear layer separating from the bottom LE corner. In fact, as discussed above, for these
 $g$, the strong flow acceleration downstream of the bottom TE (figure 6) mainly destabilises the bottom LE shear layer. In contrast, when the viscous effects dominate the gap flow for smaller
 $g$,
 $S$ is maximum on the top lobe indicating that the triggering instability in this case is mainly associated with the top LE shear layer. In fact, the viscous effects decelerate the flow in the gap and stabilise the bottom shear layer (figure 6).
As in figure 11, but for the structural sensitivity map. The flow goes from left to right.

4.2. Regular bifurcation
For  $g < 0.5$, the primary bifurcation consists of a three-dimensional regular bifurcation for all aspect ratios, due to mode E. The leading three-dimensional mode is time invariant, and the associated eigenvalue has null imaginary part
 $\mbox {Im}(\gamma )=0$.
4.2.1. The critical Reynolds number and wavelength
Figure 14(a,b) plots the evolution of the critical Reynolds number  $Re_{c,3\text{-}D}$ and of the critical wavelength
 $\lambda _c=2 {\rm \pi}/ \beta _c$ with
 $g$ for
 ${A{\kern-4pt}R} =1,3$ and
 $5$. Note that the dependence of both
 $Re_{c,3\text{-}D}$ and
 $\lambda _c$ on the gap height is detailed for
 $0.125 \le g \le 4$, although the steady flow actually undergoes this regular bifurcation for
 $g < 0.5$ only.
(a) Critical Reynolds number  $Re_{c,3\text{-}D}$ and (b) critical wavelength
 $\lambda _c$ as a function of
 $g$ for
 ${A{\kern-4pt}R} =1,3$ and
 $5$. The dashed lines indicate the free stream values. The inset in panel (b) plots the dependence of
 $\ell _r$ on
 $g$ for
 ${A{\kern-4pt}R} =1,3$ and
 $5$ at
 $Re=Re_{c,3\text{-}D}$. Note that the flow actually undergoes the three-dimensional regular bifurcation for
 $g \lessapprox 0.5$ only.

For small gaps  $g \le 0.5$,
 $Re_{c,3\text{-}D}$ increases with
 $g$ for all
 ${A{\kern-4pt}R}$. For example, for
 ${A{\kern-4pt}R} =1$, it increases from
 $Re_{c,3\text{-}D} \approx 69$ at
 $g=0.125$ to
 $Re_{c,3\text{-}D} \approx 97.5$ at
 $g=0.5$. For larger gaps, the dependence of
 $Re_{c,3\text{-}D}$ on
 $g$ changes with
 ${A{\kern-4pt}R}$. For
 ${A{\kern-4pt}R} \le 1$, after reaching a maximum at
 $g \approx 0.5$,
 $Re_{c,3\text{-}D}$ slightly decreases for larger gaps, asymptotically reaching the free stream value (being
 $Re_{c,3\text{-}D} \approx 93$ for
 ${A{\kern-4pt}R} =1$). For
 ${A{\kern-4pt}R} \ge 3$,
 $Re_{c,3\text{-}D}$ monotonically increases with
 $g$ up to the asymptotic free stream value, which monotonically increases with
 ${A{\kern-4pt}R}$; for example,
 $Re_{c,3\text{-}D} \approx 169$ for
 ${A{\kern-4pt}R} =3$ and
 $Re_{c,3\text{-}D} \approx 246$ for
 ${A{\kern-4pt}R} =5$. Compared with the circular cylinder case, the regular bifurcation for the square cylinder (
 ${A{\kern-4pt}R} =1$) occurs at lower Reynolds numbers; for example, for the circular cylinder at
 $g \approx 0.22$,
 $Re_{c,3\text{-}D} \approx 128$ (Rao et al. Reference Rao, Thompson, Leweke and Hourigan2013), while for the square cylinder at
 $g=0.25$,
 $Re_{c,3\text{-}D} \approx 89$. As
 ${A{\kern-4pt}R}$ increases,
 $Re_{c,3\text{-}D}$ increases for all
 $g$. For all
 ${A{\kern-4pt}R}$, the
 $Re_{c,3\text{-}D}(g)$ curve has a kink at
 $g \approx 0.5$ that is not found in the
 $\lambda _c(g)$ curve; this is clearly visible in figure 9 for
 ${A{\kern-4pt}R} =0.5$. This may indicate that the triggering mechanism of this regular bifurcation is different depending on whether
 $g < 0.5$ or
 $g \ge 0.5$, as supported in the following by the structural sensitivity (see § 4.2.3) and the asymptotic inviscid stability analysis (see § 5).
The large variation of  $\lambda _c$ (see figure 14b, where
 $7 \le \lambda _c \le 15$ for
 $1 \le {A{\kern-4pt}R} \le 5$) indicates that the spanwise wavelength of the three-dimensional mode does not scale with the cylinder thickness
 $D$. In contrast,
 $\lambda _c$ scales with a characteristic length of the wake recirculating regions. In fact, the dependence of
 $\lambda _c$ on
 ${A{\kern-4pt}R}$ and
 $g$ recalls that of
 $\ell _r$ shown in figure 4. For
 ${A{\kern-4pt}R} \le 1$,
 $\lambda _c$ decreases when the gap height is reduced in the range
 $1 \le g \le 4$ and increases for smaller gaps with a maximum attained for
 $g=0.25$. For longer cylinders, when
 $g$ is reduced,
 $\lambda _c$ monotonically increases, but for the smallest
 $g$ in this study, being maximum for
 $g \approx 0.25$. However, the ratio between
 $\lambda _c$ and
 $\ell _r$ evaluated at
 $Re=Re_{c,3\text{-}D}$ is not constant for all
 ${A{\kern-4pt}R}$ and
 $g$, meaning that
 $\lambda _c$ is not dictated directly by the size of the wake reverse-flow region. It is worth stressing that the link between
 $\ell _r$ and
 $\lambda _c$ has already been observed by other authors, when considering the primary three-dimensional instability of different flows. Barkley, Gomes & Henderson (Reference Barkley, Gomes and Henderson2002) found that the flow past a backward facing step with an expansion rate of
 $2$ undergoes a stationary three-dimensional bifurcation with a wavelength of approximately
 $7$ step heights which, they infer, is dictated by the length of the recirculating region. Similarly, when studying the three-dimensional instability of the flow behind a cylinder rolling over a wall, Stewart et al. (Reference Stewart, Thompson, Leweke and Hourigan2010b) discussed a possible link between the spanwise wavelength
 $\lambda _c$ and the length of the wake recirculating region.
Although  $\ell _r$ plays a role in determining the wavelength of the unstable mode, a proper scaling for the regular bifurcation has not been found, as done for the Hopf bifurcation (Chiarini et al. Reference Chiarini, Quadrio and Auteri2022b). In fact, we were not able to detect a pair of velocity and length scales that well describes the instability, such that the associated Reynolds number collapses at criticality to the same value for different
 ${A{\kern-4pt}R}$ and
 $g$. We conjecture that this is, at least partially, due to the above-cited possible presence of different triggering mechanisms that may coexist for some
 $g$.
4.2.2. Direct and adjoint modes
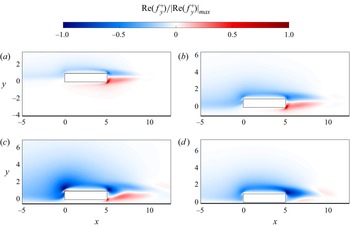
Figures 15 and 16 plot the direct and adjoint modes associated with the regular bifurcation. Figure 15 plots the real part of the streamwise vorticity  $\mbox {Re}(\hat {\omega }_x)$ of the direct mode to show the three-dimensional nature of the mode. Figure 16 plots the real part of the vertical component of the adjoint velocity field
 $\mbox {Re}(\hat {f}_y^+)$ to highlight the structure of the adjoint mode. The results are shown for
 ${A{\kern-4pt}R} =5$, but they are also representative of the other aspect ratios.
Evolution of the real part of the streamwise vorticity  $\mbox {Re}(\hat {\omega }_x)$ of the direct eigenmode associated with the regular bifurcation for
 ${A{\kern-4pt}R} =5$ at
 $Re=Re_{c,3\text{-}D}$ and
 $\lambda =\lambda _c$. The panels are for (a)
 $g=4$, (b)
 $g = 1$, (c)
 $g = 0.5$ and (d)
 $g = 0.125$. The flow goes from left to right.

As in figure 15, but for the real part of the vertical component of the adjoint velocity field  $\mbox {Re}(\hat {f}_y^+)$. The flow goes from left to right.

In free stream, the three-dimensional mode corresponds to mode E described by Rao et al. (Reference Rao, Thompson and Hourigan2016) for the circular cylinder. As shown in figure 15, the direct mode propagates downstream and, unlike the two-dimensional unsteady mode associated with the Hopf bifurcation, is symmetric, i.e.  $\{\hat {u},\hat {v},\hat {w},\hat {p}\}(x,\tilde {y})=\{\hat {u},-\hat {v},\hat {w},\hat {p}\}(x,-\tilde {y})$. The spatial organisation of this three-dimensional mode shows large values close to the cylinder rather than in the far wake, with the maximum placed close to the TE corners. When the gap height is reduced, the mode loses its symmetry, and its topology slowly changes. As
 $g$ is reduced, the direct mode does not remain confined downstream of the cylinder, but progressively moves upwards and extends within the top side reverse flow region, with the maximum located just above the top TE corner; see
 $g =0.5$ and
 $g=0.125$ in figure 16(c,d). The smooth variation of the mode with the gap height suggests that the change of the mechanism triggering the instability, if any, is not abrupt.
Like the direct mode, in free stream, the adjoint field is symmetric and its maximum is located in the wake reverse-flow region downstream of the TE. When the gap height is reduced, the adjoint field loses its symmetry and the receptivity of the mode changes. Due to the boundary conditions, the receptivity increases over the top side of the cylinder and progressively decreases over the bottom side. At intermediate gap heights,  $g \approx 1- 4$, the adjoint mode is maximum close to the bottom TE corners. Further decreasing the gap height, the largest receptivity of the mode moves over the top side of the cylinder, with the maximum placed close to the top TE and LE corners. For these
 $g$,
 $|\boldsymbol {f}^+| \approx 0$ in the gap as the viscous effects dominate there.
4.2.3. Structural sensitivity
Figure 17 shows the structural sensitivity for the three-dimensional stationary mode, using again  ${A{\kern-4pt}R} =5$ as a representative case. In free stream, the structural sensitivity is confined downstream of the TE in the wake reverse-flow region. The largest values are placed along the symmetry plane dividing the top and bottom wake recirculating regions and two further local maxima of lower intensity are placed just downstream of the TE corners. Similar results are reported by Rao et al. (Reference Rao, Thompson and Hourigan2016) for the circular cylinder case. When the gap height is reduced, the maximum of the sensitivity moves progressively inside the top recirculating region delimited by the
 $\psi =0$ streamline. For
 $g \le 0.5$, the structural sensitivity features two local maxima: one placed just above the top TE corner, the other located downstream of the TE and close to the bottom part of the
 $\psi =0$ streamline. This suggest that, in free stream and for large gaps, the top and bottom wake recirculating regions cooperate in triggering the instability, while for small gaps, the triggering mechanism is localised in the top recirculating region only (see § 5). For small gaps, in fact, the bottom wake recirculating region shrinks and detaches from the TE. The main triggering mechanism of the three-dimensional instability, therefore, changes with the gap height. However, like for the direct and adjoint modes, the variation of the structural sensitivity map with
 $g$ is not abrupt, but gradual. All together, this scenario indicates that different physical mechanisms coexist in triggering this instability and that they have different importance depending on the gap height. A similar conclusion was also drawn by Rao et al. (Reference Rao, Thompson and Hourigan2016), when investigating the nature of mode E for the flow past rotating cylinders at different rotation rates.
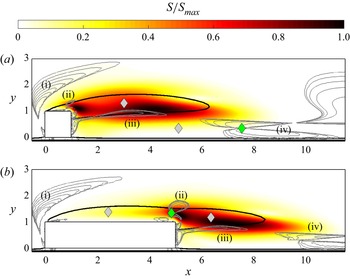
As in figure 15, but for the structural sensitivity. Grey/green diamonds indicate elliptical/hyperbolic stagnation points. The black solid line is for  $\psi =0$, while the dashed blue line is for
 $U=0$. The flow goes from left to right.

5. On the physical mechanism triggering the three-dimensional steady bifurcation
The physical mechanism triggering the steady three-dimensional bifurcation is not immediately clear and changes with the gap height, although in the  $g$–
 $Re$ plane, the neutral curves are continuous and the changes of the direct and adjoint modes are smooth (see also Rao et al. Reference Rao, Thompson, Leweke and Hourigan2013).
For large gaps, the global stability results resemble those for a circular cylinder in free stream investigated by Rao et al. (Reference Rao, Thompson and Hourigan2016). They observed that the structural sensitivity field resembles what is seen in the generic problem of the Crow instability of a counter-rotating vortex pair (Crow Reference Crow1970). In fact, as required for the Crow instability, for large gaps, the structural sensitivity is maximum in the area separating the two wake recirculating regions. In addition, for large gap heights,  $g \gtrapprox 1$, the preferred wavelength of this mode is
 $\lambda _z \approx 6D$ for all
 ${A{\kern-4pt}R}$, in line with that of the Crow instability that is
 $\lambda _z \approx 6.6b$ (Crow Reference Crow1970), where
 $b$ is the distance between the two vortex cores; in this case,
 $b \approx D$.
When the gap height is reduced, the triggering mechanism changes. For small gaps, in fact, the counter-rotating vortex pair downstream of the TE is replaced by a large recirculating region attached to the TE and delimited by the  $\psi =0$ streamline that separates from the top LE corner, and a small bottom wake recirculating region detached from the TE, which is placed close to the ground and stretched in the streamwise direction (see figure 3). For elongated cylinders at small gaps, the bottom wake recirculating region disappears; for example, see in figure 17 that for
 ${A{\kern-4pt}R} =5$, the elliptical stagnation point (grey diamond) downstream of the bottom TE disappears for
 $g< 0.25$. The structural sensitivity suggests that the triggering mechanism is embedded in the top recirculating region. In this case, the instability has some similarities with the three-dimensional instability of the flow past a backward-facing step (Ghia, Osswald & Ghia Reference Ghia, Osswald and Ghia1989; Barkley et al. Reference Barkley, Gomes and Henderson2002) and a bump (Gallaire et al. Reference Gallaire, Marquillie and Ehrenstein2007), and of the wake past a circular cylinder rolling on a wall (Stewart et al. Reference Stewart, Thompson, Leweke and Hourigan2010b). For the backward-facing step, several triggering mechanisms have been proposed over the years. Ghia et al. (Reference Ghia, Osswald and Ghia1989) first proposed the Taylor–Görtler instability (Görtler Reference Görtler1954) to be responsible for this transition, but later, Barkley et al. (Reference Barkley, Gomes and Henderson2002) rejected this interpretation and, using the Rayleigh criterion (Bayly et al. Reference Bayly, Orszag and Herbert1988), they observed that the triggering mechanism is centrifugal and associated with the closed streamlines in the recirculating region. Later, Gallaire et al. (Reference Gallaire, Marquillie and Ehrenstein2007) proposed the same mechanism for the steady flow past a bump. In contrast, Stewart et al. (Reference Stewart, Thompson, Leweke and Hourigan2010b) observed that there is no evidence of centrifugal instability in the three-dimensional transition of the flow past circular cylinders rolling on a wall, and explain this difference with respect to the backward-facing step case with the absence of a downstream steady wall. In fact, they did not observe outwardly decreasing circulation for the streamlines within the recirculating region. Although this does not eliminate the possibility of a centrifugal instability, they proposed that the transition to three-dimensional flow is due to an elliptic instability of the wake recirculating region (Kerswell Reference Kerswell2002), as they found quite a good agreement of the spanwise wavelength with the values predicted by the theory. Similarly, Griffith et al. (Reference Griffith, Thompson, Leweke, Hourigan and Anderson2007) and Rao et al. (Reference Rao, Thompson and Hourigan2016) associated the three-dimensional bifurcation of the flow past a backward-facing step with an elliptical instability. In the present case, the structural sensitivity fields (figure 17) are far from those observed for a typical elliptic instability and seem to exclude this type of transition mechanism. The spanwise perturbation vorticity is not contained within the elliptically shaped streamlines and it has not the typical structure for an elliptic instability, with two lobes of opposite sign forming approximately a
 $45^\circ$ angle with the axis of the ellipse (Landman & Saffman Reference Landman and Saffman1987; Waleffe Reference Waleffe1990). Moreover, the structural sensitivity is not maximum at the elliptic stagnation point at the centre of the elliptic streamlines, but its largest values are placed close to the regions where the streamlines have large curvature. Therefore, from this point of view, this transition does not seem to be elliptic in nature.
Let us now inspect whether there is evidence for this instability to be of centrifugal nature. Following the work by Gallaire et al. (Reference Gallaire, Marquillie and Ehrenstein2007), in figure 18, the grey lines indicate isolines of negative values of the Rayleigh discriminant  $\varDelta$:
 \begin{equation} \varDelta = \frac{2 |\boldsymbol{U}| \varOmega_z}{R}, \end{equation}
where  $|\boldsymbol {U}|$ is the base-flow velocity modulus and
 $R$ the local algebraic curvature radius, i.e.
 \begin{equation} R = \frac{|\boldsymbol{U}|^3}{(\boldsymbol{\nabla} \psi) \boldsymbol{\cdot} (\boldsymbol{U} \boldsymbol{\cdot} \boldsymbol{\nabla} \boldsymbol{U})}. \end{equation}
According to Sipp & Jacquin (Reference Sipp and Jacquin2000), a sufficient condition for the centrifugal instability in the inviscid short-wave limit is the existence of a streamline  $\psi _0$ such that
 $\varDelta (\boldsymbol {r}_0)<0$ for any point
 $\boldsymbol {r}_0$ along it. Figure 18 shows that there exist different regions of the flow where
 $\varDelta$ is negative (see the grey lines): (i) upstream of the top leading-edge corner; (ii) slightly downstream and above the TE corner; (iii) behind the TE over the
 $\psi =0$ streamline delimiting the top recirculating region; (iv) downstream of the flow recirculation. Clearly, there is no streamline along which
 $\varDelta$ is negative for all points. However, the fact that
 $\varDelta <0$ in the flow regions where the structural sensitivity is maximum seems to indicate that the centrifugal instability may play a role in the triggering mechanism. As suggested by Gallaire et al. (Reference Gallaire, Marquillie and Ehrenstein2007), since the above criterion is only a sufficient condition, it is possible that a partial gain (i.e. streamlines that only partially cross
 $\varDelta <0$ regions) is sufficient for triggering the global instability. This possibility is addressed by inspecting the local instability of closed streamlines by means of the asymptotic inviscid stability theory described in § 2.3.
The grey lines indicate negative isovalues of the Rayleigh discriminant  $\varDelta$. Four different regions with
 $\varDelta <0$ are highlighted. The black thick line is for
 $\psi =0$. The colour map is for the structural sensitivity at criticality
 $Re=Re_{c,3\text{-}D}$ and
 $\lambda =\lambda _c$ for
 $g=0.125$. (a)
 ${A{\kern-4pt}R} =1$; (b)
 ${A{\kern-4pt}R} =5$. Grey/green diamonds indicate elliptical/hyperbolic stagnation points. Note that for
 ${A{\kern-4pt}R} =5$, the elliptical stagnation point denoting the bottom wake vortex and the downstream hyperbolic stagnation point disappear for this
 $g$.

5.1. Asymptotic analysis
The asymptotic inviscid stability analysis relies on the same steady base flows used for the global stability analysis. The closed Lagrangian trajectories are extracted integrating in time (2.9) using a third-order Runge–Kutta method. Then, the fundamental matrix  $\boldsymbol {A}(T)$ is evaluated for several closed orbits integrating the ODE (2.12) over one revolution period
 $T$ of the trajectories.
The results for  ${A{\kern-4pt}R} >3$ are first presented, using
 ${A{\kern-4pt}R} =5$ at
 $Re=101.5$ and
 $g=0.125$; note that qualitatively, the same results hold also for larger
 ${A{\kern-4pt}R}$. The Reynolds number has been set to
 $Re=101.5$, as for this configuration, it is slightly larger than the critical value found with the global stability analysis. Figure 19 shows the real and imaginary part of the leading eigenvalue evaluated for streamlines with different
 $\boldsymbol {x}_0=(x_0,y_0)$. The panels refer to streamlines starting at
 $x_0=2.45$ with
 $1.01 \le y_0 \le 1.39$ (figure 19b) and
 $x_0=6.34$ with
 $0.81 \le y_0 \le 1.18$ (figure 19c). For the reader's convenience, the
 $(x_0,y_0)$ starting points of the streamlines considered in this analysis are shown in figure 19(a) with the blue and red thick lines, respectively. Note that
 $(x,y)=(2.45,1.39)$ and
 $(x,y)=(6.34,1.18)$ are the two elliptical stagnation points within the side and wake recirculating regions and
 $(x,y)=(6.34,0.81)$ is located over the
 $\psi =0$ streamline. The asymptotic analysis reveals three different branches for both values of
 $x_0$ considered. The eigenvalues of the first (red) and third (green and blue) branches have zero frequency, while those of the second (yellow) branch have non-zero frequency. The first two branches at both
 $x_0$ refer to the same close orbits, see figure 20. These orbits evolve close to the
 $\psi =0$ streamline from the LE corner to the wake region, see the red and yellow lines. Note that orbits of the second branch with non-null frequency are shorter and placed closer to the elliptical stagnation point. In contrast, the third branch of eigenvalues refers to different orbits evolving around the elliptic stagnation point within the side and wake recirculating regions; see the green and blue streamlines in figure 20, respectively. The streamline with maximum growth rate belongs to the third branch detected for
 $x_0=6.34$ and is identified by the blue line in figure 20. Among the orbits associated with the same branch, it is the largest and passes through the two regions with large values of the structural sensitivity where the Rayleigh invariant is negative
 $\varDelta <0$. In agreement with the results of the global stability analysis, it has null imaginary part, indicating a stationary mode. This seems to indicate that the local regions with
 $\varDelta <0$ are sufficient to trigger the global instability, owing to the local feedback on these closed orbits.
The WKBJ analysis for  ${A{\kern-4pt}R} =5$ and
 $g=0.125$ at
 $(Re,\lambda )=(Re_{c,3\text{-}D},\lambda _c)$. (a)
 $(x_0,y_0)$ starting point of the streamlines used for the analysis with
 $x_0=2.45$ (blue line) and
 $x_0=6.34$ (red line). The black line is for
 $\psi =0$; the grey and green diamonds indicate the elliptic and hyperbolic stagnation points. (b,c) The WKBJ growth rate
 $\sigma _r$ (circles) and eigenfrequency
 $\sigma _i$ (triangles) for (b) the streamlines with
 $x_0=2.45$ and
 $1.01 \le y_0 \le 1.39$ and (c) the streamlines with
 $x_0=6.34$ and
 $0.81 \le y_0 \le 1.18$. The eigenvalues of the first (red) and third (green and blue) branches have zero frequency, while those of the second (yellow) branch have non-zero frequency.

Orbits associated with the three unstable branches detected with the WKBJ analysis superimposed on the structural sensitivity map for  ${A{\kern-4pt}R} =5$,
 $g=0.125$ at
 $(Re,\lambda )=(Re_{c,3\text{-}D},\lambda _c)$. The black line is for
 $\psi =0$. Grey/green diamonds indicate elliptical/hyperbolic stagnation points.

However, the growth rate predicted by this theory  $(\approx 0.074)$ does not match the maximum growth rate measured by the global stability at
 $Re=101.5$ and
 $\beta =0.8$
 $(\approx 2.5 \times 10^{-5})$. To obtain a correct prediction of the instability, we consider the correction terms that account for the finite
 $Re$ and wavenumber effects discussed by Landman & Saffman (Reference Landman and Saffman1987), Gallaire et al. (Reference Gallaire, Marquillie and Ehrenstein2007) and Citro et al. (Reference Citro, Giannetti, Brandt and Luchini2015), i.e.
 \begin{equation} \sigma = \sigma_{\infty} - \frac{\beta^2}{Re} - \frac{A}{\beta}. \end{equation}
Note, however, that this is reasonable only if  $A\, Re = O(\beta ^3)$. In doing this, the influence of viscosity on the mode structure is neglected and, therefore,
 $A$ is expected not to depend on
 $Re$. As shown by Gallaire et al. (Reference Gallaire, Marquillie and Ehrenstein2007), the maximum growth rate and the corresponding spanwise wavenumber
 $\beta$ should scale as
 $\sigma _{max} \propto Re^{-1/3}$ and
 $\beta _{max} \propto Re^{1/3}$ (Bayly Reference Bayly1988; Sipp et al. Reference Sipp, Lauga and Jacquin1999); more precisely,
 \begin{equation} \sigma_{max} = \sigma_\infty - (2^{1/3}+2^{-2/3}) \left( \frac{A^2}{Re} \right)^{1/3} \quad \text{and} \quad \beta_{max}= \left( \frac{A\, Re}{2} \right)^{1/3}. \end{equation}
The global stability analysis is used to check these scaling laws. The stability analysis is repeated keeping the Reynolds number of the base flow fixed to  $Re_{BF}=101.5$, and increasing the Reynolds number of the stability problem to
 $Re_{STB}=200,500,1000,1500$ and 2000 to progressively reduce the viscous effects in the eigenvalue problem. Figure 21(a) shows that the leading eigenvalues of the new numerical experiments approximately lay on the same line
 $\sigma _{max} = b + a Re^{-1/3}$, where a least square approximation gives
 $b=0.0748$ that is very close to
 $\sigma _\infty =0.074$. Moreover, the good collapse of
 $\sigma _{max}$ suggest that
 $A$ does not depend on
 $Re$, supporting the hypothesis that the effect of the viscosity on the mode structure is negligible. Figure 21(b) shows that also
 $\beta _{max}$ seems to follow the expected scaling law
 $\beta _{max} \propto Re^{1/3}$. However, there is not agreement in the value of
 $A$ predicted by these two scaling laws. Overall, this analysis indicates that for elongated cylinders, the three-dimensional regular bifurcation for small gaps is the result of an inviscid triggering mechanism.
Global and local stability analysis results for  ${A{\kern-4pt}R} =5$ and
 $g=0.125$. The green diamonds result from the global stability analysis and the red circle from the local analysis. For the global stability analysis,
 $Re_{BF}$ is fixed at
 $Re_{BF}=101.5$ and
 $Re_{STB}$ is increased to
 $Re_{STB}=200,500,1000,1500,2000$. (a) Evolution of the maximum growth rate with
 $Re_{STB}^{-1/2}$. (b) Evolution of the associated wave number with
 $Re_{STB}^{1/3}$. The dashed line is obtained via least square approximation of the global stability results.

The structural sensitivity field for the different  $Re_{STB}$ considered is shown in figure 22. By fixing
 $Re_{BF}=101.5$ and increasing
 $Re_{STB}$, the spatial distribution of the sensitivity map progressively changes. For all
 $Re_{STB}$, the largest values of the sensitivity remain sharply confined within the top wake recirculating region. For large
 $Re_{STB}$, the maximum of
 $S$ moves close to the elliptic stagnation point, and large values are observed over the bottom boundary of the
 $\psi =0$ line where
 $\varDelta <0$. Although the latter large values are compatible with a centrifugal instability, the position of the maximum of the sensitivity raises the question on the role of the elliptical instability in this three-dimensional bifurcation. Indeed, the elliptical instability can be synchronous (Kerswell Reference Kerswell2002) and the spanwise wavelength of the resulting three-dimensional unstable mode depends on the size of the associated elliptic-shaped streamlines (see for example Stewart et al. Reference Stewart, Thompson, Leweke and Hourigan2010b).
Structural sensitivity map for  ${A{\kern-4pt}R} =5$,
 $g=0.125$ and
 $(Re_{BF},\lambda _c)=(Re_{c,3\text{-}D},\lambda _c)$, and (a)
 $Re_{STB}=101.5$, (b)
 $500$, (c)
 $1000$ and (d)
 $1500$. Grey/green diamonds indicate elliptical/hyperbolic stagnation points, respectively.

Figure 23 shows the plot of the structural sensitivity for  ${A{\kern-4pt}R} =5$ and
 $g=4$ at
 $Re_{BF}=212.9$,
 $Re_{STB}=2000$ and
 $\beta =1.1$. Unlike for small gaps, in this case, the structural sensitivity features two local maxima placed within the top and bottom wake recirculating regions, indicating that both regions are involved in the triggering mechanism. This is consistent with the abovementioned Crow instability.
Structural sensitivity map for  ${A{\kern-4pt}R} =5$ at
 $g=4$ at
 $(Re_{BF},\lambda )=(Re_{c,3\text{-}D},\lambda _c)$ and
 $Re_{STB}=2000$. Grey/green diamonds indicate elliptical/hyperbolic stagnation points, respectively.

Cylinders with  ${A{\kern-4pt}R} \le 3$ are now considered, and the asymptotic inviscid stability analysis for
 ${A{\kern-4pt}R} =1$ and
 $g=0.125$ at
 $Re = Re_{c,3\text{-}D} \approx 68.9$ is presented as an example. As shown in figure 24, in this case, the eigenvalue with maximum growth rate has a non-zero frequency and this is not consistent with the results of the global stability analysis. The associated orbit (see the yellow line in figure 25) extends from the region above the longitudinal side of the cylinder to the region downstream of the TE. The inconsistency between the results of the global and local analysis suggest that, unlike for elongated cylinders, for short bodies, the viscous effects play an important role in the triggering mechanism. Note that also in this case, the asymptotic analysis reveals a branch of unstable eigenvalues with null frequency that are associated with orbits that evolve downstream of the TE around the elliptical stagnation point within the TE wake recirculating region. These orbits are the same that have been conjectured to trigger the global instability for
 ${A{\kern-4pt}R} >3$, see the green line in figure 25. One may speculate that, also in this case, the global instability is triggered by the local feedback associated with these orbits. Indeed, it is possible that at finite Reynolds numbers, the maximum growth rate associated with these lines overcomes that of the branch with non-null frequency due to a lower damping effect of viscosity. The fact that these lines cross the regions where the structural sensitivity is maximum and that those associated with eigenvalues with non-null frequency are close to the cylinder where the viscous effects are largest may support this hypothesis.
The WKBJ analysis for  ${A{\kern-4pt}R} =1$ and
 $g=0.125$ at
 $(Re,\lambda )=(Re_{c,3\text{-}D},\lambda _c)$. (a) The
 $(x_0,y_0)$ starting point of the streamlines used for the analysis (blue line). The black line is for
 $\psi =0$; the grey diamonds in the top panel indicate elliptical stagnation points. (b) The WKBJ growth rates
 $\sigma _r$ (circles) and eigenfrequencies
 $\sigma _i$ (triangles) for
 ${A{\kern-4pt}R} =1$,
 $(Re,\lambda )=(Re_{c,3\text{-}D},\lambda _c)$.

Orbits associated with the three unstable branches detected with the WKBJ analysis superimposed on the structural sensitivity map for  ${A{\kern-4pt}R} = 1$,
 $g = 0.125$ at
 $(Re,\lambda )= (Re_{c,3\text{-}D} , \lambda _c )$. The red, yellow and green thick lines indicate the orbits with maximum growth rate of each branch (see figure 24). The black line is for
 $\psi = 0$. Grey/green diamonds indicate elliptical/hyperbolic stagnation points.

6. Conclusion
The present work studies the primary instability of the flow past rectangular cylinders moving along a solid wall. The aspect ratio of the cylinder and the gap height are varied between  $0.5 \le {A{\kern-4pt}R} \le 7$ and
 $0.125 \le g \le 10$, to consider short and elongated cylinders, and small and large gap heights. Reynolds numbers up to
 $Re=300$ are considered. Although the Reynolds number investigated in this work is rather low with respect to that of most applications, in many problems, there is a separation of time and length scales so that the effect of the instabilities detected by the linear stability are still relevant. Independently of
 ${A{\kern-4pt}R}$, the primary instability consists of a Hopf bifurcation towards a two-dimensional unsteady state for
 $g \ge 0.5$, or a regular bifurcation towards a three-dimensional steady state for
 $g < 0.5$.
For  ${A{\kern-4pt}R} \le 1$, the critical Reynolds number of the Hopf bifurcation
 $Re_{c,2\text{-}D}$ monotonically increases when the gap height decreases. In contrast, for larger
 ${A{\kern-4pt}R}$,
 $Re_{c,2\text{-}D}$ does not have a monotonic dependence on the gap height; for large gaps, a decrease of
 $g$ destabilises the flow (
 $Re_{c,2\text{-}D}$ decreases), with the most unstable configuration being observed for
 $g \approx 1$, while the opposite occurs for the smallest gaps. This dependence of
 $Re_{c,2\text{-}D}$ on
 ${A{\kern-4pt}R}$ is explained with the different influence of the ground proximity on the flow in the gap. For short cylinders, a decrease of the gap height results in a stronger acceleration of the shear layer separating from the bottom LE corner both in the fore and aft parts of the cylinder side. In contrast, for elongated cylinders, the shear layer acceleration is stronger only in the aft part of the gap, as the ground proximity results into a decrease of the fluid velocity close to the LE.
The critical Reynolds number of the regular bifurcation  $Re_{c,3\text{-}D}$ increases with
 ${A{\kern-4pt}R}$ for all gap heights. For
 ${A{\kern-4pt}R} \ge 3$,
 $Re_{c,3\text{-}D}$ monotonically increases with
 $g$ towards the free stream value. For shorter bodies, it increases for
 $g \lessapprox 1$ and slightly decreases for larger gap heights. Although the perturbation fields vary smoothly with the gap height for all aspect ratios, the structural sensitivity suggests that the main triggering mechanism of this instability changes for large and small gap heights. For large
 $g$, the perturbation fields resemble that of the Crow instability of a counter-rotating vortex pair, like in free stream, and the structural sensitivity indicates that the two wake recirculating regions placed after the TE cooperate to trigger the instability. For small
 $g$, the structural sensitivity indicates that the main triggering mechanism is embedded in the large recirculating region placed over the top cylinder side. For this case, we put forward some evidence that the centrifugal instability plays a role in the triggering mechanism.
The local WKBJ analysis (Bayly Reference Bayly1988) in the inviscid and short-wave limit has been used to investigate the nature of the three-dimensional regular bifurcation for small gap heights. It shows that it is possible to identify close streamlines along which the integrated growth rate is positive. Three branches of unstable orbits are found, two are stationary and one is unsteady. This provides an assessment of the inviscid nature of the stationary instability, similar to what was observed by Gallaire et al. (Reference Gallaire, Marquillie and Ehrenstein2007) and Barkley et al. (Reference Barkley, Gomes and Henderson2002) for the flow past a bump and a backward-facing step, respectively. For elongated cylinders with  ${A{\kern-4pt}R} >3$, the critical orbit with maximum growth rate is associated with the steady branch of orbits confined in the top-wake recirculating region, and crosses the regions where the structural sensitivity is maximum. In this case, once the corrections for finite Reynolds number and spanwise length scales are applied, the asymptotic results compare very well with the results of the global stability analysis. For shorter cylinders, however, the local theory fails to predict the three-dimensional regular instability. In this case, the critical orbit is on the unsteady branch and partially extends over the top longitudinal side of the cylinder.
Declaration of interests
The authors report no conflict of interest.
Appendix. Sensitivity to the domain size and resolution
In this section, the sensitivity of the results to the domain size and grid resolution is investigated for both the two-dimensional and three-dimensional bifurcations. This is done by performing further global stability computations for  ${A{\kern-4pt}R} =5$ and for different
 $g$.
For the two-dimensional bifurcation, the smallest and largest gap heights, i.e.  $g=0.125$ and
 $g=10$, have been examined. Four additional meshes (
 $M_1- M_4$) have been considered to investigate the sensitivity to the cross-stream and streamwise extent of the domain (
 $M_1$ and
 $M_2$) and to the grid resolution (
 $M_3$ and
 $M_4$). The results are summarised in table 1. For
 $M_1$, the cross-stream extent of the domain is decreased to
 $L_y=g+40$, while the streamwise extent is the same used in the regular grid
 $M_0$, i.e.
 $L_x=105$. For
 $M_2$, the streamwise extent is reduced shifting upstream the position of the outlet; in this case, the computational domain extends for
 $-25 \le x \le 40$ and
 $-g \le y \le 80$. For both cases, the number of triangles is changed to maintain the grid resolution approximately constant. For
 $g=0.125$,
 $Re_{c,2\text{-}D}$ and
 $\mbox {Im}(\gamma _c)$ are within
 $0.45\,\%$ and
 $0.24\,\%$ and within
 $0.86\,\%$ and
 $1.38\,\%$, the values predicted by the regular grid for the
 $M_1$ and
 $M_2$ meshes, respectively. For
 $g=10$, they are within
 $0.06\,\%$ and
 $0.14\,\%$ for
 $M_1$ and within
 $0.27\,\%$ and
 $0.13\,\%$ for
 $M_2$. In contrast, for meshes
 $M_3$ and
 $M_4$, the same domain as
 $M_0$ is used, but the number of triangles is reduced by approximately
 $50\,\%$ and
 $25\,\%$. Both
 $Re_{c,2\text{-}D}$ and
 $\mbox {Im}(\gamma _c)$ are almost insensitive when increasing the resolution from
 $M_4$ to
 $M_0$ for both
 $g=0.125$ and
 $g=10$. In detail, for
 $g=0.125$, the variations of
 $Re_{c,2\text{-}D}$ and
 $\mbox {Im}(\gamma _c)$ compared with the regular grid are within
 $2.85\,\%$ and
 $0.72\,\%$ for
 $M_3$ and within
 $0.03\,\%$ and
 $0.04\,\%$ for
 $M_4$. For
 $g=10$, the variations are within
 $0.14\,\%$ and
 $0.27\,\%$ for
 $M_3$ and within
 $0.08\,\%$ and
 $0.06\,\%$ for
 $M_4$.
Variations of the critical Reynolds number  $Re_{c,2\text{-}D}$ and frequency
 $\mbox {Im}(\gamma _c)$ for the two-dimensional unstable global mode of the rectangular cylinder with
 ${A{\kern-4pt}R} =5$ on four different meshes
 $M_1- M_4$. Both the
 $g=0.125$ and
 $g=10$ gap heights are considered.
 $M_0$ indicates the mesh used for the stability computations in this work.
 $M_1$ indicates the mesh with different cross-stream extension
 $L_y$.
 $M_2$ is the mesh with smaller streamwise extension
 $L_x$ of the domain.
 $M_3$ and
 $M_4$ are the meshes with coarser grid resolution. Recall that all lengths are made dimensionless with the cylinder thickness
 $D$.

For the three-dimensional regular bifurcation, the  $g=0.125$ gap height has been examined and the stability computations have been repeated for the same
 $M_1- M_4$ meshes described above. The sensitivity results are reported in table 2. Again, the results are almost insensitive to a variation of the size of the computational domain. In fact,
 $Re_{c,3\text{-}D}$ and
 $\beta _c$ are within
 $0.35\,\%$ and
 $0.23\,\%$, the values predicted by the regular grid for
 $M_1$ and within
 $0.14\,\%$ and
 $0.68\,\%$ for
 $M_2$. The results obtained with meshes
 $M_3$ and
 $M_4$ confirm that the grid resolution of the regular grid is adequate. Indeed, with mesh
 $M_3$,
 $Re_{c,3\text{-}D}$ and
 $\beta _c$ are within
 $0.40\,\%$ and
 $2.45\,\%$, the values predicted by the regular grid, but with mesh
 $M_4$, they are within
 $0.04\,\%$ and
 $0.34\,\%$.
Variations of the critical Reynolds number  $Re_{c,3\text{-}D}$ and wavenumber
 $\beta _c$ for the three-dimensional unstable global mode of the rectangular cylinder with
 ${A{\kern-4pt}R} =5$ and
 $g=0.125$ on four different meshes
 $M_1- M_4$. The four meshes are as in table 1.

Figure 26 shows the  $M_0$ meshes for the cylinders with
 ${A{\kern-4pt}R} =1$ and
 ${A{\kern-4pt}R} =5$ and
 $g=0.125$, and visualises the distribution of the triangles in the regions close to the cylinder and close to the wall.
Visualisation of two meshes used for the stability computations in the region close to the cylinder and close to the wall. (a)  ${A{\kern-4pt}R} =1$ and
 $g=0.125$. (b)
 ${A{\kern-4pt}R} =5$ and
 $g=0.125$.