Introduction
The green lacewing, Chrysoperla carnea (Stephens) is a key predator utilized in agriculture for the management of various pests (Lingren et al., Reference Lingren, Ridgway and Jones1968; Mulligan et al., Reference Mulligan, Ferry, Jouanin, Romeis and Gatehouse2010). The three larval stages of C. carnea are voracious polyphagous feeders and can eat up to 487 aphids or 511 whitefly pupae before pupation (Afzal & Khan, Reference Afzal and Khan1978). It is a beneficial predator, which is used in integrated pest management (IPM) programs for the management of pests in many horticultural and agricultural cropping systems. It is one of the most generally used and commercially available predators and can inhabit many diverse agro ecosystems (Pree et al., Reference Pree, Archibald and Morrison1989; Tauber et al., Reference Tauber, De-Leon, Penny and Tauber2000). It can be easily mass reared and has a wide host range (Rajakulendran & Plapp, Reference Rajakulendran and Plapp1982; Zeleny, Reference Zeleny, Canard, Semeria and New1985). It is an efficient predator of pests such as whitefly (Bemisia tabaci), thrips (Thrips tabaci), aphid (Lipaphis erysimi, Aphis gossypii), jassid (Amrasca devastans), mealy bugs (Phenacoccus solenopsis), Colorado potato beetle (Leptinotarsa decemlineata), bollworms (Helicoverpa armigera, Earius vitella/insulana) and army worms (Spodoptera litura) (Wang & Nordlund, Reference Wang and Nordlund1994; Syed et al., Reference Syed, Ashfaq and Khan2005).
Some species of Chrysoperla are known to show tolerance or resistance to insecticides which makes the predator compatible with the most IPM systems (Pree et al., Reference Pree, Archibald and Morrison1989). Predators such as C. carnea may develop resistance against insecticides similar to their target insects, but they tend to develop resistance slowly due to a combination of ecological, biochemical and biological factors (Roush & Daly, Reference Roush, Daly, Roush and Tabashnik1990). C. carnea can develop resistance either by direct contact with insecticides or by eating other insects that have been treated with insecticides (Wu et al., Reference Wu, Jiang and Miyata2004; Wu & Miyata, Reference Wu and Miyata2005). Resistance to several groups of insecticides has been found in C. carnea populations from Pakistan (Pathan et al., Reference Pathan, Sayyed, Aslam, Razaq, Jilani and Saleem2008, Reference Pathan, Sayyed, Aslam, Liu, Razzaq and Gillani2010).
Sublethal effects are the physiological or behavioral effects on individuals that survive exposure to a pesticide. A sublethal dose/concentration is defined as inducing no apparent mortality in the experimental population (Desneux et al., Reference Desneux, Decourtye and Delpuech2007). Sublethal effects of insecticides interact with numerous life-history traits (i.e., fertility, fecundity, developmental rate, survival and sex ratio) involved in the reproduction of beneficial arthropods (Desneux et al., Reference Desneux, Decourtye and Delpuech2007). Despite the potential effectiveness of biological control, many crop protection practices are primarily based on broad-spectrum insecticides which are noxious to beneficial arthropods (Desneux et al., Reference Desneux, Decourtye and Delpuech2007) and that affect agricultural sustainability (Wilson & Tisdell, Reference Wilson and Tisdell2001). An accurate assessment of potential side effects of insecticides on natural enemies is critical for developing effective IPM strategies (Desneux et al., Reference Desneux, Denoyelle and Kaiser2006; Stark et al., Reference Stark, Vargas and Banks2007). However, insecticides could induce multiple sublethal effects in individuals that survive after exposure to a given insecticide (Desneux et al., Reference Desneux, Decourtye and Delpuech2007) and these effects could have important impacts on the population dynamics of natural enemies (Stark & Banks, Reference Stark and Banks2003). Sublethal effects could impair neurophysiology, development, adult longevity, immunity, fecundity and sex ratio and behavior such as mobility, orientation, feeding, host searching, oviposition and mating (Desneux et al., Reference Desneux, Pham-Delegue and Kaiser2004, Reference Desneux, Decourtye and Delpuech2007; Suma et al., Reference Suma, Zappala, Mazzeo and Siscaro2009; Arno & Gabarra, Reference Arno and Gabarra2011; Saber, Reference Saber2011; Stara et al., Reference Stara, Ourednickova and Kocourek2011). Life table experiments provide a more accurate measure of toxic effects than do lethal concentration estimates and have been used successfully to evaluate the side effects of pesticides on several natural enemies (Acheampong & Stark, Reference Acheampong and Stark2004; Stark et al., Reference Stark, Vargas and Miller2004).
Spinosad is derived from the soil microbe, Saccharopolyspora spinosa (Bret et al., Reference Bret, Larson, Schoonover, Sparks and Thompson1997; Thompson & Hutchins, Reference Thompson and Hutchins1999). Its active ingredients are spinosyn A and spinosyn D. Spinosad acts by depolarizing neurons in the insect nervous system affecting gamma aminobutyric acid (GABA) and acetylcholine transmission (Salgado, Reference Salgado1997, Reference Salgado1998). It is a reduced risk insecticide and is highly effective against targeted pests. Spinosad is less toxic to mammals, birds, fish and human beings and can be used in IPM programs as an alternative insecticide to conventional insecticides (Cleveland et al., Reference Cleveland, Mayes and Cryer2001; Cisneros et al., Reference Cisneros, Goulson, Derwent, Penagos, Hernandez and Williams2002). Spinosad is used in many countries as well as Pakistan for the management of various pests in ornamental plants, vegetables, field crops and fruit trees.
Fitness costs associated with insecticide resistance are where the development of resistance to an insecticide is accompanied with high energetic cost or other significant disadvantages that diminished the insect's fitness compared with its susceptible counterparts in the population (Kliot & Ghanim, Reference Kliot and Ghanim2012). Many studies have shown that fitness costs are associated with insecticide resistance (Argentine et al., Reference Argentine, Clarck and Ferro1989; White & Bell, Reference White and Bell1990; Carriere et al., Reference Carriere, Deland, Roff and Vincent1994; Liu & Han, Reference Liu and Han2006; Sayyed et al., Reference Sayyed, Ahmad and Crickmore2008a ; Jia et al., Reference Jia, Liu, Zhu, Liu, Gao and Shen2009; Wang et al., Reference Wang, Qiu, Wang, Qiao and Wang2010; Abbas et al., Reference Abbas, Shad and Razaq2012), in some cases, however, the resistant strain has a fitness advantage or there is no fitness difference between resistant and susceptible strains (Beeman & Nanis, Reference Beeman and Nanis1986; McKenzie, Reference McKenzie1993; Bielza et al., Reference Bielza, Quinto, Gravalos, Abellan and Fernandez2008; Pathan et al., Reference Pathan, Sayyed, Aslam, Liu, Razzaq and Gillani2010; Basit et al., Reference Basit, Sayyed, Saeed and Saleem2012). Increases in fitness due to insecticide resistance have been reported for the green peach aphid, Myzus persicae (Eggers-Schumacher, Reference Eggers-Schumacher1983), diamondback moth, Plutella xylostella (Sayyed & Wright, Reference Sayyed and Wright2001; Sayyed et al., Reference Sayyed, Cerda and Wright2003) and green lacewing, C. carnea (Pathan et al., Reference Pathan, Sayyed, Aslam, Liu, Razzaq and Gillani2010). If resistance evolution in Chrysoperla can result in a fitness advantage and no deficit then these predators could be used in the IPM system without any adverse effect of insecticides. A thorough understanding of the biological traits of C. carnea, affected by insecticide resistance, could therefore contribute to the development of more realistic models of using predators in the IPM systems. Life-history parameters give the broadest description of the survival rate, development time and reproduction of a population.
The use of insecticide-resistant natural enemies can prevent secondary pest outbreaks and pest resurgence in many cropping systems in which chemical management of pests is a common practice. Knowledge of pesticide selectivity to biological control agents is necessary for the successful implementation of biological and chemical control methods in IPM programs. Knowledge of the life-history parameters of both predator and prey is also essential for mass rearing and practical application of a predator in biological control systems (Chi & Getz, Reference Chi and Getz1988; Chi & Yang, Reference Chi and Yang2003). The current study was conducted to understand the impact of insecticide resistance on life-history traits of a spinosad-selected strain of C. carnea collected from an area where resistance against different insecticides has been reported in C. carnea (Pathan et al., Reference Pathan, Sayyed, Aslam, Razaq, Jilani and Saleem2008).
Materials and methods
Insects general rearing
The adults of C. carnea were kept in plastic rearing cages (23×38×38 cm) with ventilation holes on both sides containing artificial diet (yeast, honey and distilled water with the ratio of 1:2:4 (1 g+2 g+4 ml, respectively) (Pathan et al., Reference Pathan, Sayyed, Aslam, Razaq, Jilani and Saleem2008, Reference Pathan, Sayyed, Aslam, Liu, Razzaq and Gillani2010). All the insects were kept at 25±2 °C, 60–65% relative humidity (RH) and 14:10 h (light:dark) photoperiod. Black glossy papers were hung in cages for the egg laying. The egg-laden papers were removed on alternate day from the rearing cages. Single eggs were placed in vertical cell holes (4–3 mm) in plastic Perspex cell plates (locally made). After 2–3 days, eggs hatched in these vertical cells. Eggs of Sitotroga cereallela were frozen and provided to newly hatched larvae of C. carnea in separate hole and replaced after 48 h (Pathan et al., Reference Pathan, Sayyed, Aslam, Liu, Razzaq and Gillani2010).
Susceptible population
The susceptible population of C. carnea was collected from Multan in 1999 designated as the Susceptible population and reared in the laboratory without exposure to any insecticide or without outside gene flow for >12 years as described by Pathan et al. (Reference Pathan, Sayyed, Aslam, Razaq, Jilani and Saleem2008, Reference Pathan, Sayyed, Aslam, Liu, Razzaq and Gillani2010) and Sayyed et al. (Reference Sayyed, Pathan and Faheem2010). The Susceptible population may have reduced fitness due to inbreeding; therefore an unselected (UNSEL) population which has same genetic background as the selected (Spino-SEL) population was also used for comparison of fitness parameters.
Population selection with spinosad
The field population of C. carnea was collected from crop areas of Multan in 2011, brought in the laboratory and reared as described above. The bioassay of spinosad (Tracer 24 SP, Arysta Life Sciences, Pakistan) was performed at the first generation (G1; referred as field population hereafter) (table 1). Then the field population was divided into two further subpopulations at G1. One population was left unselected, designated as UNSEL and other population was selected with spinosad for five generations and designated as Spino-SEL. For selection, the first instar larvae were topically exposed to insecticides at an LC50 dose of 1078 μg ml−1 for five generations by micro applicator equipped with 1 ml glass syringe and 0.5 μl of an insecticide solution. This insecticide solution was applied onto the thorax of individual larva as described previously (Sayyed et al., Reference Sayyed, Pathan and Faheem2010). A total of 100 larvae were exposed per generation. The insecticide-exposed larvae were fed on the eggs of S. cereallela for food until they pupated. The mean survival of larvae for the five generations of selection was 40%.
Resistance of Susceptible, UNSEL, Spino-SEL and field populations of C. carnea to spinosad.

The numbers of larvae used in the bioassay, including control were 350. FL=fiducial limits.
RRa=resistance ratio, calculated as (LC50 of field, UNSEL, Spino-SEL population)/(LC50 of Susceptible population).
RRb=LC50 of Spino-SEL population)/(LC50 of UNSEL population).
RRc=LC50 of Spino-SEL population)/(LC50 of field population).
* χ2 value is calculated by probit analysis using POLO software.
** P-values are based on Chi-square goodness-of-fit test. P-values >0.05 suggest goodness of fit of the model.
Concentration-response bioassay on larvae
Bioassays were done on 2–3-day-old larvae of C. carnea by application of insecticide solution onto individuals as mentioned above. The four concentrations ranged between, 250 and 2000 μg ml−1 for the field collected population, 1000 and 8000 μg ml−1 for Spino-SEL, 50 and 300 μg ml−1 for the UNSEL and Susceptible populations and were prepared as serial dilutions for each bioassay with each concentration being replicated four times. Single larva was placed in an individual cell of a rearing plate and 20 larvae were treated in each replication, therefore 80 larvae were used for each insecticide concentration and 30 control larvae were treated with water only. The insecticide exposed larvae were fed on eggs of S. cereallela. All bioassays were kept at 25±2 °C temperature, 60–65% RH and 14:10 h photoperiod (light:dark). Data were taken 72 h after treatment.
Life table parameters
A total of 150 neonates were collected randomly from each of the Spino-SEL, UNSEL and Susceptible populations for fitness parameters determination. Neonates were weighed once and then reared individually in capsules containing S. cereallela eggs. The capsules were arranged as five replicates for each population and 30 larvae were used for each replication in the same dish. All stages of insects were kept at the laboratory standard conditions as described above. Larval mortality and larval durations were recorded daily. The pupae were weighed within 24 h after pupation. The mean relative growth rate (MRGR) was calculated as
 $${\rm MRGR} = [{\rm In}\,W_1 (mg)-{\rm In}\,W_2 (mg)]/{\rm DT,}$$
where W 1 is the pupal weight and W 2 is the initial larval weight. DT is the time (days) from initial larvae (L 1) to pupal stage (Radford, Reference Radford1967).
The newly emerged male and females were paired into families within 24 h. A single family was used as one replication, and five replications were used for each population. Each family was kept in a plastic jar (9×11 cm) for oviposition. The eggs were collected every day to evaluate fecundity (lifetime laid eggs per female) and egg-hatching rate until the female died. The percent egg hatching was recorded according to the method of Liu & Han (Reference Liu and Han2006) as follows:
 $${\rm Hatchability = All\, neonates/All\, eggs}{\rm.} $$
The net replacement rate (R 0), was calculated according to the method of Jia et al. (Reference Jia, Liu, Zhu, Liu, Gao and Shen2009) as follows:
 $$R_0 = N_{n\, + \, 1} /N_n, $$
where N n is the number of individuals of the parent population and N n+1 is the number of individuals in the population of the next generation. The relative fitness value of Spino-SEL population was calculated according to the method of Cao & Han (Reference Cao and Han2006) as follows:
 $$\eqalign{{\rm Relative\, fitness ={ \, R_{\rm 0} \,{\rm of\, Spino - SEL\, population} \over R_{\rm 0} \,{\rm of\, UNSEL\, population}}{\rm.}} $$
The intrinsic rate of population natural increase (r m) was recorded according to the method of Birch (Reference Birch1948) and Alyokhin & Ferro (Reference Alyokhin and Ferro1999)
 $$r_{\rm m} = {\rm ln}\,R_0 /{\rm DT,}$$
where DT is the developmental time from egg to adult emergence.
Biotic potential (B P) was calculated according to the method of Roush & Plapp (Reference Roush and Plapp1982) as follows:
 $$B_{\rm P} = {\rm ln}\,F/{\rm DT}_{\rm r}, $$
where F is the fecundity and DTr is the ratio between the mean development time of considered population and UNSEL population.
Estimation of realized heritability (h 2) for Spino-SEL population
The realized heritability (h 2) was estimated as calculated by Tabashnik (Reference Tabashnik1992), h 2=response to selection (R)÷selection differential (S). R was calculated as R=[log (final LC50) – log (initial LC50)]/n, where the final LC50 is the LC50 of population after n generations of selection and initial LC50 is the LC50 of parental population before selection. S was calculated as S=iσp, where i is the intensity of selection and is calculated according to the method of Falconer (Reference Falconer1989) and σp is the phenotypic standard deviation, calculated as σp=[1/2(initial slope+final slope)]−1.
Statistical analysis
Concentration-response data were analyzed by probit analysis (LeOra Software) (Finney, Reference Finney1971) with EPA Probit Analysis Program (Version 1.5) (EPA, 1999) in order to determine the LC50 values, Chi-square (χ2), 95% fiducial limits (FLs), slopes of log dose–probit lines and standard errors. LC50 values were considered to be significantly different (P<0.01) if their 95% FLs did not overlap (Litchfield & Wilcoxon, Reference Litchfield and Wilcoxon1949). The slopes were compared using the linear regression model with Statistix 8.1 (Analytical software) (Anonymous, 2005). Data on larval and pupal duration, pupal weight, development time, fecundity, MRGR, biotic potential and intrinsic rate of increase were analyzed using the General Linear Model procedure at 5% level of significance to check the effects of population on different variables, the fixed effect model was employed as follows:
 $$Y_{ij} = {\rm \mu} + P_i + e_{ij}, $$
where Y ij is the response variable, μ is the population average, P i represents the ith population (i=1, 2, 3) and e ij is the random error associated with each observation and is supposed to be normally distributed with mean μ and variance σ2.
The proportional data of hatching, pupation rate, emergence rate of healthy adults and survival were analyzed using χ2 distribution. The means were compared by the least significant difference test at P≤0.05.
Results
Resistance of Susceptible, UNSEL, Spino-SEL and field populations to spinosad
Susceptibility to spinosad was significantly different between all the populations as their FLs did not overlap. The slope of the regression lines were significantly different among all the populations tested (F=6.53, d.f.=2, 6, P=0.03) (table 1). After selection for five generations, the resistance ratio increased 172.53- and 73.37-fold compared with the Susceptible and UNSEL populations, respectively, and 13.63-fold compared with the field population at G1 (table 1). There was no significant (P>0.05) increase in the slope for Spino-SEL compared with the field population at G1, while the slope for UNSEL was significantly (P<0.05) increased (table 1).
Life-history traits
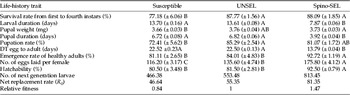
The means for different life-history traits of Spino-SEL, UNSEL and Susceptible populations are given in table 2. The mean larval duration (F=920, d.f.=2, 12, P<0.01) and mean pupal duration (F=687, d.f.=2, 12, P<0.01) of Spino-SEL population were highly significantly shortened compared with the UNSEL and Susceptible populations; however, the pupal duration of the UNSEL and Susceptible populations were similar (P>0.05). The mean pupal weight of the Spino-SEL population was significantly higher than the Susceptible population (F=13.0, d.f.=2, 12, P<0.01) but similar to the UNSEL population (P>0.05). There was a highly significant difference in the development time from egg to adult of the Spino-SEL population (F=1067, d.f.=2, 12, P<0.01) compared with the UNSEL and Susceptible populations. Spinosad selection increased the fecundity of C. carnea females as the results showed that there was a highly significantly difference in the mean number of eggs laid by Spino-SEL females compared with UNSEL and Susceptible females (F=56.1, d.f.=2, 12, P<0.01).
Mean fitness parameters for Susceptible, UNSEL and Spino-SEL populations of C. carnea.

Within rows, values sharing common letters are not significantly different (P>0.05).
The survival rates from first to fourth instars of the Spino-SEL population was significantly higher compared with the Susceptible population (χ 2 =8.06, d.f.=2, P=0.017) but similar to the UNSEL population (P>0.05). There was no significant difference in the pupation rate among the populations tested (χ2=5.20, d.f.=2, P=0.074). The emergence rate of healthy adults from the Spino-SEL population was significantly higher compared with that of the UNSEL and Susceptible populations (χ 2 =5.90, d.f.=2, P=0.052). The percentage of eggs hatching in the Spino-SEL population was higher (χ 2 =6.10, d.f.=2, P=0.047) compared with that of the UNSEL and compared with the UNSEL strain, the relative fitness value of Spino-SEL was 1.47 (table 2).
MRGR, intrinsic rate of population increase and biotic potential
The means of MRGR, intrinsic rate of population increase and biotic potential are given in table 3. The MRGR of Spino-SEL was significantly higher (F=128, d.f.=2, 12, P<0.01) than that of the UNSEL and Susceptible populations. The intrinsic rate of population increase of Spino-SEL was significantly higher (F=202, d.f.=2, 12, P<0.01) compared with the UNSEL and Susceptible populations. The biotic potential of the Spino-SEL population was maximum compared with the UNSEL and Susceptible populations; moreover all the tested populations were highly significantly different (F=120, d.f.=2, 12, P<0.01). The association between the intrinsic rate of natural increase and MRGR of population was highly significant (r=0.96, P<0.01) and the association between the intrinsic rate of natural increase and biotic potential was also highly significant (r=0.97, P<0.001).
MRGR, intrinsic rate of population increase (r m) and biotic potential of the Susceptible, UNSEL and Spino-SEL populations of C. carnea.

Within columns, values sharing common letters are not significantly different (P>0.05).
Estimation of realized heritability (h 2)
The heritability after selection five generations with spinosad was 0.37. The h 2 value for spinosad was high, with the number of generations required for a ten-fold increase in LC50 estimated to be 4.54 (reciprocal of R; table 4).
Estimation of realized heritability (h 2) of spinosad resistance in C. carnea.

1 Initial and final LC50 values were determined at G1 and G5, respectively, given in table 1.
2 Response to selection: log (final LC50) – log (initial LC50)/n.
3 Percentage of the population with values above the selection threshold (percentage surviving selection).
4 Intensity of selection calculated from tables in Falconer (Reference Falconer1989).
5 Phenotypic deviation=1/2 (initial slope+final slope)−1.
6 Selection differential (difference in mean phenotype between the selected parents and the entire parental generation, S=i×σp).
7 Realized heritability (R/S).
Discussion
The role of general predators as the biological control agents is well known (Symondson et al., Reference Symondson, Sunderland and Greenstone2002; Pathan et al., Reference Pathan, Sayyed, Aslam, Liu, Razzaq and Gillani2010) but their stability in field crops depends on the lack of disturbance by insecticides. Therefore, it is essential to study the effect of insecticides on evolution of resistance and impact of resistance on the fitness of predators. The effects of insecticides on predators vary, depending on species, mode of application and developmental stage. To explain whether the insecticide alone has any effect on predator, the insecticides should be directly applied to the predator, because possible alterations in the insecticides can occur when they pass through the prey (Romeis et al., Reference Romeis, Meissle and Bigler2006). The present results showed that the development of resistance due to regular selection with spinosad was 12.65-fold compared with that of field population. This suggests that the laboratory selected population can tolerate insecticide pressure in field conditions. Previously, resistance to various insecticides has been reported in C. carnea (Pree et al., Reference Pree, Archibald and Morrison1989; Pathan et al., Reference Pathan, Sayyed, Aslam, Razaq, Jilani and Saleem2008).
The genetic background of populations can influence their fitness. Therefore, it is difficult to isolate variations in fitness due to possession of a resistant mutation from that due to variations in genetic background in which they are expressed (McKenzie et al., Reference McKenzie, Whitten and Adena1982). The UNSEL and Spino-SEL populations were separated for only five generations with five rounds of selections, whereas the Susceptible population was in the laboratory for more than 12 years before the start of this study. In addition, the populations were maintained under identical laboratory conditions for at least 1 year.
The Spino-SEL population of C. carnea showed fitness advantage associated with insecticide resistance compared to the UNSEL and Susceptible populations (table 2). The Spino-SEL population had significantly shorter pupal duration and egg to adult development time compared with the UNSEL and Susceptible populations. In addition, the number of eggs laid per female and hatching in Spino-SEL population was also increased compared with the UNSEL and Susceptible populations. Previously, Pathan et al. (Reference Pathan, Sayyed, Aslam, Liu, Razzaq and Gillani2010) found that the dominance of fitness in pyrethroid and organophosphate resistant population of C. carnea was due to significantly higher fecundity, greater eggs viability and shorter developmental time. In the current study, the Spino-SEL population also showed a dominance of fitness due to significantly higher fecundity, high hatchability and shorter pupal duration and developmental time compared with the UNSEL and Susceptible populations. The rapid increase in insecticide resistance in the field population also suggests that the evolution of resistant alleles primarily depends upon fitness dominance (Carriere et al., Reference Carriere, Ellers-Kirk, Patin, Sims, Meyer, Liu, Dennehy and Tabashnik2001).
The observed fitness benefits associated with resistance to spinosad are expected to drive increase of resistance in the absence of selection. However, resistance levels were reduced in the UNSEL population between G1 and G6. This seemingly counter-intuitive result could be due to fitness costs not examined in this study. There also remains the possibility that the observed fitness effects are a result of recent prior exposure to spinosad in the field. Such trans-generational effects may disappear in subsequent generations in the absence of insecticide selection pressure (Janmaat & Myers, Reference Janmaat and Myers2005; Rahman et al., Reference Rahman, Baker, Powis, Roush and Schmidt2010).
The intrinsic rate of population increase (r m) indicates the potential of a population to increase under the conditions tested. The Spino-SEL population of C. carnea showed a significantly greater intrinsic rate of population increase compared with the UNSEL and Susceptible populations. Intrinsic rate of population increase is closely related to MRGR (Sayyed & Wright, Reference Sayyed and Wright2001; Sayyed et al., Reference Sayyed, Ahmad and Crickmore2008a ; Pathan et al., Reference Pathan, Sayyed, Aslam, Liu, Razzaq and Gillani2010; Abbas et al., Reference Abbas, Shad and Razaq2012). Previously, the intrinsic rate of population increases in pyrethroid- and organophosphate-resistant C. carnea (Pathan et al., Reference Pathan, Sayyed, Aslam, Liu, Razzaq and Gillani2010), spinosad and Bt toxin Cry1Ac-resistant P. xylostella (Sayyed et al., Reference Sayyed, Cerda and Wright2003, Reference Sayyed, Saeed, Noor-Ul-Ane and Crickmore2008b ) and deltamethrin- and indoxacarb-resistant Heliothis virescens (F.) (Sayyed et al., Reference Sayyed, Ahmad and Crickmore2008a ) had a close association with the MRGR. In the current study, we found that this relationship was also significant with an increase in MRGR resulting in a corresponding increase in the intrinsic rate of population increase. The larger rate of population increase seemed to be largely due to a high fecundity, high hatchability and shorter developmental time in the Spino-SEL population compared with the UNSEL and Susceptible populations. The differences in the intrinsic rate of population increase among resistant and Susceptible populations tested suggest that there were obvious fitness benefits for C. carnea in the presence of resistant alleles.
Falconer (Reference Falconer1989) reported that realized heritability (h 2) is the amount of phenotypic variation accounted for by additive genetic variation. Low h 2 reflects more phenotypic variation and less additive genetic variation. Higher phenotypic variation can come from gene mutation and selection pressure under laboratory conditions, whereas under field conditions it can come from migration of populations, alternation of insecticides, selection pressure and environmental factors. In the current study, the value of h 2 was calculated to estimate the proportion of phenotypic variation that could be assigned to additive genetic variation. The higher h 2 (0.37) for C. carnea resistance after selection for five generations with spinosad demonstrated that C. carnea may have a higher chance of resistance development to spinosad than other insecticides, such as deltamethrin (h 2=0.22), alphamethrin (h 2=0.11), lambda-cyhalothrin (h 2=0.02), chlorpyrifos (h 2=0.03) and profenofos (h 2=0.01) in C. carnea (Sayyed et al., Reference Sayyed, Pathan and Faheem2010). A higher value for spinosad (h 2=0.37) indicated a greater genetic variation for resistance (table 4). Because of higher additive genetic variation, the LC50 values among G1 and G5 for spinosad increased significantly compared with LC50 at G1 (table 1). This suggests that the field population had a higher frequency of resistance alleles. These observations are consistent with the fact that the population used in this experiment was collected from Multan area where different insecticides, including new chemistries, pyrethroids and organophosphates are being used to control several insect pests (Pathan et al., Reference Pathan, Sayyed, Aslam, Razaq, Jilani and Saleem2008; Saleem et al., Reference Saleem, Ahmad, Aslam and Sayyed2008).
Pesticides cause side effects on life-history traits involved in the beneficial arthropod reproduction and ecological services. Thus, an accurate assessment of potential side effects of insecticides on natural enemies is critical for developing effective IPM strategies (Desneux et al., Reference Desneux, Denoyelle and Kaiser2006; Stark et al., Reference Stark, Vargas and Banks2007). Effects of spinosad have been studied in many natural enemies such as Chelonus insularis (Cresson), Eiphosoma vitticolle (Cresson), Aphytis melinus (DeBach), Coccophagus lycimnia (Walker), Leptomastix dactylopii (Howard), Deraeocoris brevis (Uhler), Hyposoter didymator and Harmonia axyridis (Pallas) (Galvan et al., Reference Galvan, Koch and Hutchison2005; Penagos et al., Reference Penagos, Cisneros, Hernandez and Williams2005; Kim et al., Reference Kim, Brooks and Riedl2006; Suma et al., Reference Suma, Zappala, Mazzeo and Siscaro2009; Biondi et al., Reference Biondi, Mommaerts, Smagghe, Vinuela, Zappala and Desneux2012). Considering that insecticides are still considered the major component of pest suppression in several crop systems, minimizing their side effects on natural enemies will increase their use sustainability. Thus, the resistant natural enemies would survive higher rates of the insecticide and could develop to adulthood without adverse effects and reproduce successfully (Iqbal & Wright, Reference Iqbal and Wright1996).
In the present study, the authors selected a population of predator resistant to one chemical, but did not examine cross-resistance to other chemicals of the same insecticide family or multiple-resistance to other insecticides. Therefore, other studies aiming at addressing this aspect and the potential effects of resistance to other compounds on predator fitness are needed before implementing biocontrol strategies, employing these resistant predator strains. The potential for management, manipulation and integration of predators in the cropping systems, where resistance to insecticides in predators has become extensive and widespread, could be implemented in several cropping systems. The potential for introducing these natural enemies into cropping systems is a useful tactic for the management of pests.
Acknowledgements
We are grateful to Pakistan Agriculture Research Council for providing space and laboratory facilities to M.M.M. We are also grateful to Dr Neil Crickmore for English grammar and sense editing of manuscript.