1.0 INTRODUCTION
Aviation, in all its forms, is an extremely important part of modern life. According to the International Air Transport Association (IATA),(1) each year, almost 3Bn people use air transport for business, social and leisure reasons, whilst air cargo currently accounts for 35% of world trade, carrying high value and perishable goods at high speeds to markets inaccessible by any other means. Therefore, it is no exaggeration to say that civil aviation ‘enables’ the commercial world as we know it. Civil aviation also improves the quality of life of hundreds of millions of people through wealth creation, social connectivity and recreation, whilst military aviation provides security and defence.
These benefits are not just for the wealthier nations. Aviation allows the developing countries to build the all-important, international networks and to grow their economies faster, with some of the poorest countries on Earth having the most to gain (see Ref. 2).
As the global population grows, the need to develop strong economies also grows and, consequently, the demand for air transport will grow. If, for any reason, global air transport was to be constrained, or restricted, there could be immediate and serious economic, societal and security consequences. Therefore, it is important to look ahead continually to identify issues that may impede progress and to have implementable solutions ready should the need arise. The accurate assessment of aviation's impact on the global climate, the identification of options for mitigation and the implementation of an action plan require long time scales and vast amounts of resource. It is very important to know what actions to take and when to take them.
2.0 THE GROWTH OF COMMERCIAL AVIATION AND ITS CONSEQUENCES
Between 1948 and 1998, commercial aviation capacity grew from almost zero to 4Tn available passenger seat kilometresFootnote 1 (ASKs) per year. Between 1998 and 2014, the average annual capacity, growth rate was 4.5% and, consequently, the annual provision of ASKs doubled over that period. All observers and pundits (see Refs 3, 4 and 5) expect this level of growth to continue for the foreseeable future. Consequently, the number of ASKs per year provided globally is expected to double every 16 years. If this growth is achieved, in the year 2050, there will be almost ten times more ASKs flown than in 1998.
Currently, the air transport system uses the gas turbine, fuelled by kerosene derived from fossil-based sources, as its source of power. The airborne gas turbine is an ‘open system’. Therefore, when the propulsive jet leaves the engine and returns to the atmosphere, it carries with it all the products of the combustion process. When kerosene is burned in excess air, the principal products are water vapour and carbon dioxide. However, the exhaust gases also include a mixture of nitric oxide and nitrogen dioxide, collectively known as NOX, together with a range of aerosols that depend upon the source of the fossil fuel and soot, which depends upon the design of the engine's combustion system.
Carbon dioxide is an important greenhouse gas and a major contributor to global warming and, hence, to climate change. Most importantly, a significant fraction of any carbon dioxide emission is ultimately distributed globally and remains in the atmosphere for centuries, being slowly removed through natural carbon ‘sinks’. The well-known sinks are plants, the soil and the oceans. Therefore, carbon dioxide is the gas that determines climate change in the long term.
By generating and emitting carbon dioxide, aviation makes an undeniable contribution to long-term climate change. Therefore, it is important to understand the consequences of the projected market growth on CO2 emissions. The mass of carbon dioxide generated per unit mass of kerosene burned is given (see for example Reference PollRef. 6) by the Emission Index (EI), where
 $$\begin{equation*}
{\rm E{I_{C{O_2}}}} = \frac{{{\rm{mass}}\ {\rm CO}_{2}}}{{{\rm{mass}}\ {\rm{kerosene}}}} = 3.16.
\end{equation*}$$
In 2015, 247 megatonnes (247million tonnes) of jet fuel were burned to deliver 8Tn ASKs. Consequently, about 780 megatonnes of carbon dioxide were released into the atmosphere and, since the carbon came primarily from fossil fuel, the total amount of carbon dioxide in the atmosphere increased. If the anticipated market growth becomes a reality, in the year 2050, over 1 gigatonne (1Bn tonnes) of kerosene will be needed, and between 2015 and 2050, a total of 21 gigatonnes of kerosene will have been burnt, adding about 66.5 gigatonnes of carbon dioxide to the atmosphere.
To assess the impact of this at the global level, we note that the total mass of gas in the atmosphere(Reference Trenberth and Smith7) is about 5,150 teratonnes (5.15×10¹⁸kg) and that, today, the concentration of carbon dioxide is about 400 parts per million by volume (400ppmv). Hence, the atmosphere currently contains about 3.12 teratonnes (3.12×10¹⁵kg) of CO2. Therefore, by 2050, aviation alone will have released enough carbon dioxide to increase the concentration in the atmosphere by about 8.5ppmv, or just over 2% by volume. However, as already noted, some carbon dioxide is progressively removed from the atmosphere by the natural ‘sinks’. Therefore, over a period of 35 years, these will have removed some of aviation's CO2. Whilst the fraction taken up cannot be determined with any real precision, the information given by Joos et al. in Reference JoosRef. 8 suggests that it will be in the region of 25%. Hence, allowing for natural absorption, the total amount of carbon dioxide in the atmosphere would increase by about 6.5ppmv or 1.5%.
An increase in the absolute level of atmospheric carbon dioxide of between 6 and 8ppmv over a period of 35 years is not something that can be easily overlooked.
3.0 THE INTERNATIONAL ACTION ON CLIMATE CHANGE
The United Nations Framework Convention on Climate Change (UNFCCC) is an international environmental treaty, negotiated at the Rio de Janeiro Earth Summit in 1992 and which came into force in 1994 (9 ). The objective of the treaty is to limit the amounts of greenhouse gases in the atmosphere to levels that prevent anthropogenic interference with the climate system. The 21st UNFCCC conference in Paris in December 2015 produced, what has been described as, the ‘first comprehensive climate agreement’. So far, 191 member states have signed the agreement and 86, including, China, the United States and India, have ratified it.
Specifically, the governments agreed
-
• a long-term goal of keeping the increase in global average temperature to well below 2°C above pre-industrial levels;
-
• to aim to limit the increase to 1.5°C, since this would significantly reduce risks and the impacts of climate change;
-
• on the need for global emissions to peak as soon as possible, recognising that this will take longer for developing countries;
-
• to undertake rapid reductions thereafter in accordance with the best available science.
Before and during the Paris conference, comprehensive national climate action plans were presented. However, it was recognised that the combined effect of these would not be sufficient to keep global warming below 2°C and that more stringent action would be required in the future.
Therefore, the international community is taking climate change very seriously, with some countries now openly accepting that drastic action may be necessary to meet the agreed objectives. However, perhaps the most important outcome from the UNFCCC is the recognition that it is the mean global temperature rise that matters and not just the atmospheric concentrations of any particular gas. This development has important consequences for aviation.
4.0 AVIATION'S CONTRIBUTION TO THE MEAN GLOBAL TEMPERATURE RISE
The relationship between aviation's emissions and global mean temperature rise is extremely complex. However, the physical process that provides the link between the cause and the effect is ‘radiative forcing’ (see Reference LeeRef. 10). Simply put, any substance present in the atmosphere that has a positive radiative forcing is contributing to the global mean temperature rise.
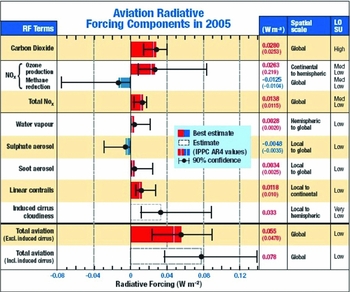
There has been a great deal of work published on this subject and a well-known summary figure, due to Lee et al.( Reference Lee 10 ), is reproduced here as Fig. 1. This lists the gas turbine emissions and gives an estimate of the corresponding radiative forcing values, together with an indication of the current degree of uncertainty. Also given are indications of the spatial extent of the effects and the current Levels Of Scientific Understanding (LOSU).
Radiative forcing components for aviation from Lee et al.(Reference Lee10)

The list contains only two greenhouse gases, namely carbon dioxide and water vapour; both have a warming effect at the global scale. However, the other constituents also have radiative forcing components, and all bar two have a warming effect. NOX, whilst not itself containing greenhouse gases, changes the concentrations of two important atmospheric greenhouse gases, namely ozone and methane, through a series of complex chemical reactions. The net impact of NOX is warming, whilst sulphate and soot aerosols have approximately equal but opposite forcing, leaving little net effect. At the bottom of the list, we have ‘linear contrails’ and ‘induced cirrus cloudiness’. Combined linear contrails and induced cirrus are estimated to provide a net radiative forcing of +0.045 watts/m2. This is slightly larger than the net radiative forcing of all the other components. However, this estimate is subject to a high degree of uncertainty, as indicated by the wide separation of the bars, and the current level of scientific understanding is rated as ‘low’.
The timescales, or lifetime, of the various emissions are not shown in the figure, nor are the timescales of the resulting thermal effects. However, as already stated, a significant fraction of a carbon dioxide emission remains in the atmosphere for centuries. All the other emissions are relatively short lived, staying in the atmosphere for periods ranging from minutes to hours in the case of contrails, hours to days for clouds and months to years for NOX. Regarding the timescales of the effects, we note (Reference Lee10) that the heat from all sources of positive radiative forcing entering the oceans today takes about 50 years to dissipate. Therefore, the effects may still be felt long after the causes have disappeared.
The conclusion is that aviation's interaction with the global atmosphere is very complex and the effects extend over wide ranging spatial and temporal scales. It is also clear that although carbon dioxide emissions, whilst long lived, are a significant element in aviation's impact on mean global temperature, they are not necessarily the largest contributor. It may well be that in the very short term, contrails and contrail-induced cirrus clouds are making the largest contribution to mean global temperature rise. If this proves to be the case, actively controlling contrail formation now would affect near-term climate change. Therefore, these phenomena need further detailed investigation so that the current levels of uncertainty can be reduced and, if necessary, action initiated.
5.0 CONTRAILS AND CONTRAIL-INDUCED CIRRUS CLOUDS
Contrails are simply fields of ice crystals, formed by an interaction between the aircraft and the atmosphere. In general, when the ambient pressure and/or temperature of humid air are progressively reduced, there comes a point at which some of the water must condense to form liquid droplets and, if the local temperature is low enough, these droplets will freeze. The first step in this double phase change is nucleation and the speed at which nucleation proceeds depends on the level of impurities (e.g. dust) that are present.
Engine jets are initially hot and contain high levels of water vapour and aerosols. As the jet discharges into the atmosphere, mixing produces rapid cooling. However, contrails are not always observed. This is because there is a thermodynamic condition, known as the Schmidt-Appleman criterion(Reference Schumann11), that must be satisfied before a contrail forms. The criterion links the ambient humidity and pressure with the amount of water vapour and thermal energy in the jet exhaust to determine a critical ambient air temperature below which the engine's water vapour will freeze out to form the visible ice crystals. The presence of the aerosols guarantees that nucleation will be very rapid and the contrail will form very close to the aircraft. If the humidity of the ambient air is low, these ice crystals will evaporate quickly and the contrail will only extend a relatively short distance (100s of metres) behind the aircraft. In this case, the contrail is said to be ‘non-persistent’. Even when the Schmidt-Appleman criterion is not satisfied, on rare occasions, there is enough naturally occurring aerosol in the ambient air for the lowering of the local air pressure over the upper wing surface to be sufficient to initiate a non-persistent contrail.
At high altitude, where the air is almost totally devoid of dust particles, or other contaminants, nucleation can be very, very slow and, consequently, ambient water vapour can be found at temperatures significantly lower than those at which ice would normally form. In such circumstances, the air is said to be ‘super-saturated with respect to ice’. If a contrail forming aircraft encounters ice super-saturated air, there is a coupling between the aircraft contrail and the water vapour in the atmosphere. As the aircraft flies along, the wing generates two powerful contra-rotation vortices that ‘trail’ behind the aircraft for many miles. These vortices have cores in which the local pressure is lower than that of the surrounding atmosphere and the flow field dynamics is such that the engine exhaust, ice crystals, unfrozen water vapour and the aerosols are captured and held within them. As these cores move through the stationary super-saturated air, the local pressure drops and, with the ice crystals and aerosols to aid nucleation, the excess water vapour in the atmosphere rapidly turns to ice. Vortex dynamics also traps this new ice in the cores. The resulting contrail, with its characteristic twin parallel line structure, can extend for many miles, with its length depending primarily on the extent of the super-saturated region. Such contrails are described as ‘persistent’. Over a period ranging from minutes to an hour, the vortex is dissipated by viscosity and as the flow field weakens, the ice is released to either evaporate, descend to lower altitudes or to spread out laterally to form a cloud.
The amount of atmospheric ice liberated by this process may be up to 10million times the mass of the kerosene being burned in the engines(Reference Penner12). In the northern latitudes, regions of ice super-saturated air are common and tend to form close to the tropopause (about 35,000 ft), having a lenticular shape many miles long, but usually only a few thousand feet deep.
Persistent contrails are major atmospheric events and, since they are visible, it is a matter of everyday observation that they occur often and that, on some occasions, they evolve into ‘contrail-induced’ cirrus. There is a growing body of evidence(13) suggesting that, up to now, the impact of contrail-induced cirrus may have been underestimated and that contrails and contrail-induced cirrus could well be aviation's single largest contribution to global warming.
6.0 THE CHALLENGE TO THE INDUSTRY
Aviation has been under sustained scrutiny and challenge by the environmental lobby for some 20 years. Over the same period, research has confirmed that aviation is indeed a significant contributor to global warming. Nevertheless, for very powerful socio-economic reasons, air transport capacity has grown and it looks set to continue to grow for the foreseeable future. As a result, the impact on climate will increase. At some point in the near future, there is the potential for a collision between the political forces of societal benefit and those of environmental impact and it is highly desirable that such a thing be avoided, if possible. The question is how?
In order to get a better understanding of the challenge, we should first look back and ask what drives change in the airline industry, how have the challenges of the past been met and perhaps ask the more fundamental question of who owns the problem. Is it the regulatory bodies, the aircraft manufacturers, the air traffic services, the airports, the airlines, the passengers or even society at large?
7.0 WHY WAS THE JET ENGINE ADOPTED IN THE FIRST PLACE?
In the late 1940s, the civil aviation fleet was powered by piston engines. Courtesy of a massive wartime investment in research and development, the piston engine was a highly evolved, efficient, affordable machine that could deliver good performance. However, it was also a highly complex device, requiring frequent overhaul, and it was very costly to maintain. The mean time between failures was not much greater than the flight time for the very longest routes and it was not unusual to experience an engine failure in flight.
By way of example, in 1950, a trip from London to Sydney, the so called ‘Kangaroo route’, took 4 days in a Lockheed Constellation. This aircraft carried 30 passengers and 8 cockpit crew. The airborne time was 57 hours, with two overnight stops and with 36 hours spent on the ground. The four engines would go through eight take-off and landing cycles each, and with engine overhaul required every 1,500 hours, or about 250 cycles, major, expensive maintenance was needed after about 15 round trips.
Consisting essentially of just one moving part, i.e. a rotating shaft carrying a fixed compressor and a turbine, the jet engine was, by comparison, simplicity itself. Unfortunately, this great advantage was accompanied by a near threefold increase in fuel consumption. However, in those days, kerosene was virtually a waste product of the oil industry and, consequently, very cheap compared to gasoline. The flight speed was high, but this was offset by the need to refuel more often. Hence, in the early days, the flight times for the longest journeys were about the same. Therefore, whilst the public was sold the speed, the smoothness and the glamour of travel by jet aircraft, in purely operational terms, the major gain was the much reduced maintenance cost for the airline.
The wisdom of the decision to switch to the jet engine is borne out by the fact that a trip from London to Sydney today takes 22 hours, with one brief stop, using an Airbus A-380. The aircraft carries 500 passengers and 4 cockpit crew. The four engines go through two cycles each and, with major engine overhaul now required every 7,000 cycles, or about 1,800 round trips, the jet engine has allowed the major overhaul frequency to be reduced by a very impressive two orders of magnitude.
This is not the only example of an industry change driven by reduced maintenance cost. From the 1960s, engine manufacturers began to offer more reliable, higher thrust engines. All other things being equal, aircraft with four, or three, engines are safer and have intrinsically better take-off performance than twin-engined aircraftFootnote 2 . However, two engines are cheaper to maintain than three or four, and so today, three- and four-engined aircraft are a rarity.
The lesson to be learned is that the industry does not take up advanced technology automatically. Change requires a very strong business case, with a significant impact on the airline's economic performance. The bigger the financial return, the quicker the technology is adopted. Financial pressure drives change.
8.0 HOW HAS THE ENVIRONMENTAL IMPACT VARIED?
Looking back over the past 70 years, it is interesting to ask how the environmental impact of each commercial flight has changed. To do this, we must recognise that, if there is a passenger in every seat, the emissions per flight depend upon three things
-
• the mass of the aircraft structure per passenger carried
-
• the fuel consumption of the engines
and
-
• the type of fuel used,
whilst the formation of persistent contrails depends upon the cruise altitude.
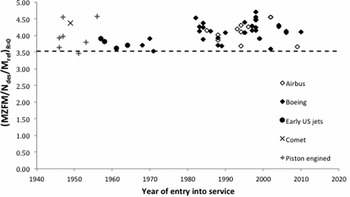
Figure 2 shows the variation of the maximum zero fuel massFootnote 3 per unit reference passenger mass (person plus bags, Mref is 95kg) as a function of the year in which the aircraft entered service. The data paint a rather surprising picture in that, over 70 years, the weight of aircraft structure per passenger carried has hardly changed at all and that the jet aircraft of today, with all their exotic, modern materials, are not significantly lighter than the all-metal, piston engine aircraft of the 1940s.
Variation of aircraft maximum zero fuel mass per passenger with service entry date.

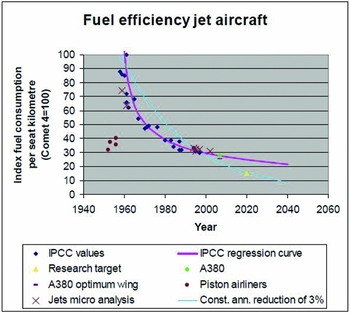
Figure 3, taken from the work of Peters et al.(Reference Peters, Middel and Hoolhorst14), shows the variation of the fuel consumption per (available) seat kilometre normalised with that of the Comet 4. It can be seen that, when jet aircraft were first introduced, fuel consumption increased sharply. The data also show that it has taken 60 years, largely through the development of the high by-pass, turbo-fan engine, to bring the overall fuel consumption levels of aircraft with jet engines back down to those of the piston-engined aircraft of the 1940s and early 1950s.
Variation of fuel burned per ASK for a range of aircraft versus service entry date, according to Peters et al.(Reference Peters, Middel and Hoolhorst14).

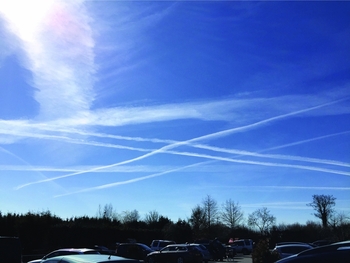
Finally, since the ratio of hydrogen to oxygen atoms for kerosene (approximately C11H21) and gasoline (approximately C8H14) are similar, their emission indices for carbon dioxide are almost the same, being 3.16 and 3.20, respectively (i.e. the amount of CO2 emitted per unit mass of fuel burned is about the same). Therefore, in terms of carbon dioxide emissions and after 7 decades of technical development, aviation's environmental impact per available seat kilometre is broadly back to where it was in the late 1940s. Moreover, since piston-engined aircraft cruised at altitudes that were significantly lower than 30,000 ft, they hardly ever produced persistent contrails, a situation that was significantly better than the one we have today (see Fig. 4).
A typical early morning linear contrail and induced cirrus cloud display (Podington, Bedfordshire, UK in April 2016)

The inescapable conclusion is that all the technical advances introduced since the 1950s have delivered little, if any, reduction in the environmental impact per ASK flown.
9.0 WHAT CAN THE MANUFACTURERS DO ABOUT ENVIRONMENTAL IMPACT?
Currently, there appears to be a widely held belief that the challenges of the environmental impact of aviation can all be solved by advances in aircraft-related technology and billions of dollars and Euros are currently being spent on research to achieve this goal. However, the usefulness of technical advances in any particular area is determined by the laws of physics and not by the amount of research money expended.
In essence, the manufacturers’ challenge is easily stated.
“An environmentally optimum aircraft is one that burns the absolute minimum amount of fuel for a given trip, whilst producing no persistent contrails”.
How hard can this be?
In the current market environment, the only aircraft produced are the ones that the airlines intend to buy. Long gone are the days when manufacturers would build aircraft on their own initiative, offer them to the market and hope that they sold. This was a possibility up to the end of the 1960s, when there were still a significant number of aircraft companies competing for business. A good, and perhaps the last, example of a manufacturer producing an aircraft without endorsement by, or commitment from, customers was the Boeing 747, a programme upon which senior management reputedly bet the company; this being the second such time, having previously bet the company on the Boeing 707 programme. However, the past 50 years has seen a steady process of industrial consolidation that has left virtually the whole market in the hands of two players: Boeing and Airbus. With approximately half the market each and fierce competition, the appetitive for risk taking is, understandably, very low. Therefore, by and large, the airlines say what they want, and the manufacturers strive to provide it.
10.0 WHAT ROLE DOES PHYSICS PLAY?
Through the process of fleet planning and other commercial considerations, an airline seeking a new aircraft will produce a ‘requirement’. This will have three core elements, i.e.
-
• the number of passengers to be carried, Ndes (taken here to be the maximum number of passengers that can be accommodated in a ‘single class’ cabin configuration).
-
• the design range, Rdes (taken here to be the range at maximum payload)
and
-
• the design speed (taken here to be the cruising speed).
The first two are obvious, but the third perhaps not so. However, speed is extremely important because, on an airline's network of routes, speed translates into time and time is a critical element in the airline operating costs. On the face of it, speed may seem to be an innocent constraint, but it has major implications for both the aircraft design and the consequent environmental impact.
In determining how this airline requirement translates into environmental impact, some ‘figures of merit’ are needed. Suitable candidates are
-
1. The Energy-To-Revenue-Work ratio (ETRW). This is defined as the energy liberated by burning fuel divided by the product of the payload weight and the distance flownFootnote 4 , i.e.
where MTF is the mass of the trip fuel (kg), LCV is the lower calorific value of the fuel (43.106J/kg for kerosene), MP is the payload mass (kg), g is the acceleration due to gravity (m/sec2), and R is the distance flown (m). In airline commercial jargon, the product of payload and distance travelled is expressed in terms of the Revenue Tonne-Kilometre (RTK) and is the quantity used to describe the route's economic performance. A comprehensive description of the ETRW and its significance can be found in Reference PollRef. 6. $$\begin{equation*}{\rm{ETRW}} = \frac{{{\rm{MFT}}.{\rm{LCV}}}}{\rm{MP.g.R}} \approx 4.4\frac{{{\rm{MTF}}}}{{{\rm{RTK}}}},\end{equation*}$$

Clearly, from both a commercial and an environmental perspective, the lower ETRW is the better.
-
2. The cruise altitude
From an environmental point of view, the aircraft needs to cruise at altitudes well below those that contain the regions of ice super-saturated air and, hence, avoid the production of persistent contrails.
Although it may not be obvious, for a given airline specification of size, distance and speed and a given technology level, the requirement that the aircraft has the minimum ETRW is sufficient to determine virtually the whole configuration. In its basic form, the ‘design chain’ runs as follows:
-
I. The passenger number determines the size (anthropomorphic constraint), shape (wide body or narrow body) and weight of the fuselage. For civil aircraft configurations, the fuselage weight is dominated by the amount of material in the outer shell. This, in turn, is driven by the maximum permissible hoop stress in the skin, which is determined by the maximum operational pressure differential between the cabin and outside air. Due to the dangers of hypoxia following a rapid cabin depressurisation, the maximum operational altitude is usually limited to 42,000 ft. The mass of the fuselage is largely independent of the wing geometry.
-
II. For the specified range and speed, there is a particular wing geometry that delivers a combined wing, engine and fuel weight for which the trip fuel burn is a minimum. The search for this solution proceeds as follows:
-
a. For the specified cruise Mach number (derived from the speed requirement), there is a particular combination of wing sweep (Λ) and wing thickness-to-chord ratio (t/c) that simultaneously maximises both the product of overall propulsive efficiency and airframe lift-to-drag ratio (ηoL/D) and (t/c.cos2 (Λ)). Since wing weight is usually driven by the bending stress levels experienced in the inner wing (root) structure, having the maximum value of (t/c.cos2 (Λ)) guarantees that, whatever the wing area and aspect ratio, the wing weight will be minimised (e.g. see Reference TorenbeekRef. 15).
and
-
b. For fixed sweep and thickness-to-chord ratio, there is a unique combination of wing planform area, wing span and cruise lift coefficient for minimum trip fuel burn, i.e. the wing geometry is now completely specified as is the required engine thrust and weight, plus the total fuel mass. From the point of view of fuel burn, the fin and tailplane are of secondary importance. Nevertheless, their size and strength are fully determined by physics, through aerodynamic and strength requirements.
-
Given the scale and cost of manufacture, it is natural to think that aircraft design must be very complicated and that this ‘design chain’ is far too simplistic. However, it must be stressed that the process outlined here delivers the aircraft with the minimum ETRW and these are the core elements that are driven purely by physics and linked by mathematics. The key point to note is that, for a given level of technology, there is only one configuration for minimum fuel burn, and the designer's challenge is to find it.
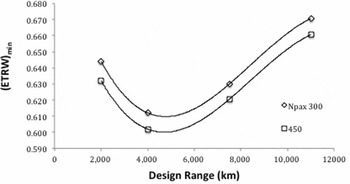
This being the case, it is possible to follow these steps using well-established, simple, conceptual design relations of the kind set out in Reference TorenbeekRef. 15. Some sample calculations have been performed and the results are given in Figs 5 and 6. Figure 5 shows the variation of minimum ETRW with design range for wide body aircraft carrying 300 and 450 passengers at a cruise Mach number of 0.825. The results show that there is a particular design range at which the ETRW is smallest. This is about 4,500km, and it is not particularly sensitive to the passenger number. For longest ranges likely to be flown, the ETRW is about 10% greater than this lowest value, reflecting the need for the longer range aircraft to burn fuel to carry fuel. The reduction in efficiency at the shorter ranges is the result of the climb phase becoming a larger fraction of the total trip. Secondly, the effect of the passenger number on the ETRW is small. The results indicate that there is less than 2% advantage in efficiency when the aircraft is designed to carry 450 rather than 300 passengers.
Variation of minimum ETRW as a function of design range and maximum passenger number for a cruise Mach number of 0.825.

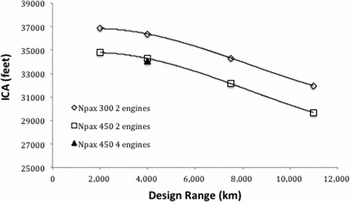
Variation of initial cruising altitude for the minimum ETRW aircraft as a function of design range and passenger number for a cruise Mach number of 0.825.

Figure 6 shows the variation of the Initial Cruise Altitude (ICA) with design range and maximum passenger number. It should be noted that this quantity is an output of the design process and not an input as is often supposed. In order to maintain the minimum fuel burn rate, the aircraft must cruise at a constant lift coefficient. When cruising at a constant Mach number, this is achieved by slowly increasing altitude as fuel is burned and the aircraft gets lighter. Taking this operational factor into account, the results suggest that the minimum values of ETRW will be obtained when the aircraft is flying at altitudes at, or around, 35,000 ft. In the northern latitudes, this is the approximate location of the tropopause, which is where the regions of ice super-saturated air tend to occur. Neither the number of passengers nor the number of engines affects the cruising altitudes significantly. Therefore, it appears that, for the current level of technology, the laws of physics dictate that aircraft designed to minimise emissions are condemned to be the most likely to produce persistent contrails. However, this conclusion needs to be examined in more detail.
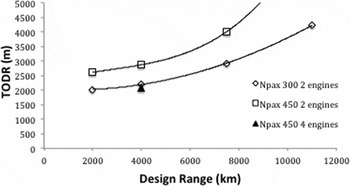
Figure 7 shows the variation of the legally required take-off distance with the same parameters. As would be expected, the longer range, heavier aircraft require a greater runway length, as do aircraft that carry more passengers. Also shown is the effect of going from two engines to fourFootnote 5 . All other things being equal, a four-engined aircraft requires significantly less runway than a twin. This is because the legally required take-off distance is usually determined by the situation in which one engine is inoperative. Clearly, a four-engined aircraft with one engine closed down still has 75% of its thrust available, whilst the twin has only 50%. This results in a lower allowable flap setting and lower acceleration, both of which imply greater distance requirementsFootnote 6 .
Variation of the legally required take-off distance for the minimum ETRW aircraft as a function of design range, maximum passenger number and number of engines, when the cruise Mach number is 0.825.

Clearly, the purchasing airline will have aircraft operating between a number of specific destinations, each with a different length runway. To serve these destinations, the aircraft's minimum required take-off distance will be determined by the airport with the shortest runway. This may mean that the aircraft with the minimum ETRW, as derived from the specified passenger number, range and speed, may not be able to operate from this airport. In this case, the manufacturer may have to increase the gross wing area, install a more powerful engine, or use a combination of both measures, in order to achieve the required field performance. The imposition of these additional constrains on the design will mean that the aircraft's ETRW is increased. Hence, it will use more trip fuel and each flight will have a greater impact on the environment.
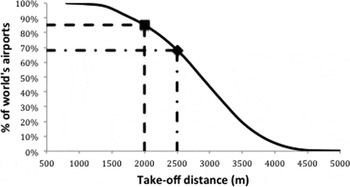
The current global air transport network has about 1,000 destinations and many runways, if not the majority, were laid down during the Second World War when the basic length was 2,000m, or less. Over the past 70 years, some of these airports have been able to extend their runways, but proposals for development often meet fierce local opposition. This has resulted in the global distribution of runway size shown in Fig. 8, using data from Jenkinson et al.(16). The curve clearly illustrates the market advantage of reducing an aircraft's required runway length. For example, an aircraft that requires 2,500m can operate from about 70% of the world's airports. However, if the take-off distance could be reduced to 2,000m, this number would increase to 85%. The ability to operate from 15% more destinations would be an obvious marketing advantage and it would be tempting to trade this significant commercial benefit for a bit of additional fuel burn.
Number distribution of world's airports in terms of available runway length.

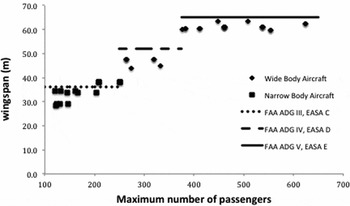
In addition to the runway length, there may also be restrictions on wingspan imposed by the size of the departure gates. Wingspan limits are defined by the regulator; those for Europe (EASA) and the USA (FAA) are given in Refs 17 and 18, respectively. Since these requirements are harmonised, the permitted dimensions are essentially international.
Figure 9 shows how the wingspans of current aircraft vary with the maximum passenger number. The regulator-defined gate sizes are also shown. Clearly, in most cases, aircraft have wingspans that are at, or close to, the maximum permitted values. This suggests strongly that airport imposed wingspan limits may be constraining aircraft design. As indicated above, the aircraft with minimum ETRW has a specific span. Therefore, if the wingspan that can be accommodated at the airport gate is less than that of the corresponding minimum ETRW aircraft, an aircraft designed to fit the gate must burn more fuel.
Variation of wingspan with maximum single class and passenger number for current aircraft.

The conclusion is that, for a given level of technology, the laws of physics alone are sufficient to allow an aircraft, with a specified passenger number, design range and cruise speed, to be designed for minimum fuel burn. This provides a useful and unambiguous analytic benchmark. However, the need to operate from existing airports with short runways and narrow gates may well mean that current aircraft burn more fuel and have a greater impact upon the environment than necessary. This possibility needs to be explored in more depth and more detail.
Finally, it is important to recognise and appreciate the indirect role that aircraft noise plays in climate change. Satisfying the demands for ever lower noise levels made by people living close to airports, invariably results in increased fuel burn and, hence, increased impact on climate. Both the modification of near ground climb profiles and the extension of flight paths to avoid noise sensitive areas imply increased fuel consumption. Therefore, when airport development is restricted to satisfy the needs of the few, there may well be a consequential climate cost for the many.
11.0 HOW ARE THE PROSPECTS FOR REDUCING AVIATION'S ENVIRONMENTAL IMPACT LOOKING RIGHT NOW?
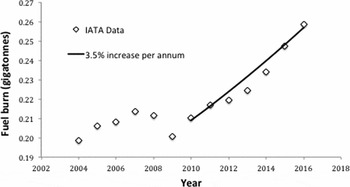
In order to answer this question, we must first examine the trends for market growth and annual, global fleet, fuel consumption. These are published by IATA (the sources are all available on the IATA website in Ref. 1) and the data are given in Figs 10 and 11. Figure 10 shows the variation of the revenue tonne-kilometresFootnote 7 delivered and, with the exception of a brief period coinciding with the global financial crisis of 2007 to 2009, the growth rate is strong and positive. From 2010 to the present, the growth rate has been steady at about 4.8%. This is close to the level that the industry expects (hopes) to see until at least 2035.
Variation of air transport revenue work performed per annum with time.

Variation of global fleet annual fuel consumption with time.

Figure 11 shows the corresponding growth in annual fuel consumption. As would be expected, the trend mirrors that of Fig. 10 and, for the past 6 years, the growth rate has been about 3.5%.
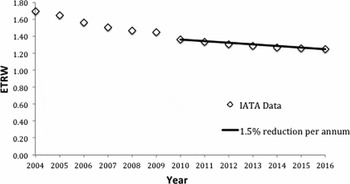
The difference in the growth rates for the RTKs delivered and the annual fuel consumption implies that the efficiency of the global air transport system is steadily improving. This is demonstrated in Fig. 12, which shows that the global fleet-averaged ETRW has been showing a long-term, steady, but slow, improvement and, for the past 6 years, the rate of improvement has been about 1.5% per annum. The reason for this is simple. As new, more efficient, aircraft are introduced, the fleet gets more efficient.
Variation of the global fleet averaged energy-to-revenue work ratio with time.

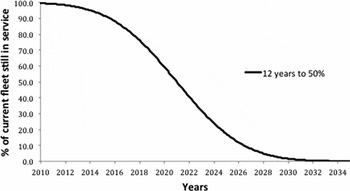
However, achieving efficiency targets by retiring older aircraft and replacing them with new ones is a slow and expensive process. To deliver an acceptable financial return to their owners, be they airlines or leasing companies, aircraft have to stay in revenue earning service for a period of at least 20 years. According to Ascend(3), the global fleet replacement schedule has the form shown in Fig. 13. This being the case, it will take 12 years to turn over 50% of the aircraft and the whole of the current fleet of aircraft will have been replaced by 2035. This time scale is consistent with manufacturers’ current market forecasts.
Percentage of aircraft still in service versus time for a total turnover of the global fleet.

At present, the typical efficiency step change from old to new aircraft is about 20%. Clearly, if every aircraft was replaced by one that was 20% more efficient, the fleet average efficiency at the end of the turnover period would be 20% better than it was at the beginning. Hence, the fleet in 2035 would be 20% better than the fleet in 2010, i.e. an average year-on-year improvement of just 0.8%Footnote 8 . At the current stage in the turnover process, the efficiency benefits are expected to be in the region of 1%. Therefore, the figure of 1.5% shown in Fig. 12 suggests that airlines have been finding additional efficiency improvements in other areas.
The cost of turning over the current fleet of approximately 20,000 aircraft is in the region of $2Tn. Therefore, simply put, with the currently available technology and the economic constraints of aircraft ownership, it will take airlines about 25 years and cost something like $2Tn to improve the global fleet average ETRW by 20%.
12.0 HOW ARE GOVERNMENTS REACTING TO THE ENVIRONMENTAL CHALLENGE OF AVIATION?
Civil aviation is controlled by the International Civil Aviation Organisation (ICAO). This is a United Nations specialised agency established under the Chicago Convention of 1944. ICAO has the power to impose regulation through its International Standards and has done so with great success in the case of noise and NOX.
Aviation emissions are categorised as either ‘national’ or ‘international’. National emissions are included in the inventories of individual countries and are assumed to be dealt with through national policies. Very approximately, 30% of all aviation is classed as ‘national’. This leaves about 70% to be treated by international regulation. Clearly, since nature does not recognise this artificial separation, impact at the global level requires a coordination of proper and effective, national and international plans and actions.
In response to the growing concerns over aviation and the environment, in 2009, IATA proposed that global aviation should aim to achieve ‘zero carbon growth rate by 2020’. At the 37th Assembly in 2010, ICAO resolved, amongst other things, to include two important new elements in its plan. These were
-
• Global aspirational goals for the international aviation sector of improving 2% annual fuel efficiency and stabilising its global CO2 emissions at 2020 levels
and
-
• The development of a global CO2 Certification Standard
Since 2010, the development of the CO2 Certification Standard has proved to be both difficult and controversial. The metric, upon which the Standard will be based, was agreed in 2013 and the Standard itself was finalised in 2016. A summary of the problems with the metric can be found in Green and Jupp(Reference Green and Jupp19). Notwithstanding some important scientific and technical shortcomings, there are a whole raft of other difficulties, including the length of aircraft working lives and the length of aircraft production runs, plus a host of political issues. Consequently, the Standard will apply to new types entering the type certification process after January 2020. These are aircraft that are likely to enter service in 2024. However, newly built aircraft of a type certified before 2020 and, if delivered after January 2028, will have to meet a more lenient form of the Standard.
According to the International Council on Clean Technology(Reference Rutherford and Kharina20), the regulation will deliver an average, cruise fuel consumption reduction of about 4% per for new (2028) aircraft compared with those delivered in 2015. The actual percentage reductions are expected to be in the range 0 to 10% depending upon the maximum take-off mass of the aircraft. Therefore, the levels of reduction envisaged and the timescales for introduction are such that the regulation will have very little impact on aviation's contribution to climate change before 2050.
Recognising that advances in technology, operational improvements and sustainable alternative fuels may not prevent the continued growth in CO2 emissions beyond 2020, ICAO has resolved to develop a Global Market-Based Measures (GMBM) scheme in order to allow the airline industry to meet its target of ‘carbon-neutral growth’ (CNG2020) beyond 2020. The resulting scheme is called the Carbon Offsetting Scheme for International Aviation (COSIA). Under it, airlines will be required to purchase carbon offsets in the global carbon market, i.e. to pay for carbon reduction measures in some other sector, sufficient to offset their share of the growth in international CO2 emissions beyond the level reached in 2020. The scenario proposed by ICAO is shown in Fig. 14.
Variation of the carbon dioxide emissions from international aviation with time according to the ICAO scenario.

The underlying quantitative ICAO scenario is revealed by a deconstruction of the graphs. Firstly, if aircraft technology is frozen at the 2010 level, the ‘business as usual’ growth rate is being taken to be 4.6%. This is consistent with the growth rates shown in Fig. 10 and with the assumptions made in most market forecasts. Secondly, some operational improvements are anticipated, but the annual rate is only about 0.2%. Thirdly, the improved technology contribution is coming at just 1% per annum. This is consistent with the scenario of a complete turnover of the current fleet with aircraft that are 20% more efficient by 2035, plus an extra bit for luck – as indicated in Fig. 13. Therefore, in order to meet the target of zero net growth from 2020 onwards, the offset contribution from the COSIA scheme must grow at a rate of 3.4% per annum.
Strictly speaking, Fig. 14 applies only to international aviation. However, any technical and operational benefits would apply to all aircraft. Therefore, allowing for the 70/30 split between international and national flights, it is possible to deduce that the zero net growth level for emissions from 2020 implies that about 1 teratonne of CO2 will still be released into the atmosphere each year.
13.0 WHAT DOES THIS ALL MEAN?
From all the publicity, media statements and public relations campaigns, it might appear that ICAO, IATA, the aircraft manufacturers and the airlines are making great strides towards addressing the climate impact issues. However, the introduction of an ICAO standard for CO2, whilst welcome, will in all probability have very little impact on aircraft emissions over and above the improvements that would have happened anyway through technological developments delivered by the usual commercial, competitive processes. Moreover, this simple analysis indicates that, by 2050 and according to the ICAO schedule, aviation will have only halved its integrated contribution to the atmospheric, carbon dioxide level compared to the ‘business as usual’ scenario. Notwithstanding all these measures, an additional 35 teratonnes of CO2 will have been added and this is equivalent to an increase in the atmospheric concentration of 4ppmv, or 1% by volume.
At this point, it is important to re-iterate the fact that CO2 is only a problem for the environment if the carbon is fossil-based. Over the past decade much has been said and written about the potential contribution from ‘alternative’ fuels whose carbon comes from the present day atmosphere. However, there are many challenging issues that must be overcome. There are ethical objections to the use of certain biofuels. The end-to-end production process for synthetic fuel must not emit fossil carbon. A new industry with massive production capacity and worldwide distribution is needed. There are engine-related technical issues still to be overcome. However, whilst none of these are showstoppers, the pace of development of the alternative fuels industry is heavily dependent upon the price of crude oil. Currently, oil is below $50 per barrel and could stay at this level for a long time. In this situation, these fuels are effectively locked out on cost grounds. Therefore, over the next few decades, the airline industry will only be able to gain a small benefit from alternative fuels. Therefore, the carbon dioxide problem is still very real.
Moreover, the contrail-induced effects, which depend, primarily, on the number of flights per year rather than on the fuel burn, could well have increased globally by a factor of between two and three in direct response to the size of the 2050 global fleet. Therefore, if contrail-induced cirrus is as powerful an influence on radiative forcing as some (e.g. Reference Burkhardt and KärcherRef. 13) are suggesting, the climate impact of aviation in 2050 will still be very large indeed.
Therefore, since the present trajectory will not reduce aviation's impact on the environment in absolute terms, the scrutiny from other sectors and policymakers will not only continue but will probably intensify. In addition, the airline industry will become seriously exposed to the cost of offset measures. The COSIA programme gets CO2 onto the airline balance sheets in a direct way, which, given the lessons of the past, is a very good thing. However, the uncertainties surrounding its long-term operation introduce a very large unknown into airline business models. At present, the price for carbon is only about $0.84 per barrel, but observers expect this to rise to much higher levels in the longer term.
14.0 WHAT ABOUT OPERATIONAL EFFICIENCY?
As noted above, the ICAO model only envisages an annual reduction of 0.2% in emissions through improved operations. This very small number warrants a closer examination.
Referring to Fig. 5, we see that, for the unconstrained, minimum fuel aircraft, ETRW is in the region of 0.65. However, Fig. 12, shows us that the average value of ETRW for the global fleet is currently about 1.3. Clearly, if every aircraft in the global fleet always operated at its optimum efficiency, the fleet average value would be the same as that of the individual aircraft (i.e. about 0.65). Therefore, the inescapable conclusion is that, currently, within the global air transport system, there is close to 100% ‘wastage’ through non-optimum operations.
This wastage could be the result of a number of factors. However, the most obvious causes are
-
• Low load factors, i.e. not filling every available seat or carrying the maximum amount of ‘belly’ freight.
-
• Three class seating configurations. Seating layouts are chosen to maximise airline revenue rather than maximise the number of passenger carried. For current long haul flights, available seat numbers are about 70% of the maximum.
-
• Poor matching of aircraft to routes, i.e. taking an aircraft with a specific design range (at which the efficiency is maximised) and operating it over shorter or longer distances (both of which mean reduced efficiency)
and
-
• Large deviations from the optimum flight trajectories as a result of air traffic control directives.
For reasons that are unclear, ICAO does not appear to have recognised, or targeted, this problem.
Improvements in operational efficiency are potentially very large, may not need new technology, could be started today, could deliver environmental impact reduction immediately, and may not be expensive. Examples that easily spring to mind include:
-
• improved load factors
-
• reduced number of ‘premium’ seats
-
• closer matching of routes and individual aircraft optimum ranges
-
• better integration of passengers and cargo to maximise revenue-bearing payload weight
-
• more flexible and more efficient ATM
-
• use of the prevailing winds to reduce annual fuel burn by allowing free choice of cruise altitudes
and
-
• freedom to fly true minimum fuel burn trajectories for flights of less than 1,000km
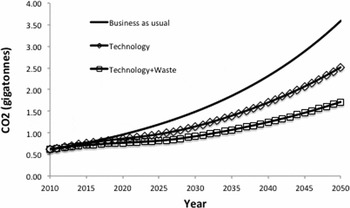
The impact of a progressive squeezing out of the wastage at just 2.5% per annum is shown in Fig. 15. Clearly, waste removal is a powerful factor and, when combined with realistic, fleet turnover effects, reduces CO2 emissions markedly. The net effect is of the same order as that envisaged by the, as yet unidentified, market-based measures. Therefore, if technology improvements, efficiency improvements and global-based market methods are deployed, it may even be possible to reduce aviation's annual CO2 emissions beyond 2020.
Variation of carbon dioxide emissions for global aviation with time.

15.0 CONCLUSIONS
Despite all the measures currently in place and currently proposed, aviation will continue to have an impact upon the global climate and this impact will increase as time passes. By 2050, aviation will be a major source of atmospheric carbon dioxide. This is recognised, and some measures are in place to reduce emissions. This is to be welcomed. However, from a climate perspective, the non-CO2 effects, especially contrail-induced cirrus, are potentially more important than CO2 and these effects are not yet being considered by either regulators or policymakers.
For a given level of technology, the laws of physics alone determine the configuration of a minimum fuel burn aircraft, leaving the designer with little room for manoeuvre. The situation is made more difficult by constraints imposed by the existing airport infrastructure (e.g. runway length and gate size). These may result in aircraft using more fuel than necessary. For safety and other reasons, air traffic services often require aircraft to fly extra distances around departure points, en-route and around arrival points and they may impose non-optimum climb, cruise and descent profiles. Aviation noise restrictions invariably demand measures that lead to additional fuel burn. All these issues must be recognised in the context of aviation and climate change and accounted for in strategies, plans and policies.
Currently, average global fleet fuel efficiency improvement is being achieved largely by the process of progressive fleet renewal. Whilst the manufacturers can still produce aircraft that are significantly more efficient than the ones that are being replaced, this works well. However, for good economic reasons, a complete fleet replacement takes more than 20 years, whilst the cost is more than $1Tn. Therefore, even if the manufacturers could achieve a genuine quantum leap in technology, the attenuating effect of fleet turnover would be such that it could never fully offset the increase in climate impact due to market growth.
This shortfall has been recognised by the ICAO, who are now requiring that the gap be bridged by a global market-based measures scheme. Whilst selling the problem to others may be a useful tool in the short term, it adds cost, uncertainty and risk to airline business plans, and, most importantly, it does not solve the problem in any absolute sense. It could be argued that it is no solution at all.
The simple analysis presented here suggests that, currently, there is close to 100% fuel wastage in the course of airline operations. This does not appear to have been identified as a separate issue and it is only marginally affected by the introduction of new aircraft. Removing this wastage from the air transport system would be a major contribution to reducing the climate impact of global aviation. It could begin immediately and its effect would be immediate.
Until now, the ownership of the problem of climate impact has been largely assumed to lie with the manufacturers. Huge amounts of research money have been invested and are currently being invested to solve the problem by producing more efficient engines and aircraft. However, this assumption needs to be challenged. It has been argued that physics, economics and politics have combined to preclude a complete solution being obtained solely from the manufacturers. A wider, problem ownership needs to be acknowledged and meaningful financial pressures, or policy requirements, need to be applied in order to get results on the necessary time scales. The airlines own a large part of the solution, as do the airports and the air traffic service providers.
However, all these measures only address carbon dioxide emission, which is just one element of the global mean temperature challenge set by the UNFCCC. The reduction of aviation's total climate impact requires the simultaneous lowering of fuel burn and the avoidance of contrails. This problem can only be solved with the engagement and cooperation of the airlines and the air traffic services. The manufacturers’ contribution appears to be small, since demanding minimum CO2 emissions alone will probably mean more contrails, whilst actively preventing contrails by avoiding regions of ice super-saturated air will probably incur a small fuel penalty. Therefore, the overall minimisation of the impact of aviation on climate requires a strategy that balances these two effects. No such strategy exists today, nor apparently is one even being discussed.
In my view, 21st-century civil aviation is definitely not on course. There is over-confidence, since neither technology alone, nor the measures currently in place, can possibly solve the problem of climate impact. There is complacency, because insufficient effort is being directed towards the understanding of the underlying science and because some of the owners of large parts of the solution are not fully accepting, or even acknowledging, their roles. Global aviation is not in a strong position to meet the challenges that it must face if it is to continue to grow and provide support to wealth creation and societal well-being.
Having said this, whilst the problems are undoubtedly very serious, they are not yet insurmountable, but, whilst there are still some grounds for optimism that real solutions can be found, time is not on our side.
ACKNOWLEDGEMENTS
The author gratefully acknowledges the contributions made by the many friends and colleagues, who have helped to clarify his understanding of the issues and the problems, formulate his ideas and refine his arguments. However, the opinions expressed and any mistakes in this text are entirely my own. Special mention goes to John Green, Jeff Jupp and the other members of Greener By Design, as well as Nick Cumpsty, Keith Shine, Ulrich Schumann and Robert Jones.