Introduction
Bangladesh has received an inordinate amount of attention among developing partners and international organizations because of its high rate of child marriage, which has a wide range of physical, socioeconomic, intellectual, psychological and emotional consequences for the lives of young girls (Bruce & Clark, Reference Bruce and Clark2004; Aryal, Reference Aryal2007; Kamal, 2012; Godha et al., Reference Godha, Hotchkiss and Gage2013). It has also received huge attention among researchers, policymakers and human rights advocates within the country. Most earlier research on child marriage in Bangladesh has looked at the causes (Islam & Ahmed, Reference Islam and Ahmed1998; Sarkar, Reference Sarkar2009; Kamal, Reference Kamal2011; Kamal et al., Reference Kamal, Hassan, Alam and Ying2014) or consequences of child marriage (Islam & Mahmud, Reference Islam and Mahmud1996; Kamal & Hassan, Reference Kamal and Hassan2013) or both causes and consequences in some cases (Sarkar, Reference Sarkar2009). In addition, it has focused on assessing the adequacy of government and non-government organization (NGO) interventions to prevent child marriage (UNICEF, 2002; UNFPA, 2012; Plan International, 2013).
These earlier studies suggest that the determinants of child marriage in Bangladesh are multidimensional. Plan International (2013) reported that the causes of child marriage include poverty, low education, lack of security both at home and in the public space, dowry, traditional norms and related social pressure, and parents’ anxiety about protecting their daughter’s chastity until marriage. In addition, HDRC (2011) noticed that a higher incidence of civil conflict and lower levels of development in areas of education, employment and health care facilitates lead to a higher occurrence of child marriage. Similar findings have been confirmed elsewhere (Islam & Ahmed, Reference Islam and Ahmed1998; Kamal, Reference Kamal2011; Kamal et al., Reference Kamal, Hassan, Alam and Ying2014).
As for the consequences of child marriage, Plan International (2013) found that poor health due to early pregnancy, an inability to manage a relationship in the marital home and stopping education were the most common outcomes of child marriage in Bangladesh. Consistent with these findings, the Center for Reproductive Rights (2010) revealed that higher rates of unwanted pregnancy, complications associated with early pregnancy, discrimination and violence, little or no ability to leave abusive partners and a lack of capability to secure legal and social support were major consequences of child marriage. Field (Reference Field2004, p. 1) reported similar findings and argued that ‘these individual outcomes suggest a number of larger social consequences of early marriage, including higher population growth, greater spread of disease, and a higher incidence of orphans.’
Although the causes and consequences of child marriage have received much attention in earlier studies in Bangladesh, regional variation in child marriage in Bangladesh has received little or no attention. The extent to which child marriage varies by regions (in this case, by divisions) in Bangladesh needs to be established in order to ensure that no region with a relatively high rate of child marriage is overlooked in terms of policy interventions. Moreover, examining the regional variations in child marriage will provide better insight into the role of specific determinants of child marriage for a particular region. This would eventually enable policymakers to design regionally based, effective intervention programmes.
The objective of this study was to examine the extent to which the prevalence of child marriage varies by division in Bangladesh. Multivariate logistic regression was carried out using data from the 2011 Bangladesh Demographic and Health Survey. A theoretical framework for possible explanations of regional variations in fertility is presented.
Causes of regional variations in child marriage
Given the multi-dimensional nature of the causes of child marriage, regional variations in child marriage arise for multiple reasons. Firstly, substantial differences in educational levels of young females by division could lead to regional variations in child marriage in Bangladesh. A division with a greater percentage of higher education would have a lower rate of child marriage than one with a lower percentage of higher education. This assumption is consistent with the findings of previous research conducted by ICDDR,B and Plan International (2013). They found that education had a strong negative association with child marriage. For example, 86% of women with no education were married before 18 years of age compared with 26% of the women who had completed secondary or higher education. In connection with this, USAID (2012, p. 12) argued that ‘one of the best ways to enable children to avoid early marriage is to keep them in school…children are less likely to marry early if they are kept in school, emphasizing quality primary schooling, which facilitates the transition to higher levels of schooling.’
Another possible source of regional variation in child marriage is the differential in levels of husband’s education. This presumption is based on the premise that lower educated males are more likely to marry girls aged below 18 than higher educated males. Kamal et al. (Reference Kamal, Hassan, Alam and Ying2014) examined the determinants of child marriage in Bangladesh using Bangladesh Demographic and Health Surveys (BDHS) from 1993 to 2011. They observed that the odds of marrying girls below the age of 18 were 93% lower for higher educated husbands compared with those husbands who had no education. Therefore, if there are significant differences in male education by division then this will eventually lead to substantial variations in child marriage across divisions in Bangladesh.
Secondly, regional variation in child marriage is affected by differences in the rate of employment of young females, since: (1) employed females are likely to have greater control over their decision-making regarding marriage because of their financial independence; and (2) the opportunity cost of marrying early would be too high for young employed females. Here, the term ‘opportunity cost’ refers to the loss (both financial and career opportunity) that young females would incur if they married early. There is evidence in support of these arguments (Amin, Reference Amin2011; ICDDR,B & Plan International, 2013; Kamal et al., Reference Kamal, Hassan, Alam and Ying2014). ICDDR,B and Plan International (2013) found that the rate of child marriage was 57% among employed females and 70% for unemployed females.
Thirdly, regional differences in economic condition of people also facilitate variations in child marriage. A division with better financial conditions would have a lower rate of child marriage than one with a higher rate of poverty. It is well established that poverty is one of the dominant causes of child marriage. In many cases, parents cannot afford educational expenses for their children, which motivates them to arrange earlier marriage for their daughters. In addition, economic pressures related to dowry payments (the younger the bride, the lower the dowry) also work as a contributing factor to child marriage (Plan International, 2013; ICDDR,B & Plan International, 2013).
Fourthly, differences in cultural norms and practices work as determinants of regional variations in child marriage. For example, if the cultural norms and values that encourage child marriage are practised more in a region then the rate of child marriage would be higher in that region compared with those where those norms and values are practised less. An earlier study stated that ‘Traditional gender norms such as the social and cultural values placed on morality, female virginity, and family honour are also influential as child marriage is often perceived as a means of controlling female sexual behaviour and untoward attention towards young females by men’ (ICDDR,B & Plan International, 2013, p. 10). This study also added that there was a cultural perception that girls would become less attractive with increasing age; therefore, it is better to arrange their marriage earlier. Furthermore, differences in the percentage of people by religion can lead to regional variations in child marriage since there are significant differences in the impact of religion on child marriage. Muslims are more likely to practise child marriage than those of other religions (Kamal et al., Reference Kamal, Hassan, Alam and Ying2014).
Finally, regional variations in child marriage could arise for other reasons such as social insecurity, threat and child trafficking, the incidences of which are not equal across the divisions of Bangladesh. Thus, it is reasonable to argue that there would be regional variations in child marriage in Bangladesh. Last but not the least, regional variations in child marriage could arise due to the differential impact of education, employment, income and cultural norms and values on child marriage. To make this clear, here is a hypothetical example. Assume that a one-year increase in female education contributes a 5% decline in child marriage in Dhaka and 3% in Rangpur. If young females in Rangpur receive the same education as similar young females in Dhaka, their rate of child marriage will be still higher than in Dhaka. This effect is known as ‘variation due to slope difference’, and is explained in greater detail in subsequent sections.
Conceptual framework
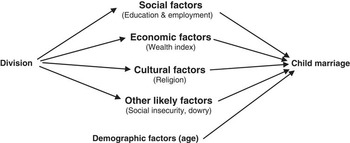
Based on a review of the literature a conceptual model was developed to examine the regional variations in child marriage in Bangladesh (Fig. 1). In the model, ‘division’ is used to indicate region. There are seven divisions in Bangladesh: Barisal, Chittagong, Dhaka, Khulna, Rajshahi, Rangpur and Sylhet. In the framework it is assumed that the effect of division on child marriage is mediated through respondent’s social characteristics (education and employment), economic factors (wealth index), cultural characteristics (religion) and other likely factors such as social insecurity, dowry and parents’ anxiety about, for instance, the chastity of their daughters. The framework also considers husband’s education as a mediating variable. Age was included as a control variable to adjust for the effect of age on the prevalence of child marriage by division. The model assumes that a division that is characterized by lower education, higher unemployment, lower wealth index and a higher percentage of Muslims would have a higher rate of child marriage than a division with higher rates of education, employment, wealth index and other religions. The other likely factors indicate that division would have a significant effect on child marriage even after adjusting for respondent’s age, education, employment status, religion, husband’s education and wealth index. Possible factors include unobserved variables that are not included in the model such as social insecurity, cultural-norm-related social pressure and ensuring a girl’s virginity (Plan International, 2013).
Conceptual framework for examining regional variation in child marriage in Bangladesh.

Data and Methods
Data were from the 2011 BDHS, which includes data from interviews of 17,842 randomly selected, ever-married women aged 12–49 years. After excluding missing values, the final sample size was reduced to 17,808. Since missing values were <5%, a list-wise delete procedure was followed to select the study population assuming that the missing values were completely at random (MCAR). The response rate of the survey was 98%.
Independent variable
The main independent variable was division, i.e. respondent’s place of residence. The 2011 BDHS reports respondent’s division as one of seven divisional categories: Barisal, Chittagong, Dhaka, Khulna, Rajshahi, Rangpur and Sylhet. Sylhet, the division with the lowest percentage of child marriage, was used as the reference category in the analysis.
Dependent variables
The dependent variable of interest was child marriage status. The 2011 BDHS does not directly contain any variable on the status of child marriage. However, the dataset provides information on respondent’s age at first cohabitation. This was used to identify the respondent’s child marriage status categorized as: a) child marriage or b) adult marriage. Those who entered into first cohabitation before age 18 were categorized as having a ‘child marriage’, and those who started their first cohabitation at age 18 or above as an ‘adult marriage’. Thus, adult marriage was used as the reference category in the analysis.
Control variables
To obtain reliable estimates of regional variations in child marriage in Bangladesh control variables were introduced into the multivariate analysis. These included respondent’s age, education, employment status, religion, husband’s education and wealth index. The 2011 BDHS includes respondent’s age in years from 12 to 49. This variable was included in the analysis as a control variable.
The second control variable was respondent’s educational attainment. The 2011 BDHS categorizes this as: 1) none, 2) primary, 3) secondary, and 4) higher. The fourth category of higher education was used as the reference category. Similarly, the dataset also categorizes husband’s education into four categories. The last category of higher education was used as the reference category.
The 2011 BDHS collected information on whether respondents were working at the time of survey. This information was used to create the variable of employment status. Those who were working at the time of the survey are coded as ‘employed’, and those who were not working were coded as ‘not employed’ (reference category).
The 2011 BDHS provides respondent’s socioeconomic status through the measurement of a wealth index. The wealth index was constructed from data on household assets and dwelling characteristics such as television, bicycles, source of drinking water, sanitation facilities and construction materials (see http://www.measuredhs.com/publications/publication-fr265-dhs-final-reports.cfm for a detailed description of the construction of the wealth index). The wealth index had five categories: poorest, poorer, middle, richer and richest (coded as 0, 1, 2, 3 and 4, respectively). This variable was directly included in the analysis as a categorical variable. The last category (richest) was used as the reference category.
Another control variable was respondent’s religion, categorized in the 2011 BDHS as: Islam, Hinduism, Buddhism or Christianity. In this analysis, religion was coded as: a) Islam and b) other (comprised of Hinduism, Buddhism and Christianity). The category ‘other’ was used as the reference category.
Analytical approach
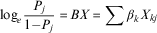
The dependent variable of interest in this study was a dichotomous variable (child marriage status: 1=child marriage; 0=adult marriage). As such, logistic regression estimates were applied to examine the regional variation in child marriage. More specifically, the logistic regression model for examining regional differences takes the following form:
 $${\rm{log}} _{e} {{P_{j} } \over {1{\minus}P_{j} }}\, {\equals}\, BX\, {\equals} \, \mathop{\sum}{\beta _{k} X_{{kj}} } $$
This model expresses the log odds of the outcome variable (child marriage) as a linear function of the exposure variables. Here P j =1 indicates that the respondent had a child marriage, and P i =0 denotes adult marriage; β k is the coefficient for the vectors of predictors of X j : respondent’s division, age, education, employment status, religion, husband’s education and wealth index.
Four models were estimated. The first model is the basic model (division only) and contains no control variables. The second model takes the respondent’s three socio-demographic characteristics into account: age, education and employment status. The third model incorporates the two covariates of husband’s education and wealth index, in addition to the three control variables included in the second model. The fourth model (full model) includes respondent’s religion in addition to all control variables mentioned in the third model. One advantage of including control variables step-by-step is that it allows the extent to which the control variables are contributing to a better model, and the extent to which they contribute to determine the outcome variable of interest, to be assessed (in this case, the prevalence of child marriage).
It should be mentioned that earlier research (e.g. Kamal et al., Reference Kamal, Hassan, Alam and Ying2014) showed that level of child marriage was to some extent determined by whether respondents were living in rural areas or not. Therefore, it was important to include rural–urban residence in the model to obtain unbiased estimates of child marriage. So, initially the respondent’s place of residence (i.e. rural–urban) was included in the model, but the odds ratio for the variable was not statistically significant. Later, this aspect was further examined in detail, and it was noticed that when wealth index was included in the model the rural–urban variable became statistically insignificant. This suggests that the rural–urban variation in child marriage is largely due to their differences in wealth index. So, wealth index was kept in the model and the rural–urban variable was dropped from the analysis.
Results
Sample characteristics
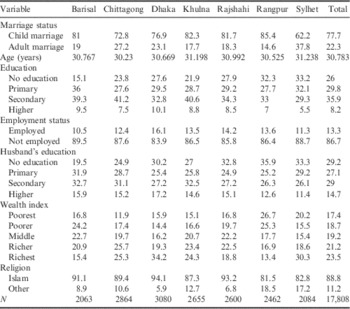
Table 1 shows the sample characteristics of the respondents disaggregated by division. The total sample size was 17,808 women. Among the selected respondents, 77.7% had child marriage and the remaining 22.3% had adult marriage. Rangpur had the highest rate of child marriage (85.4%) followed by Khulna (82.3%), Rajshahi (81.7%), Barisal (81.0%), Dhaka (76.9%), Chittagong (72.8%) and Sylhet (62.2%).
Distribution (%) of respondent characteristics by socio-demographic characteristics and division, 2011 BDHS (N=17,808)Footnote a

a This table includes all respondents: those who were married as children (before age 18) and those who were married as adults (after age 18+).
Sylhet had the highest rate of ‘no education’ (33.2%), while Barisal showed the lowest (15.1%). Dhaka had the highest rate of ‘higher than secondary education’ (10.1%) while Sylhet had the lowest (5.5%). Dhaka had the highest rate of employment (16.1%), followed by Rajshahi (14.2%), Rangpur (13.6%), Khulna (13.5%), Chittagong (12.4%) and Sylhet (11.3%). Husband’s education showed a similar distribution by division, with a few exceptions.
The percentage distribution of the wealth index shows that respondents living in Rangpur division had the highest poverty rate (52.0%; obtained by adding the poor and poorest categories). On the other hand, about one-third of the respondents in Chittagong, Dhaka, Khulna and Rajshahi belonged to this category. Of the total respondents, 88.8% were Muslim and the remaining 11.2% belonged to other religions. The percentage of Muslims was highest in Dhaka (94.1%), followed by Rajshahi (93.2%), Barisal (91.1%), Chittagong (89.4%), Khulna (87.3%), Sylhet (82.8%) and Rangpur (81.5%).
Bivariate analysis
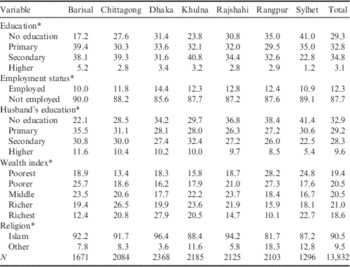
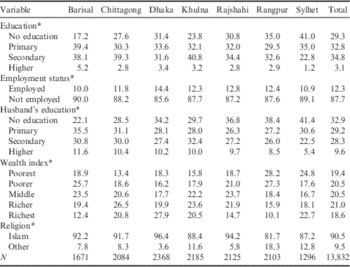
There were marked differences in the effect of respondent’s education on their chances of child marriage by division. Among the respondents who had no education the highest percentage of child marriage was found in Sylhet (41.0%), whereas their counterparts in Barisal had the lowest percentage of child marriage (17.2%) (Table 2). This pattern of differential impact of no education on child marriage was also evident in the three other categories of education (primary, secondary and higher). The differences in the effect of educational attainment on child marriage by division were statistically significant (χ 2=378.303, p<0.001).
Distribution (%) of respondents with a child marriage by socio-demographic characteristics and division, 2011 BDHS (N=13,832)
*p<0.001.
Table 2 also presents the percentage distribution of child marriage by respondent’s employment status and division. Overall, the vast majority of the respondents in all seven divisions were unemployed (87.7%). One obvious pattern was that the percentage of child marriage was much higher in all divisions among those respondents who were not employed compared with those who were employed. In addition, among the unemployed respondents Barisal had the highest rate of child marriage (90.0%) while Dhaka had the lowest (85.6%). These regional variations in child marriage by respondent’s employment status were statistically significant (χ 2=21.558, p<0.001).
The distribution of child marriage by husband’s education and division reveals three distinct patterns of child marriage: 1) lower education was associated with a higher rate of child marriage in all divisions; 2) in some divisions the percentages of child marriage were higher among respondents whose husbands had primary or secondary education compared with those who had no education (e.g. Barisal and Chittagong); and 3) there were divisional variation in child marriage in each category of education. For example, among the respondents whose husbands had no education the percentage of child marriage was 41.4% in Sylhet whereas it was 21.1% for their counterparts in Barisal. These variations in child marriage by husband’s education and division were statistically significant (χ 2=250.799, p<0.001) (Table 2).
Table 2 shows an inverse U-shaped pattern of child marriage in relation to wealth suggesting that the prevalence of child marriage increases with increasing wealth index and then starts to decline for respondents with the highest wealth index. This is particularly true for Barisal, Chittagong, Khulna and Rajshahi. In addition, there were variations in the prevalence of child marriage for each category of wealth index by division. For instance, the prevalence of child marriage for the respondents with highest wealth index was 10.1% in Rangpur whereas it was 22.7% for their counterparts in Sylhet. This regional variation in child marriage by wealth index was statistically significant (χ 2=646.974, p<0.001).
Regarding the distribution of child marriage by respondent’s religion and division, Table 2 shows that 90.5% of respondents were Muslim and the remaining were followers of other religions. Child marriage was highly prevalent among Muslims compared with other religions. However, there were variations in child marriage for each category of religion by division. For example, among those who had child marriage in Dhaka 96.4% were Muslim while this rate was lowest in Rangpur (81.7%). These variations in child marriage by religion and division were statistically significant (χ 2=355.387, p<0.001).
The bivariate analyses show that there were substantial variations in the prevalence of child marriage by division and also across various categories of socio-demographic, economic and cultural factors. An important question that remained to be seen is whether these divisional variations in child marriage remain statistically significant after controlling for the socio-demographic, economic and cultural factors. If so, what kind of policy interventions should be taken for each of the seven divisions by the government and NGOs to prevent child marriage in Bangladesh? These aspects are explored in detail in the subsequent sections of multivariate analysis and decomposition analysis.
Multivariate analysis
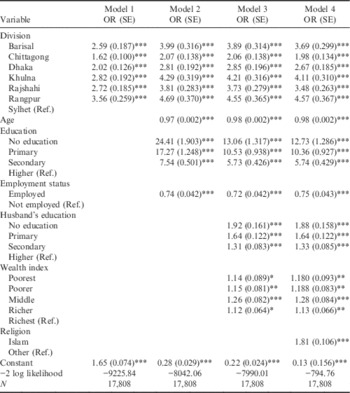
Logistic regression estimates of the regional variations in child marriage are presented in Table 3 in the form of odds ratios. An odds ratio of >1 indicates that the study group had a higher incidence of child marriage than the reference group, and an odds ratio of <1 suggests that the study group had a lower incidence of child marriage than the reference group.
Logistic regression estimates (odds ratios) of the regional variation in child marriage, 2011 BDHSFootnote a

*p<0.05; **p<0.005; ***p<0.01.
a Most of the predictors are significant at 1% level because of the relatively large sample size and inclusion of the most relevant variables in the models.
It should be mentioned that in the regression analysis no multicollinearity was encountered for the variables that were included in the regression models. Model 1 is the basic model and includes only division as a predictor of child marriage. This model shows that all divisions had higher odds of child marriage compared with Sylhet. More specifically, Rangpur had 3.56 times higher odds than Sylhet, followed by Khulna (2.82 times), Rajshahi (2.72 times), Barisal (2.59 times), Dhaka (2.02 times) and Chittagong (1.62 times).
Model 2 includes respondent’s age, education and employment status along with division. The inclusion of these three covariates in the models led to an increase in the odd ratios of child marriage for each of the six divisions in relation to the reference category of Sylhet. For example, Rangpur, Khulna and Barisal showed 4.69, 4.29 and 3.99 times higher odds of child marriage than Sylhet after controlling for respondent’s age, education and employment.
Model 3 includes husband’s education and wealth index along with all predictors of child marriage shown in Model 2. The odd ratios of child marriage for each of the six divisions decreased slightly after including two additional control variables. However, the differences were still much higher in relation to the reference category of Sylhet. For instance, Rangpur, Khulna and Rajshahi had 4.55, 4.21 and 3.73 times, respectively, higher odds of child marriage than Sylhet, even after adjusting for respondent’s age, education, employment status, husband’s education and wealth index.
Model 4 includes respondent’s religion along with all the covariates of Model 3. Rangpur and Khulna had more than four times higher odds of child marriage (4.57 and 4.11 times, respectively) than Sylhet. Barisal and Rajshahi had more than three times higher odds of child marriage (3.69 and 3.48 times, respectively) than the reference category. Chittagong and Dhaka had about two times higher odds of child marriage (1.98 and 2.67 times, respectively) than Sylhet after controlling for the selected socio-demographic, economic and cultural characteristics.
In bivariate analysis there was an inverse U-shaped pattern of child marriage across various categories of education indicating that the respondents with no education had lower odds of child marriage than those who had primary education. However, Model 4 shows that when other factors were taken into account the relationship between education and child marriage became straight inverse, meaning that lower education was associated with higher child marriage. For instance, respondents with no education had 12.73 times higher odds of child marriage than respondents with higher than secondary education. The respondents with primary education had 10.36 times higher odds of child marriage than the reference category. This pattern was also true in the case of husband’s education (Table 3).
As for the impact of employment, employed respondents had 25.0% lower odds of child marriage than unemployed respondents (Model 4). This finding suggests that an increasing rate of employment will certainly contribute to reducing and preventing child marriage in Bangladesh.
Model 4 also shows that the respondents with poorest or poorer wealth index had about 18.0% higher odds of child marriage compared with those with the richest wealth index. In addition, respondents in the middle or richer category of wealth index also had higher odds of child marriage then the reference category of richest wealth index. These findings indicate that the higher the poverty the greater are the odds of child marriage in Bangladesh. Furthermore, Muslims had 81.0% higher odds of child marriage than respondents of other religions (Table 3).
Discussion and Conclusion
This study aimed to investigate the regional variations in child marriage in Bangladesh. This objective was accomplished through the application of multivariate logistic regression using data from the 2011 BDHS. Substantial regional variations in child marriage were found, even after controlling for respondent’s age, education, employment status, husband’s education, wealth index and religion. More specifically, Rangpur had the highest prevalence of child marriage followed by Khulna, Barisal, Rajshahi, Dhaka and Chittagong and Sylhet.
These findings raise the question of why Rangpur division has the highest and Sylhet division the lowest rates of child marriage in Bangladesh. One reason might be that Rangpur division has the highest rate of poverty and consequently higher social insecurity as compared with Sylhet division. On the other hand, Sylhet division has the lowest rate of poverty in Bangladesh. According to the Bangladesh Poverty Map 2010 released in 2014 by the Bangladesh Bureau of Statistics (BBS) the average poverty rate in Rangpur division was 42.0% followed by Barisal with a poverty rate of 38.3%, Khulna 31.9%, Dhaka 30.5%, Rajshahi 27.4%, Chittagong 26.1% and Sylhet 25.1%. It should be mentioned that Rangpur is the only division that is characterized by monga (seasonal food insecurity). A decade ago the percentage of people who were starving was 45.0%, and this has recently declined substantially due to government and NGO economic interventions (Sohel, Reference Sohel2014).
Several districts in Rangpur division are chronic disaster-prone zones where communities are repeatedly affected by river erosion and flooding along the Jamuna River and by cyclones, tidal surges, salt water intrusion and water-logging in the south-west. This susceptibility to natural disasters further aggravates the severity of poverty in the division, making it difficult for poor people to pay dowry – a common practice in Bangladesh – for arranging their daughter’s marriage. It should be mentioned that with increasing age of bride the demand for dowry also increases (Chowdhury, Reference Chowdhury2004; UNFPA, 2012). Moreover, parents also worry about the security of their daughters when staying in flood/disaster shelters. Thus the higher rate of chronic poverty and frequent occurrence of disasters in Rangpur division possibly exert a strong influence on the higher occurrence of child marriage in Rangpur division.
In addition to its low rate of poverty, another characteristic of Sylhet division that should be taken into account in explaining its low prevalence of child marriage is the high proportion of its people migrating abroad compared with other divisions. According to the 2011 Census of Bangladesh, 12.2% of the total migrants from Bangladesh were from Sylhet division whereas only 2.7% were from Rangpur division (Basher, Reference Basher2015). The foreign connections of the people in Sylhet have not only contributed to its low rate of poverty, but have also probably created a greater awareness among girls, parents and the community about the negative consequences of child marriage. Future research should focus on the role of these factors in the occurrence of child marriage.
Respondent’s education, employment status, husband’s education and wealth index were inversely associated with the prevalence of child marriage. These findings are consistent with those of earlier studies (HDRC, 2011; ICDDR,B & Plan International, 2013; Kamal et al., Reference Kamal, Hassan, Alam and Ying2014; Singh & Samara, Reference Singh and Samara1996; USAID, 2012). The study by HDRC (2011) found that education increased girls’ age at marriage because through education they gained confidence and realized their ability to make decisions about marriage and childbearing. Therefore, Bangladesh should take policy initiatives to ensure quality higher education for girls. In addition, adequate employment and self-employment opportunities should be created to ensure smooth transition to labour market participation for girls. The higher participation of girls in the labour market will contribute to improving their economic condition and consequently help prevent child marriage.
It is important to clarify one aspect of the findings derived from logistic regression. The odds ratio of age in multivariate logistic regression suggests that the odds of child marriage decrease with increasing age of the respondents (current age). Therefore, earlier cohorts of women were less likely to have child marriage compared with younger cohorts of women. This could be misleading because earlier research has shown that the prevalence of child marriage was higher among older cohorts compared with young cohorts (Kamal et al., Reference Kamal, Hassan, Alam and Ying2014). Most of the earlier research excluded respondents aged below 20 years in their analysis. However, all women aged 13–49 years were included in the analysis because there were about 2000 women aged below 20 years at the time of survey. Among these women about 90.0% had child marriage. Since the main objective of this study was to examine the prevalence of child marriage it was reasonable to include them in the analysis. Among this younger age group (who were aged below 20 years at the time of survey) the possibility of having adult marriage was very low because of the cut-off point for child marriage (i.e. age 18). For this reason, the odds ratio of age showed an inverse relationship with the prevalence of child marriage. Age was still included in the analysis because the aim was to adjust the age effect in order to obtain unbiased and reliable estimates of the regional variations in child marriage in Bangladesh.
One limitation of this study was that education of the respondent’s parents was not included in the analysis because the 2011 BDHS does not contain information on this variable. In fact, parents are the main decision-makers when arranging marriage for their daughters in Bangladesh. Therefore, parents’ education should be considered as an important determinant of child marriage in Bangladesh. Future research should focus on this. Another limitation of this study is that cross-sectional data were used. As a result, it was not possible to obtain respondents’ socioeconomic status at the time of their marriage. Using longitudinal data for examining regional variation of child marriage would give better insight into the internal and external mechanisms of child marriage and facilitate the uncovering of unobserved factors affecting child marriage. Furthermore, the 2011 BDHS dataset only includes ever-married women, so the present analysis was restricted to these. However, an ideal study should include both married and unmarried women with a view to exploring the factors that are contributing to postponement of marriage (thus, avoiding child marriage).
This study’s findings clearly suggest that in addition to investing in education, employment creation and improvement in income, the government and NGOs should focus on other unrecognized factors to erase differences in child marriage across divisions in Bangladesh. Possible factors might include social insecurity, child trafficking, threats and cultural norms related to social pressure and parents’ awareness about the negative consequences of child marriage (Amin, Reference Amin2008; Plan International, 2013). Another important area for future research is the role of law enforcement agencies, elected representatives of local administrations, marriage registrars and religious leaders in preventing child marriage. Finally, it should be mentioned that within divisions there are probably district-level variations in child marriage.
Acknowledgment
This research was funded by the UNFPA through the Department of Population Sciences, University of Dhaka, Bangladesh.