


Dizygotic twinning (DZT) is an intrinsically interesting trait and an important marker of female fertility. The Twinning Genetics Consortium (TGC) has recently published the largest genomewide association study (GWAS) meta-analysis of DZT to date, with 8265 mothers of spontaneous dizygotic (DZ) twins (MoDZTs) and 264,567 controls, supplemented by 26,252 DZ twins (independent of the MoDZTs and each twin contributing only half the information of an MoDZT) and 417,433 controls (hereafter TGC2024; Mbarek et al., Reference Mbarek, Gordon, Mortlock, Duffy, Beck, Hubers, Hottenga, Pool, Dolan, Actkins, Gerring, Dongen, Ehli, Iacono, McGue, Chasman, Gallagher, Schilit, Morton and Martin2024). All subjects were of European origin. Six significant loci (GNRH1, FSHR, ZFPM1, IPO8, FSHB and SMAD3) were identified in TGC2024, with two additional loci (17p13.1/SHBG and 6p22.1/HLA-G) strongly implicated by functional data.
Spontaneous DZT varies with maternal age; compared to mothers aged 18 years, the DZ twinning rate in mothers aged 35 is approximately four times higher, but it declines rapidly thereafter (Bulmer, Reference Bulmer1970). These age-specific changes likely reflect declining ovarian follicle reserve (Beemsterboer et al., Reference Beemsterboer, Homburg, Gorter, Schats, Hompes and Lambalk2006). On the other hand, twinning is associated with increased risks to maternal and infant health (Monden & Smits, Reference Monden and Smits2017; Santana et al., Reference Santana, Cecatti, Surita, Silveira, Costa, Souza, Mazhar, Jayaratne, Qureshi, Sousa and Vogel2016; Santana et al., Reference Santana, Silveira, Costa, Souza, Surita, Souza, Mazhar, Jayaratne, Qureshi, Sousa, Vogel and Cecatti2018). Thus, it is important to understand genetic mechanisms regulating DZ twinning and their relationship to fertility and reproductive aging.
In the first successful GWAS of DZ twinning, based on a GWAMA of 1980 MoDZT cases and 12,953 controls (Mbarek et al., Reference Mbarek, Steinberg, Nyholt, Gordon, Miller, McRae, Hottenga, Day, Willemsen, de Geus, Davies, Martin, Penninx, Jansen, McAloney, Vink, Kaprio, Plomin and Boomsma2016), we reported two significant loci associated with DZT, viz. FSHB, the structural locus for the follicle-stimulating hormone (FSH) beta subunit, and SMAD3, which regulates the ovarian response to FSH. We replicated these findings in gene-based testing of ‘being a DZ twin’ in the UK Biobank (Mbarek et al., Reference Mbarek, van de Weijer, van der Zee, Ip, Beck, Abdellaoui, Ehli, Davies, Baselmans, Nivard, Bartels, de Geus and Boomsma2019). Later, we expanded the Australian and New Zealand (ANZ) component of that study to 3273 MoDZT plus 24,009 controls of European ancestry (hereafter, ANZ2023; Gordon et al., Reference Gordon, Duffy, Whiteman, Olsen, McAloney, Adsett, Garden, Cross, List-Armitage, Beck, Mbarek, Medland, Montgomery and Martin2023), which associated ZFPM1 (Zinc Finger Protein, FOG Family Member 1) on chromosome 16 and ADRB2 (β2-adrenergic receptor) on chromosome 5, in addition to replicating the previously reported associations with FSHB and SMAD3 (Mbarek et al., Reference Mbarek, Steinberg, Nyholt, Gordon, Miller, McRae, Hottenga, Day, Willemsen, de Geus, Davies, Martin, Penninx, Jansen, McAloney, Vink, Kaprio, Plomin and Boomsma2016).
From 2021−2024, a new program to recruit additional MoDZT in ANZ has resulted in 1665 additional cases (post-QC) with an online survey and DNA collection for genotyping, while simultaneously QSkin2 became available, an extension of QSkin (Olsen et al., Reference Olsen, Green, Neale, Webb, Cicero, Jackman, O’Brien, Perry, Ranieri and Whiteman2012) from which most of the Australian controls for TGC2024 had been drawn. This allowed us to add an additional set of 5317 population-matched controls, genetically unrelated (or only distantly related) to the existing set that we had used previously. Both were genotyped on Illumina GSA v3 genotyping chips (collectively, ANZ2026).
The purpose of this article is to describe the collection of a new sample of MoDZTs in Australia and New Zealand (hereafter, ANZ2026) and to evaluate through meta-analysis its augmentation of power to detect DZT genes above that of ANZ2023 and TGC2024.
Methods
The analysis consists of two case/control GWAS where the cases were MoDZT and ‘controls’ were not known to be cases. Also, cases were surveyed and excluded if the twin pregnancy had involved assisted reproductive technology (ART), and controls were excluded based on close identity-by-descent (IBD) (
 ${\rm{\hat \pi }} \ge 0.1$
) to any cases. No phenotype information was used apart from zygosity of the twins, and ART status.
Australia New Zealand Study
Cases. Recruitment of MoDZTs was by public appeal in both countries, including radio and TV publicity following publication of the TGC2024 paper (Mbarek et al., Reference Mbarek, Gordon, Mortlock, Duffy, Beck, Hubers, Hottenga, Pool, Dolan, Actkins, Gerring, Dongen, Ehli, Iacono, McGue, Chasman, Gallagher, Schilit, Morton and Martin2024), supplemented by social media and appeals via mother-of-twins clubs. Participants were directed to a country-dependent public website controlled by the respective research group (Australia: https://www.qimrb.edu.au/studies/genetics-of-non-identical-twinning https://www.qimrb.edu.au/studies/genetics-of-non-identical-twinning; New Zealand: https://www.otago.ac.nz/gene-structure/research/are-you-the-mother-of-non-identical-dizygotic-twins https://www.otago.ac.nz/gene-structure/research/are-you-the-mother-of-non-identical-dizygotic-twins) with a summary of the study and link for interested volunteers, which proceeded to more detailed information, a consent form, collection of personal and contact details, and a link to the survey itself, as approved during institutional ethics review. The survey consisted of two corresponding questionnaires hosted by the commercial service Qualtrics (one per country) with a unique per-participant link and containing questions about the twins’ zygosity; use or otherwise of ART (and the type and reason for use); current maternal age; maternal age at each confinement (including the twin and other pregnancies), and the history of other twins in the family. Volunteers whose twins satisfied our criteria for dizygosity (opposite sex, or if same-sex then discordance in physical features plus never mistaken for each other by teachers, grandparents) and who had not been conceived using ART, were invited to donate a saliva sample via a kit (Isohelix or ThermoFisher) mailed to them (with buffer solution; printed instructions; and reply-paid envelope) and returned to the lab in their country.
In Australia there was a total of 2464 respondents of whom we judged 2350 to be MoDZT (based on being opposite sex, having had genetic testing, and/or degree of physical similarity). Of the remainder, 358 (15%) of DZ twin pregnancies involved ART and were excluded. In New Zealand we recruited 836 MoDZTs of whom 115 (14%) had used ART and were excluded. DNA was obtained from 533 cases of whom 487 were genotyped successfully (46 fails), and 426 after phenotypic screening, as above.
DNA for all ANZ cases who donated saliva was extracted at the QIMR Berghofer (by SL-A) and samples genotyped at the Australian Translational Genomics Centre in Brisbane (ATGC, by EdeG) using the Illumina Global Screening Array (GSAv3, Illumina model GSAMD-24v3-0-EA_20034606). DNA samples were obtained from 1527 MoDZTs (1502 passing pre-genotyping QC) of whom 1480 were successfully genotyped (22 fails), reducing to 1425 after again applying the ART and zygosity filters described above. Fifteen cases identified from survey data for the QSkin2 control set (see below) were added (after corresponding filtering). After exclusions for non-European ancestry (n = 65) and relatedness (see below) to ANZ2023 (n = 120), 1287 Australian and 393 NZ cases were left for analysis, making a total of 1680 cases for ANZ2026. The relatedness exclusions are still available for future updated datasets.
Further QC. Unexpectedly weak associations were seen in initial versions of the ANZ2026 GWAS. Past experience from the ANZ2023 analysis showed that phenotyping error for even a small fraction of the case group could have a noticeable effect on GWAS power, similar to what we observed in ANZ2026, so we decided that it was prudent to identify and remove any such errors as much as practically possible. To this end we recontacted a substantial fraction of case study participants using email, SMS and/or telephone, to confirm zygosity and ART status, independently of the online questionnaire. Of particular interest were mothers reporting same-sex twins, as their zygosity is not infrequently wrongly reported. This included asking the mothers to describe in their own words how they decided the twins’ zygosity, and to supply photographs of their twins, when they were willing to do so, for review by project staff. The GWAS presented here was run after removing ineligible individuals identified in this way. At the cutoff date, for the Australian sample (the smaller NZ sample had a broadly similar outcome): out of 1196 mothers recontacted, there were 1018 confirmed DZ and no ART use (so still eligible), 53 with probable MZ twins (excluded), 5 used ART (excluded), 37 incomplete responses (DZ but no response regarding ART); and 81 nonresponses even after follow-up. Cases who did not respond to recontact, or for whom there was not a clear result, were retained, as the overall error rate was low, and removing these would have substantially reduced sample size without greatly improving purity of the phenotype. We established in ANZ2023 (Gordon et al., Reference Gordon, Duffy, Whiteman, Olsen, McAloney, Adsett, Garden, Cross, List-Armitage, Beck, Mbarek, Medland, Montgomery and Martin2023) that even an imperfect phenotype is better for power than a perfect phenotype with disproportionately smaller sample size; for example, we expect <1 unidentified ART case among the 81 nonresponders based on the incidence above. Overall, this process across Australia and NZ removed 82 (∼5%) out of an initial 1680 cases at the analysis stage, leaving a final number of 1598. However, the practical effect on the GWAS peaks was quite minor and inconsistent and is barely visible in Manhattan plots. In summary, we see neither overly weak association nor strong false association in ANZ2026 due to poor phenotyping of cases.
Controls. As controls for combined ANZ cases, we used participants in the existing QSkin2 study, a second phase of the QSkin1 study (Olsen et al., Reference Olsen, Green, Neale, Webb, Cicero, Jackman, O’Brien, Perry, Ranieri and Whiteman2012) from which we had drawn controls for ANZ2023. QSkin2 is a randomly selected population-based study of skin health from a later cohort of the same Australian population as QSkin1 and MoDZT cases (Jayasinghe et al., Reference Jayasinghe, Pandeya, Olsen, Martin, Lind, Medland, Gordon, Torres, Lingham, Lee, Nijsten, Kayser, Pardo, Montgomery, Hayward, Palmer, Hunter, Han, Hewitt and Law2025). The existing health survey asks whether participants are twins themselves or have other twins in the family, and about zygosity, and use of ART. This enabled us to identify 15 eligible cases (analogous definition to the main case cohort), which we combined with the ascertained cases, and 5317 controls (no DZ twinning history reported) after exclusions due to ancestry and relatedness to cases and ANZ2023 (same rules as cases). QSkin2 control samples were genotyped on the same GSA v3 model, and at the same facility (ATGC), as the case samples.
Data Cleaning and Imputation
ANZ batches of genotyping were called and QC’d as per standard protocols (within and post GenomeStudio, including dropping individuals with <97% call rate and single nucleotide polymorphisms [SNPs] with GenTrain score < 0.6, minor allele frequency (MAF) < 1%, p (HWE) < 10−6 and call rate < 95%).
A principal components analysis (PCA) for each population was run using smartpca (in EigenSoft 7.2.1; original version described in Price et al., Reference Price, Patterson, Plenge, Weinblatt, Shadick and Reich2006) with samples from 1000 Genomes Phase 3 populations used to define the PC axes; all of our genotyping was projected onto those axes. For the ANZ sample, individuals with PC1 and/or PC2 >6sd from the mean of European reference populations were excluded as ancestry outliers (∼3% for cases, ∼1% for QSkin2 controls).
Observed relatedness was dealt with, depending on the detailed information in registration records, either by (1) dropping duplicates; (2) using SAIGE to accommodate the IBD; or (3) IBD exclusions applied between cases and controls, or between the TGC2024 and ANZ2026 analyses.
In all association analyses, PC1-PC5 were added as covariates, although based on previous experience, there is minimal population stratification after the stated exclusions.
Imputation was run on the Michigan Imputation Server using Eagle (phasing; Loh et al., Reference Loh, Danecek, Palamara, Fuchsberger, Reshef, Finucane, Schoenherr, Forer, McCarthy, Abecasis, Durbin and Price2016), minimac4 (imputation; Das et al., Reference Das, Forer, Schönherr, Sidore, Locke, Kwong, Vrieze, Chew, Levy, McGue, Schlessinger, Stambolian, Loh, Iacono, Swaroop, Scott, Cucca, Kronenberg, Boehnke and Fuchsberger2016) and the HRCr1.1 reference panel, for observed markers passing QC in all relevant batches (N = 474,524 for ANZ). Filtering on MAF ≥ 0.01 and r 2 ≥ .3 left a total of N = 7,970,886 potential analysis SNPs for ANZ2026.
Association Analysis (GWAS)
Although ANZ controls closely related to cases (
 ${\rm{\hat \pi }} \ge 0.1$
) were removed to improve the quality of controls, substantial relatedness was still observed within the case and control groups, which was not unexpected since recruitment for ANZ2026 cases partly relied on recontacting participants in previous family-based studies. Reducing the analysis to an ‘unrelateds only’ analysis would have considerably reduced the sample size and power of the analysis. Hence, the association tests were run using the R package SAIGE (v 0.45) (Zhou et al., Reference Zhou, Nielsen, Fritsche, Dey, Gabrielsen, Wolford, LeFaive, VandeHaar, Gagliano, Gifford, Bastarache, Wei, Denny, Lin, Hveem, Kang, Abecasis and Lee2018), which uses a Generalised Linear Mixed Model (GLMM) to model relatedness as a part of the initial stage of its analysis and also has a high tolerance to unbalanced case/control ratios — as applies here. SAIGE ‘Step 1’ (the null GLMM fit) was run with, as input, the phenotype and covariates plus a genomewide set of observed genotypes for markers available in all batches of genotyping (thinned to 118,630 for ANZ2026). The phenotype was the case/control variable, coded 1 = case (N = 1598), 0 = control (N = 5317). Covariates were the first five genetic principal components (PCs) from the smartpca ancestry PCA run (PC1-PC5). SAIGE ‘Step 2’ was then run in parallel (for speed) across blocks of ∼100,000 markers with as input the Variance Ratio and Generalized Linear Mixed Model Association Tests (GMMAT) model estimate files from ‘Step 1’ plus imputed genotypes (against the HRC r1.1 reference panel, females-only, for the X chromosome) for that block of markers. Step 2 used a MAF cutoff of 0.001 and minimum minor allele count (MAC) of 5. The results for these blocks were then concatenated and filtered based on imputation metadata. For the purposes of results presented here only markers with MAF ≥ 0.01 (1%) and r
2 ≥ .3 were retained. mBAT-combo (Li et al., Reference Li, Liu, Bakshi, Jiang, Chen, Zheng, Sullivan, Visscher, Wray, Yang and Zeng2022) was used to perform gene-based association tests using the supplied 1000 European reference genome for linkage disequilibrium (LD) information.
Results
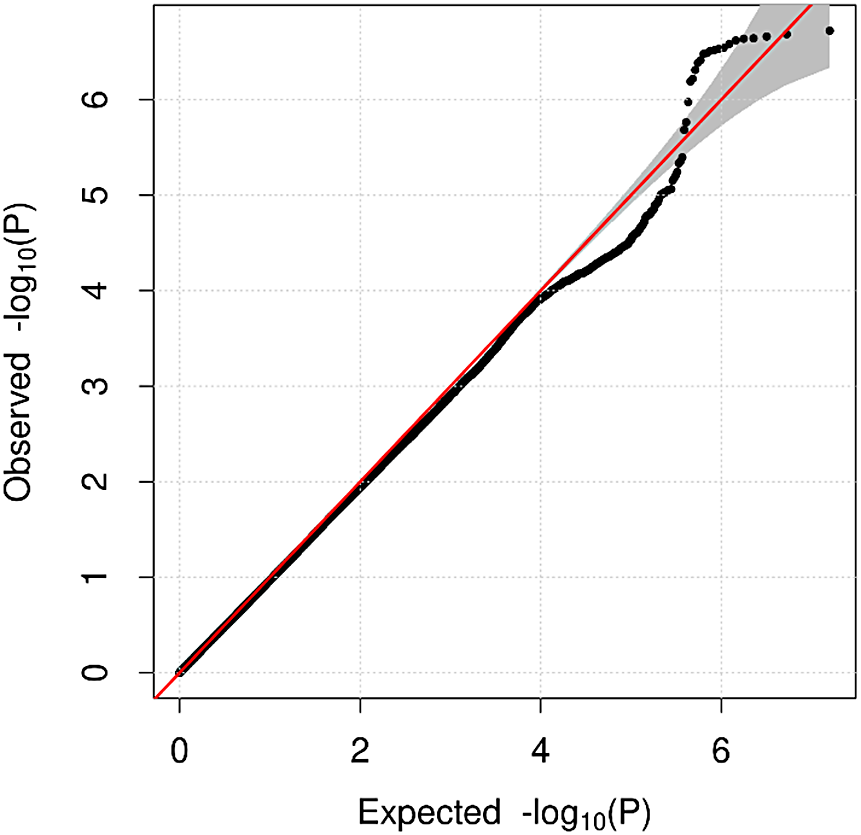
The results of the SAIGE SNP-based GWAS analysis of our new sample (hereafter referred to as ANZ2026) comprising 1598 MoDZT cases and 5317 QSkin2 controls (Figure 1) evince little apparent support for the hits from our ANZ2023 study (Gordon et al., Reference Gordon, Duffy, Whiteman, Olsen, McAloney, Adsett, Garden, Cross, List-Armitage, Beck, Mbarek, Medland, Montgomery and Martin2023) or the TGC2024 study that incorporates ANZ2023 (Mbarek et al., Reference Mbarek, Gordon, Mortlock, Duffy, Beck, Hubers, Hottenga, Pool, Dolan, Actkins, Gerring, Dongen, Ehli, Iacono, McGue, Chasman, Gallagher, Schilit, Morton and Martin2024). The λ = 0.95 for the Q-Q plot being less than 1.0 reflects the sparse association signals (Figure 2). This was despite extensive checking of phenotypic QC steps in both cases and controls. As a further check, we interchanged the control samples between ANZ2023 and ANZ2026 and reran the GWAS, with no obvious changes save those due to relative sample sizes. To further assess whether there was any gain in signal from ANZ2026 for DZT association we undertook a series of meta-analyses.
Manhattan plot for ANZ2026 (1598 MoDZT cases, 5317 controls) shows association p values calculated by SAIGE, as –log10 (p), after removing markers with minor allele frequency (MAF) < 1% or Rsq < .3. Horizontal axis is genomic position in base pairs, increasing toward the right (hg19). The lower and upper horizontal links indicate suggestive (p = 10-5) and genomewide significant (p = 5 x 10⁻⁸) levels respectively.
Note: ANZ 2026, Australian and New Zealand 2026; MoDZT, mothers of spontaneous DZ twins.

Quantile-Quantile (Q-Q) plots for the ANZ2026 case/control GWAS. Plotted after removing single nucleotide polymorphisms (SNPs) with Rsq <.3 or minor allele frequency (MAF) <1%, as per the Manhattan plots. Shows the observed p value (on the vertical axis) as a function of the expected p value (horizontal axis) at that position in the p-value ranking under the null hypothesis (i.e., case/control status is not associated with any marker; the red line). Lambda = 0.9523 (ANZ, 7,970,886 SNPs).
Note: ANZ 2026, Australian and New Zealand 2026.

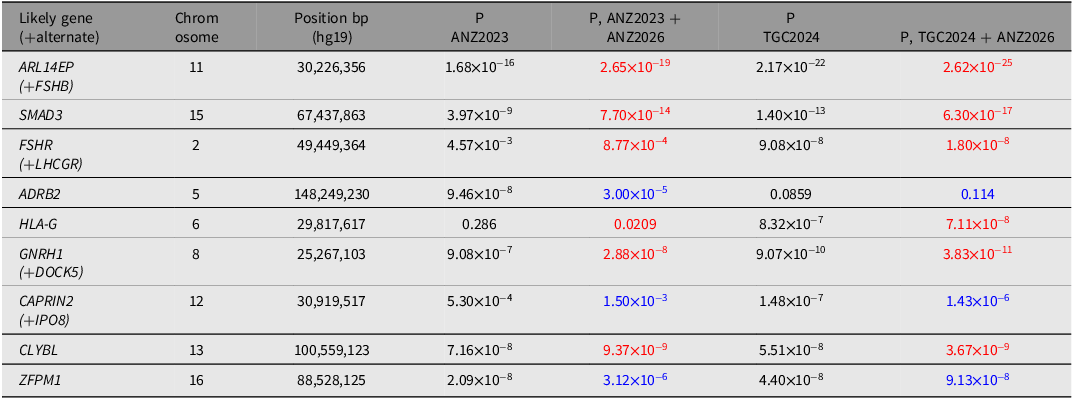
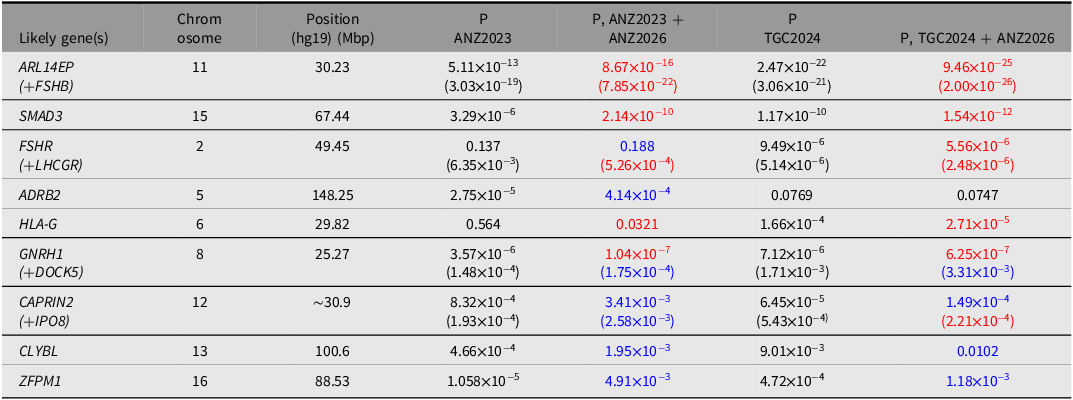
GWAS meta-analysis. GWAMA was performed, after appropriate QC steps, using weighting via the standard error method in Metal (Willer et al., Reference Willer, Li and Abecasis2010). Both SNP-based and gene-based results are presented. Meta-analyses were performed in various combinations to assess different aspects of results: (1) ANZ2026 + ANZ2023, to assess the increment in ANZ information (Figures 3 and 4); (2) ANZ2026 + TGC2024 (which already includes ANZ2023) to assess the increment to the global DZT genetics effort from our new collection (Figures 5 and 6). Results for the SNP-based tests are summarized in Table 1 and results for the gene-based tests, in Table 2. Adding ANZ2026 to ANZ2023 produces small increases in significance for six of nine top regions, including those we have most trust in (FSHB, SMAD3, FSHR, GNRH1). Adding ANZ2026 to TGC2024 produces similar improvements in significance of those four genes but the hit in ZFPM1 slightly decreases in significance, while the hit in IPO8 increases in significance. Another two regions (HLA-G and CLYBL), which have hovered around the significance threshold in our previous work, each slightly increases in significance, with CLYBL now exceeding the genomewide significance threshold. A regional association plot of this chr 13 locus is shown in Figure 7. Gene-based tests in mBAT-combo (Li et al., Reference Li, Liu, Bakshi, Jiang, Chen, Zheng, Sullivan, Visscher, Wray, Yang and Zeng2022) showed somewhat different results after adding ANZ2026 to ANZ2023, but highly similar results after adding ANZ2026 to TGC2024 (Table 2). At a genomewide significance threshold of 0.05/N tests = 2.6 × 10⁻⁶ conventionally used for gene-based tests, improvements in significance (i.e., decreased p value) were seen after adding ANZ2026 to TGC2024, for ARL14EP and adjacent FSHB, and SMAD3. On balance, we are satisfied that ANZ2026 does increase signal for DZT association, though less than we had anticipated.
Manhattan plots for additive model (MoDZT vs control) for ANZ2023 alone (top panel) and ANZ2023 + ANZ2026 meta-analysis (bottom). Shows association p values calculated by SAIGE (as –log10(p)) after removing markers with minor allele frequency (MAF) < 1% or Rsq <.3. The lower and upper horizontal links indicate suggestive (p = 5 x 10⁻⁵) and genomewide significant (p = 5 x 10⁻⁸) levels respectively. Labels match the genes quoted for the adjacent peak in Table 1. Top panel shows the results for ANZ2023 (Gordon et al., Reference Gordon, Duffy, Whiteman, Olsen, McAloney, Adsett, Garden, Cross, List-Armitage, Beck, Mbarek, Medland, Montgomery and Martin2023) before meta-analysis with new sample ANZ2026. Bottom panel shows results after that meta-analysis (ANZ2023 + ANZ2026).
Note: TGC2024, Twinning Genetics Consortium 2024; ANZ 2023, Australian and New Zealand [component] 2023; ANZ2026, Australian and New Zealand 2026.

Figure 3. Long description
Panel A: The top Manhattan plot shows the association p-values for ANZ2023 alone. The x-axis represents chromosomes 1 to X, and the y-axis represents the negative logarithm of the p-values. Key genes such as ADRB2, DOCK5, FSHB, CLYBL, SMAD3, and ZFPM1 are labeled at their respective peaks. Panel B: The bottom Manhattan plot shows the association p-values after combining ANZ2023 and ANZ2026. The x-axis and y-axis are the same as in Panel A. The same key genes are labeled at their respective peaks. Both plots indicate suggestive and genome-wide significant levels with horizontal lines.
Manhattan Plots for gene-based tests in mBAT-combo (chr1-22, Li et al., Reference Li, Liu, Bakshi, Jiang, Chen, Zheng, Sullivan, Visscher, Wray, Yang and Zeng2022) or MAGMA (chr X) (de Leeuw et al., Reference de Leeuw, Mooij, Heskes and Posthuma2015) for ANZ2023 (Gordon et al., Reference Gordon, Duffy, Whiteman, Olsen, McAloney, Adsett, Garden, Cross, List-Armitage, Beck, Mbarek, Medland, Montgomery and Martin2023, top panel) and ANZ2023 + ANZ2026 meta-analysis (bottom panel); showing composite gene-based p value (as –log10 (p)). The horizontal line is at p = 2.56x10⁻⁶; 2.53 x 10-6= 0.05/N = number of tested genes = 19,559; 19,627 (respectively). Labels show the most-associated significant or near-significant gene(s) adjoining the label.
Note: ANZ 2023, Australian and New Zealand [component] 2023; ANZ2026, Australian and New Zealand 2026.

Manhattan plots for additive model (MoDZT vs. control) for TGC2024 (Mbarek et al., Reference Mbarek, Gordon, Mortlock, Duffy, Beck, Hubers, Hottenga, Pool, Dolan, Actkins, Gerring, Dongen, Ehli, Iacono, McGue, Chasman, Gallagher, Schilit, Morton and Martin2024; top panel) and TGC2024 + ANZ2026 meta-analyzed (bottom panel). Shows association p values calculated by SAIGE (-log10 transformed) after removing markers with minor allele frequency (MAF) < 1% or Rsq < 0.3. Genomewide significance threshold p = 5 x 10⁻⁸ is the upper line. Suggestive threshold 10-5 is the lower line. Horizontal axis is genomic position, measured in base pairs, increasing toward the right (hg19). Labels match the genes quoted for the adjacent peak in Table 1. Note that the X-chromosome was not analyzed for TGC2024, so that chromosome is purely ANZ2026.
Note: MoDZT, mothers of spontaneous DZ twins; TGC2024, Twinning Genetics Consortium 2024; ANZ2026, Australian and New Zealand 2026.

Figure 5. Long description
Panel A: A Manhattan plot for the additive model (MoDZT vs. control) for TGC2024. The horizontal axis represents genomic position in base pairs, increasing toward the right (hg19). The vertical axis shows the -log10 transformed p-values. The upper horizontal line indicates the genomewide significance threshold (p = 5 x 10^-8), and the lower line indicates the suggestive threshold (p = 1 x 10^-5). Key genes such as LHCGR, FSHR, HLA-G, DOCK5, FSHB, IPO8, CAPRIN2, CLYBL, SMAD3, and ZFPM1 are labeled at their respective peaks. Panel B: A Manhattan plot for the combined dataset of TGC2024 and ANZ2026. The axes and thresholds are the same as in Panel A. The same key genes are labeled at their respective peaks. The X-chromosome is included in this plot, representing data purely from ANZ2026.
Manhattan plots for gene-based tests in mBAT-combo (chr1-22) or MAGMA (chr X) for TGC2024 and TGC2024 + ANZ2026. The horizontal line is at 0.05/N ≈ 2.66 x 10⁻⁵ and 2.54 x 10⁻⁵ respectively (N = number of tested genes = 19,651; 18,831). Labels show the most-associated significant or near-significant gene(s) adjoining the label. Top panel shows the results for TGC2024 (Mbarek et al., Reference Mbarek, Gordon, Mortlock, Duffy, Beck, Hubers, Hottenga, Pool, Dolan, Actkins, Gerring, Dongen, Ehli, Iacono, McGue, Chasman, Gallagher, Schilit, Morton and Martin2024) before meta-analysis with new sample ANZ2026. Bottom panel shows results after that meta-analysis (TGC2024 + ANZ2026). Note that the X-chromosome is not available in TGC2024 results, so chr X is just from ANZ2026.
Note: TGC2024, Twinning Genetics Consortium 2024; ANZ2026, Australian and New Zealand 2026.

Comparison of top hits — the most associated single nucleotide polymorphism (SNP) in the TGC2024 results except where not associated (ADRB2) in which case the most associated SNP in ANZ2023. Shown for ANZ2023 by itself and TGC2024 (which incorporates ANZ2023) both before and after adding ANZ2026 by meta-analysis

Table 1. Long description
A table comparing genetic associations across different studies. The table has 10 rows and 7 columns. Column headers are Likely gene (alternate), Chrom osome, Position bp (hg19), P, ANZ2023, P, ANZ2023 + ANZ2026, P, TGC2024, and P, TGC2024 + ANZ2026. Row 1: Likely gene (alternate), ARL14EP (+FSHB); Chrom osome, 11; Position bp (hg19), 30,226,356; P, ANZ2023, 1.68x10^-16; P, ANZ2023 + ANZ2026, 2.65x10^-19; P, TGC2024, 2.17x10^-22; P, TGC2024 + ANZ2026, 2.62x10^-25. Row 2: Likely gene (alternate), SMAD3; Chrom osome, 15; Position bp (hg19), 67,437,863; P, ANZ2023, 3.97x10^-9; P, ANZ2023 + ANZ2026, 7.70x10^-14; P, TGC2024, 1.40x10^-13; P, TGC2024 + ANZ2026, 6.30x10^-17. Row 3: Likely gene (alternate), FSHR (+LHCGR); Chrom osome, 2; Position bp (hg19), 49,449,364; P, ANZ2023, 4.57x10^-3; P, ANZ2023 + ANZ2026, 8.77x10^-4; P, TGC2024, 9.08x10^-8; P, TGC2024 + ANZ2026, 1.80x10^-8. Row 4: Likely gene (alternate), ADRB2; Chrom osome, 5; Position bp (hg19), 148,249,230; P, ANZ2023, 9.46x10^-8; P, ANZ2023 + ANZ2026, 3.00x10^-5; P, TGC2024, 0.0859; P, TGC2024 + ANZ2026, 0.114. Row 5: Likely gene (alternate), HLA-G; Chrom osome, 6; Position bp (hg19), 29,817,617; P, ANZ2023, 0.286; P, ANZ2023 + ANZ2026, 0.0209; P, TGC2024, 8.32x10^-7; P, TGC2024 + ANZ2026, 7.11x10^-8. Row 6: Likely gene (alternate), GNRH1 (+DOCK5); Chrom osome, 8; Position bp (hg19), 25,267,103; P, ANZ2023, 9.08x10^-7; P, ANZ2023 + ANZ2026, 2.88x10^-8; P, TGC2024, 9.07x10^-10; P, TGC2024 + ANZ2026, 3.83x10^-11. Row 7: Likely gene (alternate), CAPRIN2 (+IPO8); Chrom osome, 12; Position bp (hg19), 30,919,517; P, ANZ2023, 5.30x10^-4; P, ANZ2023 + ANZ2026, 1.50x10^-3; P, TGC2024, 1.48x10^-7; P, TGC2024 + ANZ2026, 1.43x10^-6. Row 8: Likely gene (alternate), CLYBL; Chrom osome, 13; Position bp (hg19), 100,559,123; P, ANZ2023, 7.16x10^-8; P, ANZ2023 + ANZ2026, 9.37x10^-9; P, TGC2024, 5.51x10^-8; P, TGC2024 + ANZ2026, 3.67x10^-9. Row 9: Likely gene (alternate), ZFPM1; Chrom osome, 16; Position bp (hg19), 88,528,125; P, ANZ2023, 2.09x10^-8; P, ANZ2023 + ANZ2026, 3.12x10^-6; P, TGC2024, 4.40x10^-8; P, TGC2024 + ANZ2026, 9.13x10^-8.
Note: TGC2024, Twinning Genetics Consortium 2024; ANZ 2023, Australian and New Zealand [component] 2023; ANZ2026, Australian and New Zealand 2026; RED, stronger signal (with ANZ2026 added); BLUE, weaker signal.
Comparison of mBAT-combo gene-based p values for ‘top genes’ in the genomewide association study (GWAS) results (the gene-based equivalent of Table 1) plus FSHB, LHCGR, DOCK5, IPO8 (brackets), which sometimes score more highly than the nominal gene, and ADRB2 (not highly associated in TGC2024). Showing ANZ2023 by itself; TGC2024 (which incorporates ANZ2023); and also after adding ANZ2026 by meta-analysis, as indicated

Table 2. Long description
A table comparing p-values for various genes across different datasets in a genomewide association study. The table has 10 rows and 6 columns. The columns are labeled Likely gene(s), Chromosome, Position (hg19) (Mbp), P ANZ2023, P ANZ2023 + ANZ2026, P TGC2024, and P TGC2024 + ANZ2026. The rows list different genes and their corresponding values across the datasets. Row 1: ARL14EP (+FSHB), Chromosome 11, Position 30.23, P ANZ2023 5.11x10^-13 (3.03x10^-19), P ANZ2023 + ANZ2026 8.67x10^-16 (7.85x10^-22), P TGC2024 2.47x10^-22 (3.06x10^-21), P TGC2024 + ANZ2026 9.46x10^-25 (2.00x10^-26). Row 2: SMAD3, Chromosome 15, Position 67.44, P ANZ2023 3.29x10^-6, P ANZ2023 + ANZ2026 2.14x10^-10, P TGC2024 1.17x10^-10, P TGC2024 + ANZ2026 1.54x10^-12. Row 3: FSHR (+LHCGR), Chromosome 2, Position 49.45, P ANZ2023 0.137 (6.35x10^-3), P ANZ2023 + ANZ2026 0.188 (5.26x10^-4), P TGC2024 9.49x10^-6 (5.14x10^-6), P TGC2024 + ANZ2026 5.56x10^-6 (2.48x10^-6). Row 4: ADRB2, Chromosome 5, Position 148.25, P ANZ2023 2.75x10^-5, P ANZ2023 + ANZ2026 4.14x10^-4, P TGC2024 0.0769, P TGC2024 + ANZ2026 0.0747. Row 5: HLA-G, Chromosome 6, Position 29.82, P ANZ2023 0.564, P ANZ2023 + ANZ2026 0.0321, P TGC2024 1.66x10^-4, P TGC2024 + ANZ2026 2.71x10^-5. Row 6: GNRH1 (+DOCK5), Chromosome 8, Position 25.27, P ANZ2023 3.57x10^-6 (1.48x10^-4), P ANZ2023 + ANZ2026 1.04x10^-7 (1.75x10^-4), P TGC2024 7.12x10^-6 (1.71x10^-3), P TGC2024 + ANZ2026 6.25x10^-7 (3.31x10^-3). Row 7: CAPRIN2 (+IPO8), Chromosome 12, Position approximately 30.9, P ANZ2023 8.32x10^-4 (1.93x10^-4), P ANZ2023 + ANZ2026 3.41x10^-3 (2.58x10^-3), P TGC2024 6.45x10^-5 (5.43x10^-4), P TGC2024 + ANZ2026 1.49x10^-4 (2.21x10^-4). Row 8: CLYBL, Chromosome 13, Position 100.6, P ANZ2023 4.66x10^-4, P ANZ2023 + ANZ2026 1.95x10^-3, P TGC2024 9.01x10^-3, P TGC2024 + ANZ2026 0.0102. Row 9: ZFPM1, Chromosome 16, Position 88.53, P ANZ2023 1.058x10^-5, P ANZ2023 + ANZ2026 4.91x10^-3, P TGC2024 4.72x10^-4, P TGC2024 + ANZ2026 1.18x10^-3.
Note: TGC2024, Twinning Genetics Consortium 2024; ANZ 2023, Australian and New Zealand [component] 2023; ANZ2026, Australian and New Zealand 2026; RED, stronger signal (with ANZ2026 added); BLUE, weaker signal.
Regional association plot and gene annotation for CLYBL region on chromosome 13 (from TGC2024 + ANZ2026 meta-analysis). Plot prepared using LocusZoom.js (Boughton et al., Reference Boughton, Welch, Flickinger, VandeHaar, Taliun, Abecasis and Boehnke2021) with LD r 2 estimates derived from 1000 Genomes r3 European genotypes. Grey indicates lack of LD information versus the peak marker.
Note: TGC2024, Twinning Genetics Consortium 2024; ANZ2026, Australian and New Zealand 2026; LD, linkage disequilibrium.

Figure 7. Long description
Panel: A scatter plot displays the relationship between chromosome 13 positions (in megabases) on the horizontal axis and negative logarithm of p-values on the vertical axis. The plot includes hundreds of data points represented by various colored triangles, indicating linkage disequilibrium (LD) values. A prominent peak is visible around the 100.55 megabases position, with a specific marker highlighted. The recombination rate is shown on the right vertical axis in centimorgans per megabase. Below the scatter plot, gene annotations for TM9SF2, CLYBL, ZIC2, ZIC5, and PCCA are displayed with their respective positions.
An underlying assumption of polygenic inheritance is that liability is additive across risk loci, whereas it is possible that there are nonlinear effects such as epigenetic interactions. To probe this, we performed conditional GWAS analyses conditioning on the top two risk variants in FSHB and SMAD3, both singly and together. We hypothesized that there might be subgroups of MoDZT who are wild-type for these loci and whose risk arises from larger effects of the secondary loci such as FSHR or GNRH1. However, we found no obvious perturbations in significance or effect sizes of other loci in the conditional analyses (data not shown). From this we conclude that the additive model is not challenged, at least with the limited power available to us.
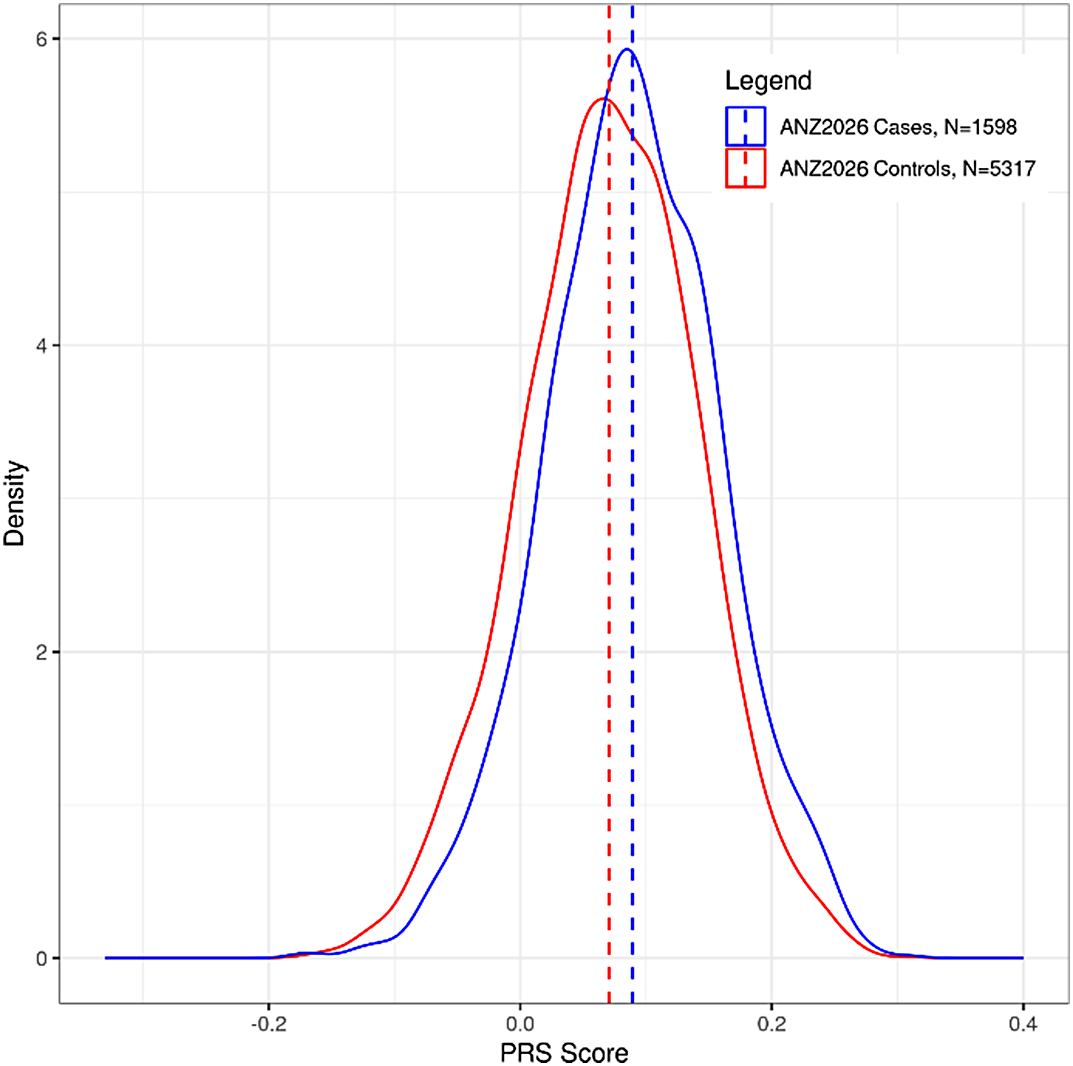
On this basis we proceeded to estimate DZT polygenic risk scores (PRS) in the ANZ2026 sample using weights from the TGC2024 GWAMA, which are entirely independent, and SBayesRC (Zheng et al., Reference Zheng, Liu, Sidorenko, Wang, Lin, Yengo, Turley, Ani, Wang, Nolte, Snieder, Study, Yang, Wray, Goddard, Visscher and Zeng2024), to optimize their combination. Distributions of these PRS are shown in Figure 8. Mean PRS for ANZ2026 MoDZT cases (n = 1598) was 0.0895 with SD 0.0688 and for controls (n = 5317) it was 0.0705 with SD 0.0701 (difference in means 0.0189; t = 9585, p = 2.04 × 10⁻²¹, one-sided).
Predicting dizygotic twinning (DZT) status in ANZ2026 from a polygenic risk score (PRS) based on results of TGC2024, with optimization using SBayesRC (using a European UK Biobank LD reference, as TGC2024 is exclusively European origin). For chromosomes 1−22 only. Scores are unstandardized, shown as blue = cases, red = controls. PRSs for ANZ2026 MoDZT cases (N = 1598) have mean 0.0895, SD 0.0688 and controls (N = 5317) have mean 0.0706, SD 0.0701 (t = 9.585, p = 1.02 x 10⁻²¹, one-sided); a difference in means of 0.0189.
Note: TGC2024, Twinning Genetics Consortium 2024; ANZ2026, Australian and New Zealand 2026; MoDZT, mothers of spontaneous DZ twins; LD, linkage disequilibrium.

Discussion
The most interesting finding of our meta-analysis of ANZ2023 and ANZ2026 is our identification of a novel region, CLYBL on chromosome 13, (genomewide significant SNP p value 3.67 × 10⁻⁹) and confirmation of previously reported key regions associated with DZ twinning — GNRH1, FSHB, FSHR, and SMAD3 — which are involved in the hypothalamic-pituitary-ovarian axis. All of these regions had reached, or were close to, genomewide significance in our previous work.
Despite careful QC of the ANZ2026 sample, ensuring that the mother did not use ART and confirming the DZ zygosity, the increment in GWAS signal at previously established loci was very modest, and in fact some decreased. In particular, ZFPM1 on chr 16, a novel region first identified in ANZ2023 (Gordon et al., Reference Gordon, Duffy, Whiteman, Olsen, McAloney, Adsett, Garden, Cross, List-Armitage, Beck, Mbarek, Medland, Montgomery and Martin2023), fell to a suggestive level of significance in the meta-analysis, although genomewide significance was replicated in TGC2024. The lead SNP on chromosome 16 near ZFPM1 (rs4584807), located in a regulatory region within the first intron of ZFPM1, has been shown to be in high LD with SNPs in regions associated with age at menopause (Mbarek et al., Reference Mbarek, Gordon, Mortlock, Duffy, Beck, Hubers, Hottenga, Pool, Dolan, Actkins, Gerring, Dongen, Ehli, Iacono, McGue, Chasman, Gallagher, Schilit, Morton and Martin2024), sex hormone-binding globulin (Ruth et al., Reference Ruth, Day, Tyrrell, Thompson, Wood, Mahajan, Beaumont, Wittemans, Martin, Busch, Erzurumluoglu, Hollis, O’Mara, McCarthy, Langenberg, Easton, Wareham, Burgess and Perry2020), and FSH concentrations (Chen et al., Reference Chen, Tao, Gao, Zhang, Hu, Mo, Kim, Yang, Tan, Zhang, Qin, Li, Wu, Zhang, Zheng, Xu, Mo, Sun and Sun2013). We are unable to explain why the signal was weaker than expected given the increased sample size and can only attribute this to chance or to an undetected error in QC.
One novel locus, CLYBL (Citramalyl-CoA Lyase) on chromosome 13, exceeded the genomewide significance threshold in the ANZ2026 meta-analysis. We note the following about this gene: it is a mitochondrial enzyme and is strongly co-expressed with and co-evolved specifically with other components of the mitochondrial B12 pathway (Strittmatter et al., Reference Strittmatter, Li, Nakatsuka, Calvo, Grabarek and Mootha2014). Approximately 5% of Europeans harbor a premature stop variant in CLYBL that has been associated with reduced levels of circulating vitamin B12 (rs41281112) (Strittmatter et al., Reference Strittmatter, Li, Nakatsuka, Calvo, Grabarek and Mootha2014 ). However, this SNP is 41 kb away from our top TGC2024 SNP (rs2038695) and in low LD with it, which may imply distinct functional effects. GWAS shows a link between the gene and circulating vitamin B12 levels (Lin et al., Reference Lin, Lu, Gao, Tao, Yang, Feng, Tan, Zhang, Hu, Qin, Kim, Peng, Li, Mo, Zhang, Trent, Mo, Zheng and Sun2012). A Scandinavian exome sequencing study confirmed CLYBL variants are associated with circulating vitamin B12 levels (Grarup et al., Reference Grarup, Sulem, Sandholt, Thorleifsson, Ahluwalia, Steinthorsdottir, Bjarnason, Gudbjartsson, Magnusson, Sparsø, Albrechtsen, Kong, Masson, Tian, Cao, Nie, Kristiansen, Husemoen, Thuesen and Pedersen2013). Nearby SNPs have also been associated with age at menarche, age at menopause, and reproductive aging in large-scale GWAS (Ruth et al., Reference Ruth, Day, Hussain, Martínez-Marchal, Aiken, Azad, Thompson, Knoblochova, Abe, Tarry-Adkins, Gonzalez, Fontanillas, Claringbould, Bakker, Sulem, Walters, Terao, Turon, Horikoshi and Perry2021).
Preconception vitamin B12 levels have been linked to favorable reproductive outcomes in both natural pregnancies and those achieved through ART (Gaskins, Reference Gaskins2015). For women, it impacts ovulation, egg development, and implantation and deficiencies can contribute to infertility and pregnancy complications (Gaskins & Chavarro, Reference Gaskins and Chavarro2018). Prolonged vitamin B12 deficiency has also been suggested to impair fertility by altering ovulation (Bennett, Reference Bennett2001). Taken together, these findings indicate that CLYBL may influence DZ twinning through regulation of vitamin B12 metabolism in females and is likely to be successfully replicated in future GWAS. The TGC2024 top SNP (rs2038695 or 13:100559123, hg19) has itself been found associated with Serum Total, Free and/or Bioavailable Testosterone levels in white British males (but not in females-only GWAS) in the UK Biobank (p ∼ 4.7 × 10⁻¹⁴ and 4.3 × 10⁻¹⁶, Tables S1 and S7 in Leinonen et al., Reference Leinonen, Mars, Lehtonen, Ahola-Olli, Ruotsalainen, Lehtimäki, Kähönen, Raitakari, Piltonen, Daly, Tuomi, Ripatti, Pirinen and Tukiainen2023; also Tables S5, S6, S8, S9 in Ruth et al., Reference Ruth, Day, Tyrrell, Thompson, Wood, Mahajan, Beaumont, Wittemans, Martin, Busch, Erzurumluoglu, Hollis, O’Mara, McCarthy, Langenberg, Easton, Wareham, Burgess and Perry2020), which is of obvious reproductive relevance, although the interpretation here for a female-specific trait is unclear given the lack of strong association in females.
Acknowledgments
We thank the Australian Multiple Birth Association (AMBA) in Australia, and NZMBA, Allison Miller, Joy Brown and Carolyn Lister in NZ for support with sample collection and related processes. We thank Prof David Whiteman and A.Prof Catherine Olsen for access to the genotyping and survey data for participants in their QSkin and QSkin-II studies, who were used as controls for ANZ2023 and ANZ2026 respectively.
Financial support
Supported by Australian National Health and Medical Research Council (NHMRC; ROR identifier https://ror.org/011kf5r70) Investigator Grants to NGM. GWM is supported by grants from the NHMRC (GNT1177194) and the Novo Nordisk Foundation (NNF24OC0090764). The QSkin Study and QSkin2 Study are supported by Grants (APP1185416; APP1063061) from the NHMRC.
Competing interests
None
Ethical standard
The authors assert that all procedures contributing to this work comply with the ethical standards of the relevant national and institutional committees on human experimentation and with the Helsinki Declaration of 1975, as revised in 2008. All studies were approved by the QIMR Berghofer Human Research Ethics Committee (approval P3693, as well as P2034 for QSkin Genetics and P3434 for QSkin2), and additionally (New Zealand study) the Central Health and Disability Ethics Committee, NZ Ministry of Health (approval 2022EXP12825).