Implications
In the context of the European ban on surgical castration without anaesthesia or analgesia by 2018, raising entire male pigs is a viable solution. The main drawback of this approach is boar taint, especially androstenone, an unpleasant smell emitted during cooking. Androstenone production increases during pubertal development. Health via the inflammatory status may affect the sexual maturity of boars. The present data suggest that a mild inflammatory status has no influence on pubertal development and hence on fat androstenone but is associated with moderate health problems and lower growth rate.
Introduction
Boar taint of pork products is the major issue to be addressed before converting the production of castrate males in entire male pigs. It is mainly due to the presence of two odorant molecules: androstenone (or 5α-androst-16-en-3-one) (Patterson, Reference Patterson1968) and skatole (3-methylindole) (Vold, 1970 cited in Walstra, Reference Walstra1974). Genetic and nutritional effects on boar taint have been well studied. Skatole is produced by bacteria in the large intestine and can be easily altered by the diet (Wesoly and Weiler, Reference Wesoly and Weiler2012). Androstenone is produced in the testes by the Leydig cells whose activity is under the control of the pituitary hormone LH itself under the control of the hypothalamic gonadotropin-releasing hormone (Zamaratskaia and Squires, Reference Zamaratskaia and Squires2009). Concentration of fat androstenone is highly heritable and the percentage of tainted carcasses can vary from 5% to 50% depending on the breed (Zamaratskaia and Squires, Reference Zamaratskaia and Squires2009). However, other factors such as inflammation caused by diseases could also play a role. For example, cytokines produced during inflammation decrease the synthesis of steroids by acting on the hypothalamo-pituitary-testicular axis (Diemer et al., Reference Diemer, Hales and Weidner2003). In addition, digestive disorders seem to favour the production of skatole in the intestine (Skrlep et al., Reference Skrlep, Batorek, Bonneau, Fazarinc, Segula and Candek-Potokar2012).
It has been shown in pigs that applying degraded environmental hygiene conditions at weaning (Le Floc’h et al., Reference Le Floc’h, Deblanc, Cariolet, Gautier-Bouchardon, Merlot and Simon2006) or in early fattening around 2 months of age (Le Floc’h et al., Reference Le Floc’h, Knudsen, Gidenne, Montagne, Merlot and Zemb2014b) induces a moderate inflammatory state. This health challenge is less invasive and drastic than an lipopolysaccharide injection and is more representative of what could happen in commercial farms.
Plasma concentration of acute phase proteins (Heegaard et al., Reference Heegaard, Klausen, Nielsen, González-Ramón, Piñeiro, Lampreave and Alava1998) and blood formula (Le Floc’h et al., Reference Le Floc’h, Knudsen, Gidenne, Montagne, Merlot and Zemb2014b) are good indicators of the inflammatory status of pigs. Cortisol concentration can also be an indirect indicator in relation to its anti-inflammatory properties (Chrousos, Reference Chrousos1995). Rectal temperature can also be used as it usually rises when the immune system is stimulated. Lung lesions, deviation of the nasal wall, atrophy of the nasal turbinates as well as stomach ulcers can be added as they are witnesses of previous health problems with inflammatory components.
The purpose of the present study was to test the hypothesis that a moderate inflammatory state inhibits testicular activity of growing boars and hence reduces boar taint. To achieve this aim, we applied contrasted hygiene measures to induce variability in the inflammatory status of pigs and simultaneously measured parameters of the inflammatory and health status and of the pubertal development.
Material and methods
The experiment was conducted according to the French guidelines for animal care and use (http://ethique.ipbs.fr/sdv/charteexpeanimale.pdf; accessed 15 January 2011). Furthermore, the complete experimental procedure was evaluated (#2015061711416632) and approved by the local ethic committee (C2EA–07).
Animals and management
A total of 115 boars were studied at the experimental farm of INRA (35590 Saint-Gilles, France). The experiment was conducted in two identical replicates from September to March for the first replicate (replicate 1: n=56) and from December to June for the second replicate (replicate 2: n=59). Piglets were weaned at 29.0±0.9 days (mean±SD). During the weaning period, they were housed in a single room on a slatted floor. Each pen (2.5×1.8 m) contained eight to 10 pigs originating from one or two distinct litters. Pigs were moved at 69 days of age to a fattening building where they were housed in a single room on a solid concrete floor. Each pen (1×2 m) contained two pigs originating from the same weaning pen. At 104 days of age, the two boars from each pen were separated but all remained in the same room. At 139 days of age (referred to hereafter as Day 0) and 81.3±0.6 kg of live weight, boars were allocated to two distinct rooms with contrasted hygiene conditions until slaughter. The numbers of days that will be mentioned all along the paper were counted from Day 0. Both rooms were identical to the previous one and boars were allocated individually. Allocation was balanced for live weight and litter origin. The room with poor hygiene conditions (n=24 for replicate 1 and 30 for replicate 2) was previously soiled by other pigs, and weakly ventilated. Faeces and urine were not removed and the room was not cleaned during the experimental period. The room with good hygiene conditions (n=32 for replicate 1 and 29 for replicate 2) was cleaned and disinfected before entry of the experimental pigs, cleaned every day, and correctly ventilated. Staff was required to wear specifically allocated, clean clothing and footwear when entering the Good room. Moreover, experimental pigs in the Good hygiene conditions were only housed with pigs from the present experiment whereas non-experimental pigs from other batches were added in the Poor hygiene conditions so that the total number of pigs for the same space was doubled. These contrasting conditions of hygiene were similar to those described by Le Floc’h et al. (Reference Le Floc’h, Knudsen, Gidenne, Montagne, Merlot and Zemb2014b). They led to different levels of NH3 (on Day 23: 8.1±1.1 and 12.9±1.4 ppm, in the Good and the Poor conditions, respectively) that exceeded the recommended threshold for the health of pigs in the Poor room (Donham et al., Reference Donham, Thorne, Breuer, Powers, Marquez and Reynolds2002); and H2S (on Day 23: 0.0±0.0 and 2.2±0.8 ppm, in the Good and the Poor conditions, respectively).
Animals were fed with pellets of standard composition (15.3% of total nitrogenous matter, 3019 Kcal of metabolized energy per kilogram of pellets and 9.5 g of lysine per kilogram of pellets). They had permanent access to water. They did not receive any antibiotics throughout their life.
In order to limit variability in live weight at slaughter, boars were slaughtered in three different batches for each replicate. Slaughter occurred on days 29, 35 or 42, starting with the heaviest boars. On average, pigs were 172.9±4.8 days of age and 116.7±4.5 kg of live weight. Several measures (see below) were taken on Day 27 (167 days of age and 110.5±6.5 kg of live weight), before the first departure to slaughterhouse.
Measures and sample collection on live animals
Pigs were weighed at birth, at weaning, on Day 0, on Day 27 and before departure to the slaughterhouse. Thereafter, average daily gain (ADG) was calculated. On Day −1 and on Day 28, back fat thickness was measured using an ultrasound scanner (ImaGo 90-1945) on both sides of the pigs (6.5 cm from the vertebral column) at the level of the last rib. Thereafter, the mean was calculated and used for statistical analyses.
Blood was collected in tubes containing EDTA (10 ml) and heparin (10 ml) on Day 0 and Day 27 from the external jugular vein, between 0930 and 1100 h, in the home pen. The sampling procedure took <2 min to limit the impact of stress response on blood parameters. Total numbers of lymphocytes and granulocytes were counted in the EDTA blood samples with a haematology automatic cell counter calibrated for pigs (MS-9; Melet Schloesing Laboratories, Osny, France). Thereafter, the blood samples were centrifuged at 2500×g for 10 min at +4°C, and the plasma was stored at –20°C until analysis. Haptoglobin concentrations were determined in the heparinized plasma samples using a colorimetric method with an assay kit based on binding of haptoglobin to haemoglobin (Tridelta Ltd, Maynooth Co., Kildare, Ireland) which was developed for an automated analyser (Konelab 20; Thermo Electron Corporation, Cergy Pontoise, France). Plasma C-reative protein (CRP) concentrations were measured in the heparinized samples using an ELISA kit developed for pig plasma (Genway Biotech, San Diego, CA, USA). Testosterone and oestradiol concentrations were measured in the heparinized plasma samples using ELISA kits (ST AIA-Pack Testosterone, ST AIA-Pack hsE2; Tosoh Corporation, Tokyo, Japan) developed for an automatic analyser (AIA 1800; Tosoh Corporation). The detection limits were 6.3 ng/ml, 0.28 ng/ml, 7 pg/ml and 0.005 mg/ml, for CRP, testosterone, plasma 17β-oestradiol and haptoglobin, respectively. For testosterone, inter-assay CVs were 6.0% and 2.5% at 0.09 and 1.45 ng/ml, respectively, and intra-assay CVs were 5.3% and 1.8% at 0.05 and 1.50 ng/ml, respectively. For 17β-oestradiol, inter-assay CVs were 4.5% and 3.4%, and intra-assay CVs were 3.2% and 1.4% at 67 and 764 pg/ml, respectively. For CRP, inter-assay CV was 5.3% at 5.3 μg/ml, and intra-assay CV was 11.2% at 56 μg/ml. For haptoglobin, intra-assay CVs were 5.3% and 6.3% at 0.6 and 1.3 mg/ml, respectively; and inter-assay CVs were 5.7% and 4.1% at 0.6 and 6.3 mg/ml, respectively.
Before blood sampling, saliva was collected for cortisol determination with Salivette® on Day 0, Day 27 and at slaughter. Cortisol was measured using an ELISA human kit (IBL International, Hamburg, DE, USA). The detection limit was 0.03 ng/ml. Intra-assay CVs were 4.5% and 1.9% at 0.11 and 26 ng/ml; and inter-assay CVs were 4.3% and 3.6% at 0.26 and 27 ng/ml, respectively.
On Day 27, a biopsy of fat was collected from the neck to measure androstenone using the material and methodology described by Baes et al. (Reference Baes, Mattei, Luther, Ampuero, Sidler, Bee, Spring and Hofer2013). A piece of back fat was also sampled from the carcass immediately after slaughter. For samples collected at slaughter, androstenone was measured by HPLC as previously described in Batorek et al. (Reference Batorek, Škrlep, Prunier, Louveau, Noblet, Bonneau and Čandek-Potokar2012). For biopsy samples, a micro-method based on Batorek et al. (Reference Batorek, Škrlep, Prunier, Louveau, Noblet, Bonneau and Čandek-Potokar2012) and Baes et al. (Reference Baes, Mattei, Luther, Ampuero, Sidler, Bee, Spring and Hofer2013) was developed. Correlation between the concentrations of androstenone measured with the ‘standard’ and the micro-method was high (r=0.95). The detection limit of both methods was 0.24 µg/g. Concentration of androstenone was expressed per gram of lipid fat.
Rectal temperature was measured on Day 0, Day 27 and at slaughter. Pigs were previously habituated to this procedure.
Measures and samples at slaughter
Shortly after slaughter, the lean meat percentage (LMP) and the thickness of subcutaneous fat (G2) were measured on carcasses and testes, and Cowper glands were weighed after trimming the surrounding tissues. Lung lesions, rhinitis and stomach ulcers were scored as described by Merlot et al. (2013) with a scale ranging from 0 (no lesion) to 28 (total pulmonary consolidation) for the lungs; 0 (no lesion) to 18 (total atrophy and severe deviation) for the snout; and 0 (smooth and normal mucous membrane) to 7 (wounded ulcer) for the stomach.
Statistical analyses
Statistical analyses were performed with the R software (R Core Team, 2015). Detection limits of the assays were assigned to pigs with levels below those limits. The experimental unit was the individual animal. The rectal temperature, the number of granulocytes, concentrations of CRP, haptoglobin, cortisol, testosterone and 17β-oestradiol as well as the weight of both Cowper glands and the ratio between the weight of both Cowper glands and live weight at slaughter were normalized by logarithmic transformation. The live weight at various ages, ADG, the back fat thickness, the number of lymphocytes, the weight of both testes as well as the ratio between the weight of both testes and the live weight at slaughter were normally distributed without any transformation. Androstenone concentration and scores of lesions could not be normalized.
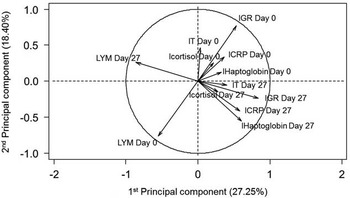
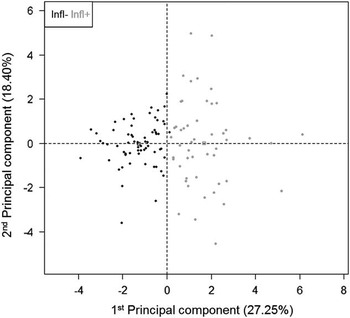
A principal component analysis (PCA) including inflammatory indicators (numbers of granulocytes and lymphocytes, rectal temperature, CRP and haptoglobin in plasma, and salivary cortisol measured on Day 0 and Day 27, all previously transformed for normality) followed by a clustering procedure was performed to identify groups of pigs with different inflammatory status. First, three missing values in health parameters (two for CRP Day 27 and one for haptoglobin Day 27) were imputed with a PCA (10 first dimensions kept for the imputation) with the function imputePCA of the R package missMDA (Josse and Husson, Reference Josse and Husson2016). Thereafter, the functions PCA and hierarchical clustering on principal components (HCPC) of the R package FactoMineR (Le et al., Reference Le, Josse and Husson2008) were successively used. For HCPC, five dimensions were kept (eigenvalue >1) and two clusters were selected after considering the overall shape of the tree and the bar plot of the gain in inertia (Le et al., Reference Le, Josse and Husson2008). Clusters were well linked to the first dimension of the PCA (0.65) and were mainly determined by the plasma concentration of haptoglobin and the numbers of lymphocytes and granulocytes on Day 27 (Figures 1 and 2). Pigs from Cluster 1 will be (hereafter) considered as having a low inflammatory status (Infl−) and those from Cluster 2 as having a moderate inflammatory status (Infl+).
Results of the principal component analysis (n=115) representing relationships between the inflammatory indicators (numbers of granulocytes and lymphocytes, rectal temperature, C-reative protein (CRP) and haptoglobin in plasma, and salivary cortisol measured on Day 0 and Day 27, previously log-transformed for normality if needed). The biplot of the first two principal components jointly represent 45.29% of the total variation. lCRP=log(concentration of CRP in plasma+1); lHaptoglobin=log(concentration of haptoglobin in plasma+1); lCortisol=log(concentration of free cortisol in saliva); lT=log(rectal temperature); lGR=log(number of granulocytes in fresh blood); LYM=number of lymphocytes in fresh blood; Day 0=first day of the treatment of hygiene conditions; Day 27=27 days after the beginning of the treatment.

Repartition of the boars on the first two principal components of the principal component analysis performed on inflammatory indicators (cf. Figure 1). Each dot represents an individual pig. Clusters determined by a hierarchical analysis are indicated by two different colours (Infl−: pigs with a low inflammatory status in black v. Infl+: pigs with a moderate inflammatory status in grey).

To determine the effect of the hygiene conditions and replicate on the health and inflammatory status of pigs, Fisher’s pairwise comparisons were performed on the numbers of animal per category. Comparison between clusters, for normal/normalized variables measured only once, was performed with the function lm of the R software. A covariate analysis with live weight on Day 0 was also performed for live weight and age at slaughter, ADG, back fat thickness, LMP and G2. Comparison between clusters, for normal/normalized variables with repeated measures, was performed with the function lmer from the R package lme4 (Bates et al., Reference Bates, Maechler, Bolker and Walker2015), with the animal being included as a random effect. The time (Day 0, Day 27, Day at slaughter) and the interaction between cluster and time were tested and removed when P>0.05. The lsmeans function from the R package lsmeans (Lenth, Reference Lenth2016) was used to perform pairwise comparisons with the Scheffe’s test when the interaction was significant. For variables that could not be normalized (androstenone and organ lesion scores), the non-parametric Kruskal–Wallis test was performed.
Results
Influence of the hygiene conditions on health
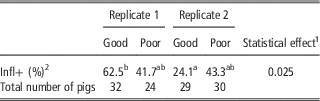
In both replicates, the percentage of male pigs belonging to each cluster did not differ significantly between hygiene conditions (Table 1). There was a significant replicate effect in the Good housing conditions (P<0.05) but no difference between replicates in the Poor housing conditions showing more variations in the Good than in the Poor conditions.
Influence of the replicate (Replicate 1: pigs raised from September to March, Replicate 2: pigs raised from December to June) and the hygiene conditions (Good v. Poor) on the percentage of pigs classified as having a low inflammatory status (Infl−), or being classified as having a moderate inflammatory status (Infl+).

1 Fisher’s pairwise comparisons were performed to compare groups of pigs.
2 Percentages followed by different letters differ at P<0.05.
Growth and health measures
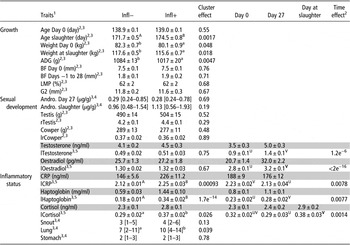
Pigs from the Infl− group were heavier on Day 0, had a higher ADG between Day 0 and slaughter and were younger but heavier at slaughter (Table 2, P<0.05). When the live weight on Day 0 was included as a covariate to test the cluster effect on daily gain, weight and age at slaughter, the differences remained significant with higher performance and age in Infl− pigs (P<0.05), but it was no longer significant for weight at slaughter. No difference was observed, with or without the live weight on Day 0 as a covariate, regarding the back fat thickness in live animals or in carcasses, or in the variation in back fat between Day −1 and Day 28 or the percentage of lean meat (Table 2).
Effect of the inflammatory status (Infl−: pigs with a low inflammatory status v. Infl+: pigs with a moderate inflammatory status) and of the day from the start of the experiment for repeated measures (Day 0: pigs are 139 days of age, Day 27: pigs are 167 days of age) on growth indicators, sexual development and inflammatory status (112<n<115)

Values in grey were not used for statistical analyses (not normally distributed) but are given for information.
1 Traits: weight Day 0=live weight when starting the treatment (kg); ADG=average daily gain from the start of treatment and slaughter (g); BF=back fat thickness (mm); LMP=lean meat percentage; G2=thickness of subcutaneous fat with the rind included (mm); Andro.=concentration of androsténone in fat (µg/g of liquid fat); rTestis=weight of both teste (g)/live weight at slaughter (kg); Cowper=weight of both Cowper gland (g); lrCowper=log(weight of both Cowper gland (g)/live weight at slaughter (kg)); lOestradiol=log(concentration of 17β-oestradiol in plasma); CRP=concentration of C-reactive protein in plasma (ng/ml); lCRP=log(CRP+1); lHaptoglobin=log(concentration of haptoglobin in plasma+1); Cortisol=concentration of free cortisol in saliva (ng/ml); lCortisol=log(Cortisol); Snout=score from 0 (no lesion) to 18 (total atrophy and severe deviation); Lung=score from 0 (no lesion) to 28 (total pulmonary consolidation); Stomach=score from (smooth and normal mucous membrane) to 7 (wounded ulcer) for the stomach; Day 0=first day of the treatment of hygiene conditions; Day 27=27 days after the beginning of the treatment; Day at slaughter=the morning before the departure to slaughterhouse; Days −1 to 28=Delta between Day 28 and Day −1.
2 Statistical linear model formula: Trait~Cluster; values are means±SEM.
3 Means or medians followed by a different letter differ at P<0.05 (lowercase) or at P<0.01 (uppercase).
4 Non-parametric model (Kruskal–Wallis); values are medians followed by the 1st and 3rd quartiles between brackets.
5 Statistical model formula: Trait~Cluster+Time, the interaction between Cluster and time was never significant (P>0.05), values are means±SEM.
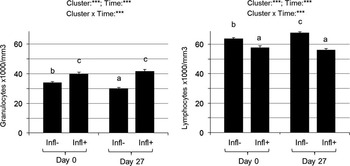
Pigs from the Infl− cluster had a lower number of granulocytes and a higher number of lymphocytes than those from the Infl+ cluster at both stages (Figure 3, P<0.001). In Infl− pigs, the number of granulocytes decreased whereas the number of lymphocytes increased between Day 0 and Day 27 (P<0.05, Figure 3). In Infl+ pigs no significant variation was observed.
Numbers of granulocytes (on the left) and lymphocytes (on the right) in blood of boars according to their inflammatory status (Infl−: pigs with a low inflammatory status v. Infl+: pigs with a moderate inflammatory status) at two distinct periods (Day 0 v. Day 27 of the experiment). Day 0=first day of the treatment of hygiene conditions; Day 27=27 days after the beginning of the treatment. Level of significance: ***corresponds to P<0.001. Different superscript letters indicate a significant difference at P<0.01 between groups.

Plasma CRP and haptoglobin, and salivary cortisol were significantly lower in the Infl− than in the Infl+ cluster (P<0.01) (Table 2). Variation with the stage of sampling was also significant: plasma haptoglobin increased whereas plasma CRP and salivary cortisol decreased between Day 0 and Day 27 (Table 2).
Pigs from the Infl− cluster had lower lung (P<0.05) and snout scores at slaughter (Table 2) but the difference between clusters did not reach significance for the latter measure (P=0.10).
Sexual development measures
The time×cluster interaction was not significant for plasma testosterone and oestradiol. The inflammatory status had no significant effect on plasma testosterone and oestradiol concentrations (P>0.1), but these concentrations increased significantly between Day 0 and Day 27 (Table 2). Fat androstenone did not vary between clusters at either stage of measure (P>0.1). Neither the weight of testes and Cowper glands nor their ratio to live weight differed between clusters (Table 2).
Discussion
In the present study, we tried to influence the inflammatory status of boars at the end of the fattening period using two contrasted hygiene conditions. It was not successful but a high variability of the inflammatory status in each condition allowed us to identify two clusters of boars with different inflammatory status. To our knowledge, it is the first time that the influence of a subclinical inflammation on the pubertal development and fat androstenone of entire male pigs has been studied. This moderate inflammatory status was characterized by higher levels of blood granulocytes and plasma acute phase proteins, haptoglobin and CRP, and was probably related to subclinical respiratory diseases as indicated by pulmonary lesion score performed at slaughter. It had a negative influence on growth but no influence on testicular activity and hence on fat androstenone.
Classification of the pigs according to their inflammatory status
The inclusion of plasma concentrations of acute phase proteins, counts of lymphocytes and granulocytes and salivary concentrations of cortisol in a PCA analysis, allowed us to identify two clusters of pigs. In order to ascertain that pigs from these clusters were clearly in a different inflammatory state, statistical comparisons were performed. Both CRP and haptoglobin are proteins of the acute phase response (Heegaard et al., Reference Heegaard, Klausen, Nielsen, González-Ramón, Piñeiro, Lampreave and Alava1998), and were higher in Infl+ than Infl− pigs in good agreement with a higher inflammatory status in Infl+ pigs. Cortisol, which is a steroid with anti-inflammatory properties known to increase when the immune system is activated (Wright et al., Reference Wright, Balaji, Hill, Dritz, Knoppel and Minton2000), was also higher in Infl+ pigs. An increased number of granulocytes, which is a consequence of inflammatory health disorders (Odink et al., Reference Odink, Smeets, Visser, Sandman and Snijders1990; Le Floc’h et al., Reference Le Floc’h, Knudsen, Gidenne, Montagne, Merlot and Zemb2014b), was observed in Infl+ compared with Infl− pigs. A decreased number of lymphocytes which can be seen in pigs with inflammatory diseases (Odink et al., Reference Odink, Smeets, Visser, Sandman and Snijders1990) was also observed in Infl+ pigs. All these differences between clusters of pigs were already present on Day 0 suggesting a higher inflammatory status from the beginning of the experiment. Interestingly, the number of granulocytes and lymphocytes did not change during the course of the experiment in Infl+ pigs whereas it decreased (granulocytes) or increased (lymphocytes) in Infl− pigs which could indicate a reduction in the inflammatory status of these latter pigs.
Origin of the inflammation
Lung, snout and stomach lesions were analyzed at slaughter in order to detect clinical signs of diseases causing inflammation. Three types of lesions were observed in the pigs from both clusters of inflammation and those lesions were more severe in the pigs with a moderate inflammatory status suggesting that pneumoniae was, at least in part, at the origin of the higher inflammatory status in those pigs. Nasal lesions were also slightly more severe in this group. Even though the difference was not significant, rhinitis may have contributed to the higher inflammatory status in Infl+ pigs.
Influence of the hygiene conditions on the inflammatory status
Although the difference was not significant, the percentage of male pigs belonging to the Infl− cluster was higher in the Good than in the Poor conditions for Replicate 2 in agreement with what was expected from most previous experiments in our laboratory (Pastorelli et al., Reference Pastorelli, Le Floc’h, Merlot, Meunier-Salaun, van Milgen and Montagne2012; Le Floc’h et al., Reference Le Floc’h, Knudsen, Gidenne, Montagne, Merlot and Zemb2014b). Surprisingly it was lower in the Poor than in the Good conditions for Replicate 1. Reasons for this unexpected result are not clear. They may include the lack of antibiotics use to secure the pigs in the Good hygiene conditions and the age of the animals which was higher than in previous experiments. Indeed, it is likely that pigs become less sensitive to the degraded hygiene conditions because of the development of their acquired immunity against the most common pathogens.
Consequences of the inflammatory status on growth and sexual development
The inflammatory status had a significant effect on the growth rate, with a higher daily gain in the Infl− pigs. When animals are subjected to an inflammatory challenge, they usually decrease their feed intake and daily gain is reduced (Warren et al., Reference Warren, Finck, Arkins, Kelley, Scamurra, Murtaugh and Johnson1997; Webel et al., Reference Webel, Finck, Baker and Johnson1997; Le Floc’h et al., Reference Le Floc’h, Matte, Melchior, Van Milgen and Sève2010). These responses are usually explained by the concomitant action of inflammatory cytokines and hormones that reduce appetite and disturb nutrient metabolism, and in turn normal body processes like growth and lean or fat tissue accretion (Johnson, Reference Johnson1997). Protein metabolism is more specifically affected by the inflammatory process: amino acids are diverted from muscle protein deposition to support the synthesis of acute phase proteins in the liver and for the synthesis of immune proteins and peptides (immunoglobulin, glutathione) or bioactive molecules (Nitric oxide from arginine, kynurenine from tryptophan). Recently, in pigs, it has been shown that metabolism of threonine and arginine were modified by co-infection by influenza virus and Mycoplasma hyopneumoniae, probably to support metabolic pathways associated with immune functions (Le Floc’h et al., Reference Le Floc’h, Jondreville, Matte and Seve2014a).
Between Days 0 and 27 (=139 and 167 days of age), the rise in the concentrations of sex hormones indicated that the pubertal process of maturation was progressing in agreement with previous studies (Allrich et al., Reference Allrich, Christenson, Ford and Zimmerman1983; Prunier et al., Reference Prunier, Brillouet, Merlot, Meunier-Salaün and Tallet2013). Our study did not reveal any influence of the inflammatory state of boars on the concentrations of plasma sex hormones, the development of sex organs, or on fat androstenone. Therefore, our results do not validate the hypothesis that a moderate inflammatory status could inhibit Leydig cells’ activity derived from the observation that cytokines released during inflammation inhibit the hypothalamo–pituitary–testicular axis (Wallgren et al., Reference Wallgren, Kindahl and Rodriguezmartinez1993; Diemer et al., Reference Diemer, Hales and Weidner2003).
Conclusion
Comparison between boars with low and moderate inflammatory status did not show any significant difference regarding concentrations of plasma sex hormones, fat androstenone or development of sex organs. In view of our results, we cannot validate the initial hypothesis that a moderate inflammatory status can inhibit the testicular activity of boars and therefore their fat androstenone concentration. However, the hypothesis that a severe inflammation could alter the testicular axis remains to be tested. Present results confirm that a moderate inflammatory status reduces growth rate.
Acknowledgements
The authors are extremely grateful to the personnel of the Experimental Pig Unit of PEGASE, especially J. Delamarre, P. Knapen and P. Roger for taking care, performing measures and sampling on live pigs, M. Alix, J. Liger and J.-F. Rouaud of the slaughterhouse, as well as to R. Comte, S. Jaguelin, A. Lecorgne and F. Thomas of the PEGASE Research Unit for laboratory analyses.