

1. Introduction
Glauconite is an excellent marker of stratigraphic condensation associated with transgressive deposits (Amorosi, Reference Amorosi1995, Reference Amorosi1997, Reference Amorosi2011; Amorosi & Centineo, Reference Amorosi and Centineo1997; Banerjee et al. Reference Banerjee, Chattoraj, Saraswati, Dasgupta and Sarkar2012a, Reference Banerjee, Chattoraj, Saraswati, Dasgupta, Sarkar and Bumbyb , Reference Banerjee, Mondal, Chakraborty and Meena2015, Reference Banerjee, Bansal, Pande and Meena2016a, Reference Banerjee, Bansal and Thoratb ; Bansal et al. Reference Bansal, Banerjee, Pande, Arora and Meena2017, Reference Bansal, Banerjee, Ruidas and Pande2018). A recent review indicates unusually high abundance of glauconite during the Early Cretaceous, Late Cretaceous and Eocene, accounting for roughly 11 %, 18 % and 12 % of a total record of 453 glauconite occurrences respectively (Banerjee et al. Reference Banerjee, Bansal and Thorat2016b). As global sea level rise inundated almost all the continents during the Cretaceous, extensive glauconite formed in marine transgressive deposits (Odin et al. Reference Odin, Velde and Bonhomme1977; Glenn & Arthur, Reference Glenn and Arthur1990; Henderson, Reference Henderson1998; Mishra & Sen, Reference Mishra and Sen2001; Baioumy, Reference Baioumy2007; Rifai & Shaaban, Reference Rifai and Shaaban2007; Martinec et al. Reference Martinec, Vavro, Scucka and Maslan2010; Tewari et al. Reference Tewari, Lokho, Kumar and Siddaiah2010; Zalat et al. Reference Zalat, Zaid, Gadallah and Abdel–Aziz2012; Banning et al. Reference Banning, Rüde and Dölling2013; Anan, Reference Anan2014). Extensive epeiric seas dominated the Cretaceous, forming wide carbonate platforms with deposition of abundant organic-rich dark-coloured mud in deep seas and on continental shelves.
While the authigenic glauconite in recent times forms preferably within outer shelf and slope environments (Odin & Matter, Reference Odin and Matter1981; Amorosi, Reference Amorosi1997, Reference Amorosi, Morad, Ketzer and De Ross2012; Banerjee et al. Reference Banerjee, Bansal and Thorat2016b), the Late Cretaceous variety is reported from shallow marine environment (Banerjee et al. Reference Banerjee, Bansal and Thorat2016b). The exact reasons for the different palaeobathymetric implications of glauconites formed at different times are not yet understood. Chafetz & Reid (Reference Chafetz and Reid2000) proposed an unusual seawater composition for shallow marine glauconitization in Palaeozoic seas. We investigate the factors behind the formation of Late Cretaceous glauconite and intend to assess the palaeo-redox conditions and seawater composition. Glauconite occurs within the Coniacian platformal carbonate succession of the Narmada basin in central India. Detailed petrography reveals mode of occurrence of the glauconite, while rare earth elements (REE) data unravel palaeo-depositional conditions. Finally, factors facilitating the extensive formation of glauconite across the margins of palaeo-Tethys are explored.
2. Geological background
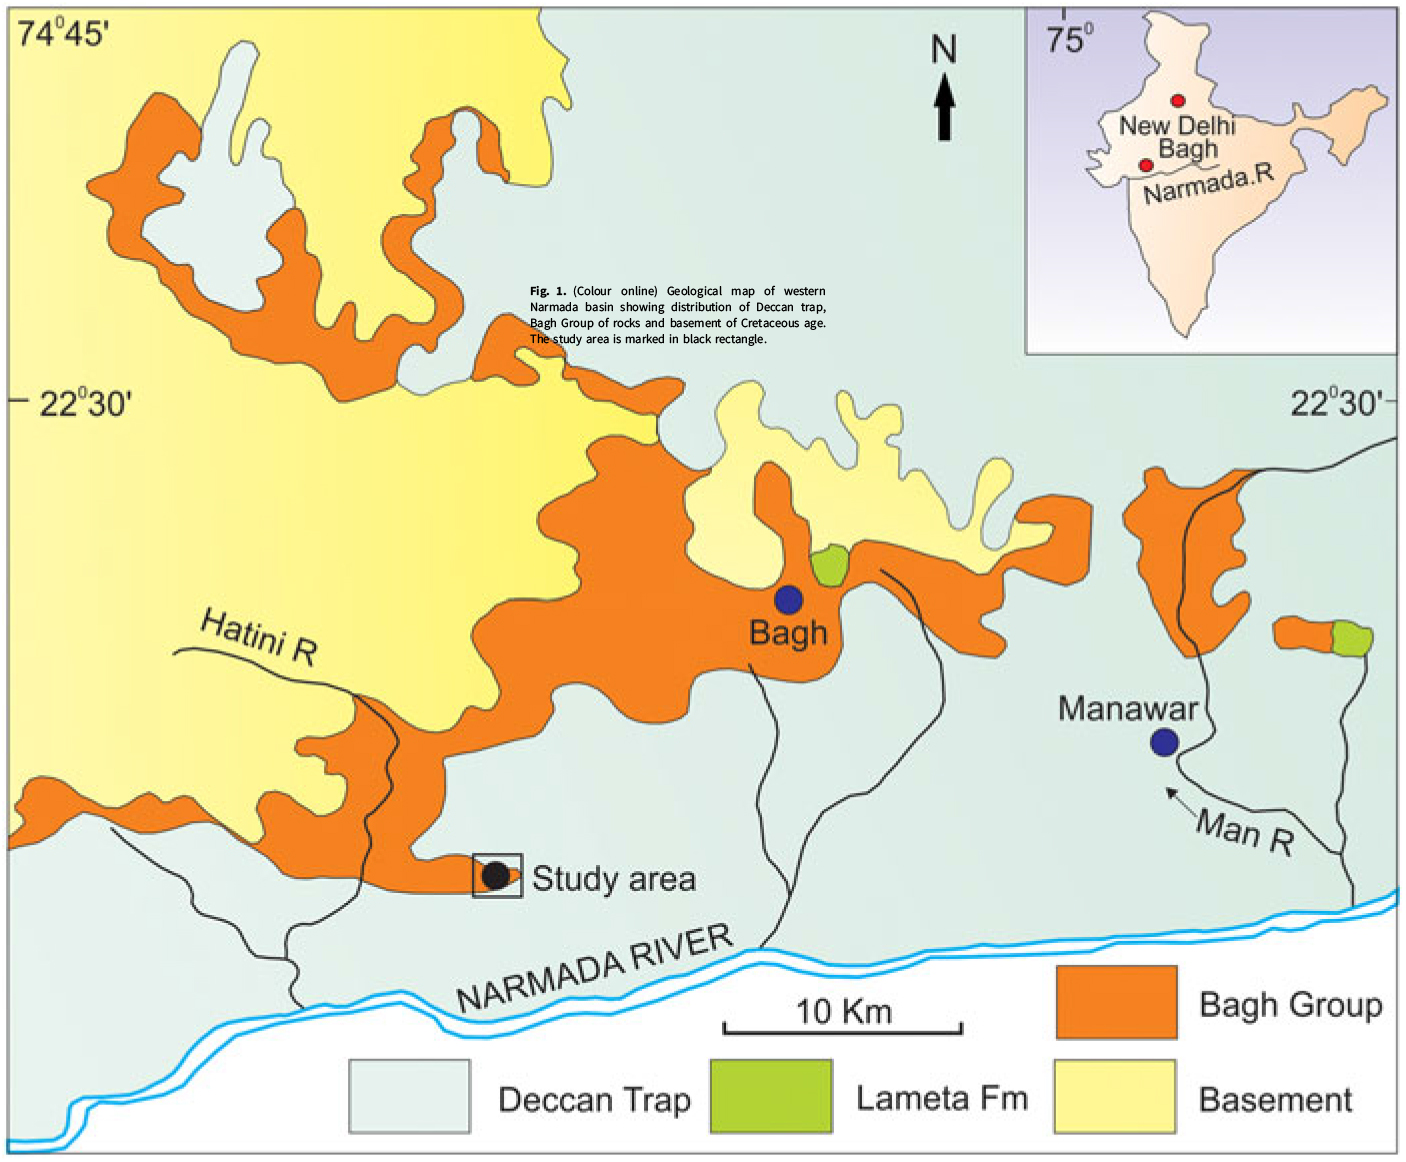
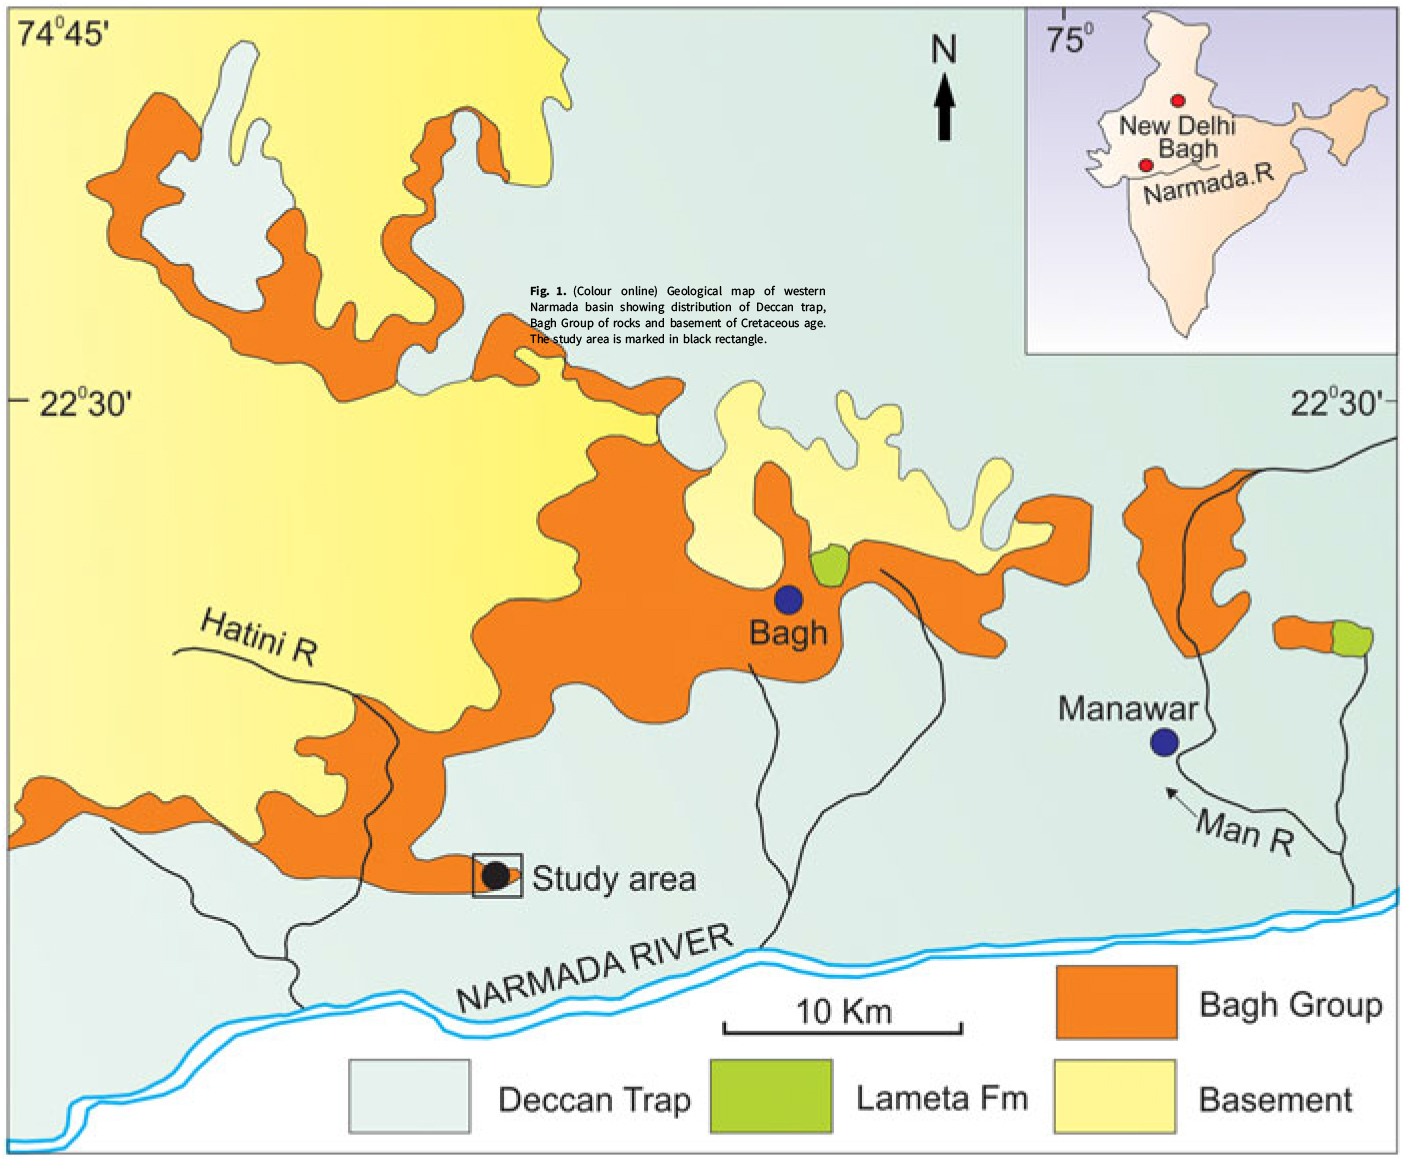
The Late Cretaceous Bagh Group in central India represents deposition within the eastwardly transgressing arm of Tethys and crops out in the western part of the ~1200 km long Narmada basin(Tandon, Reference Tandon, Okada and Mateer2000; Fig. 1). The three-tiered Bagh Group is a mixed siliciclastic–carbonate succession comprising Nimar, Nodular Limestone and Bryozoan Limestone formations from the bottom to the top(Gangopadhyay & Maiti, Reference Gangopadhyay and Maiti2012; Figs 2 and 3a), the age of which was originally assigned as Turonian–Coniacian on the basis of the ammonoid Placenticeratids(Chiplonkar & Ghare, Reference Chiplonkar and Ghare1976). Recent biostratigraphic investigation constrains Cenomanian, Turonian and Coniacian ages for the Nimar, Nodular Limestone and Bryozoan Limestone formations respectively (Kumar et al. Reference Kumar, Pathak, Pandey, Jaitly and Gautam2018).
Geological map of western Narmada basin showing distribution of Deccan trap, Bagh Group of rocks and basement of Cretaceous age. The study area is marked in black rectangle.
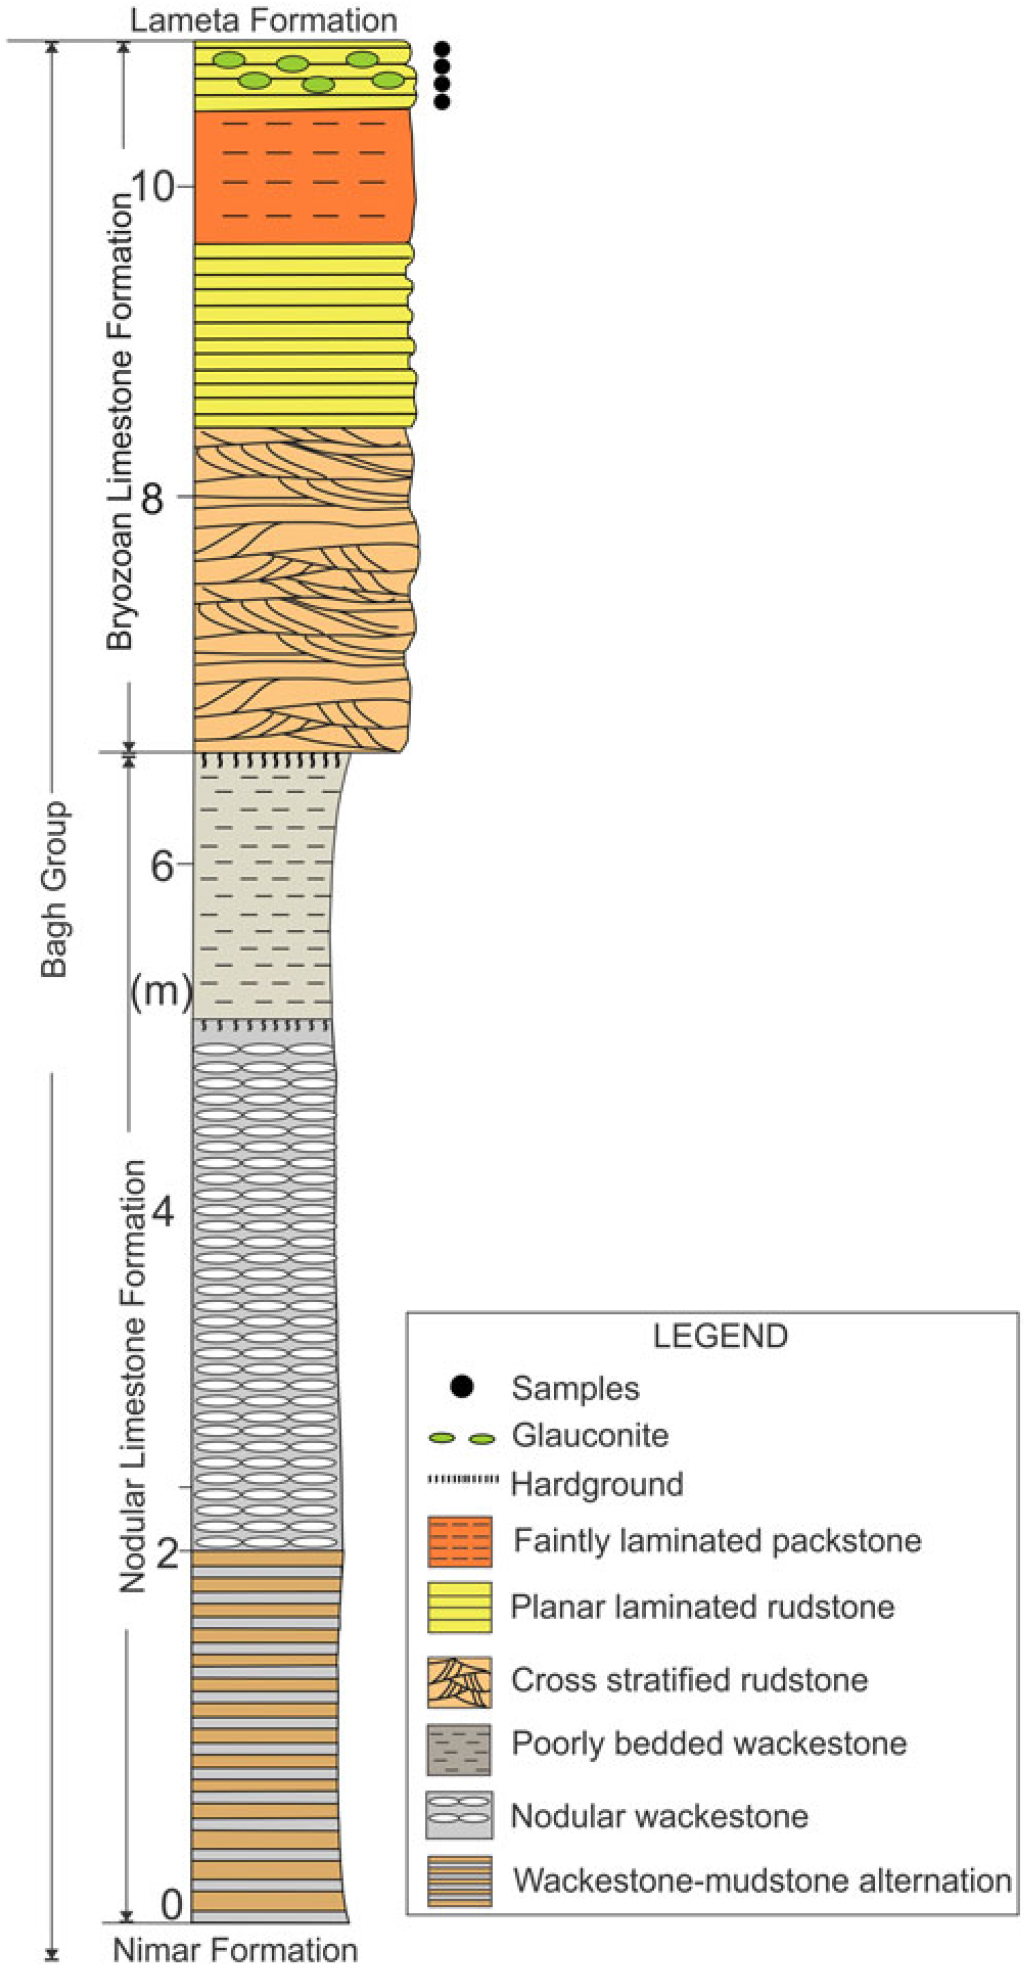
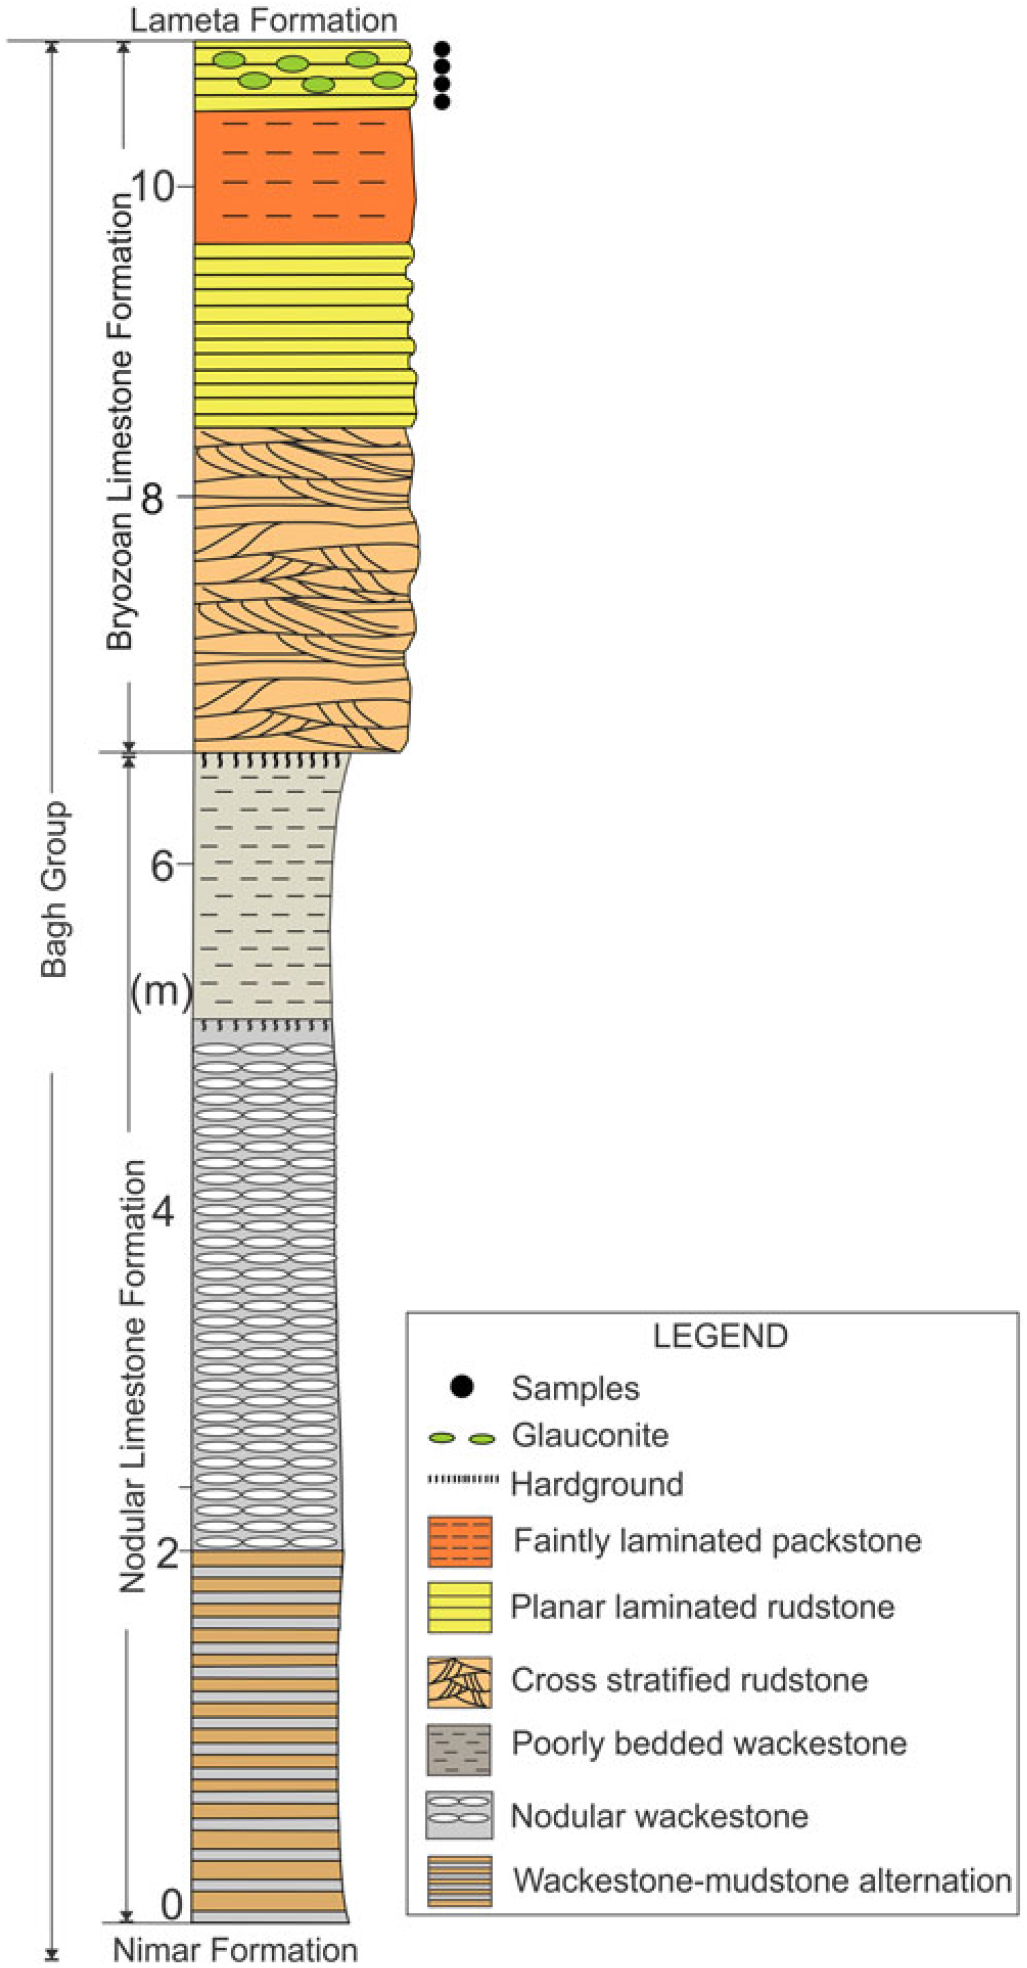
Lithostratigraphic framework of the Bagh Group (note occurrence of glauconite near the top, sample position marked by solid circles).
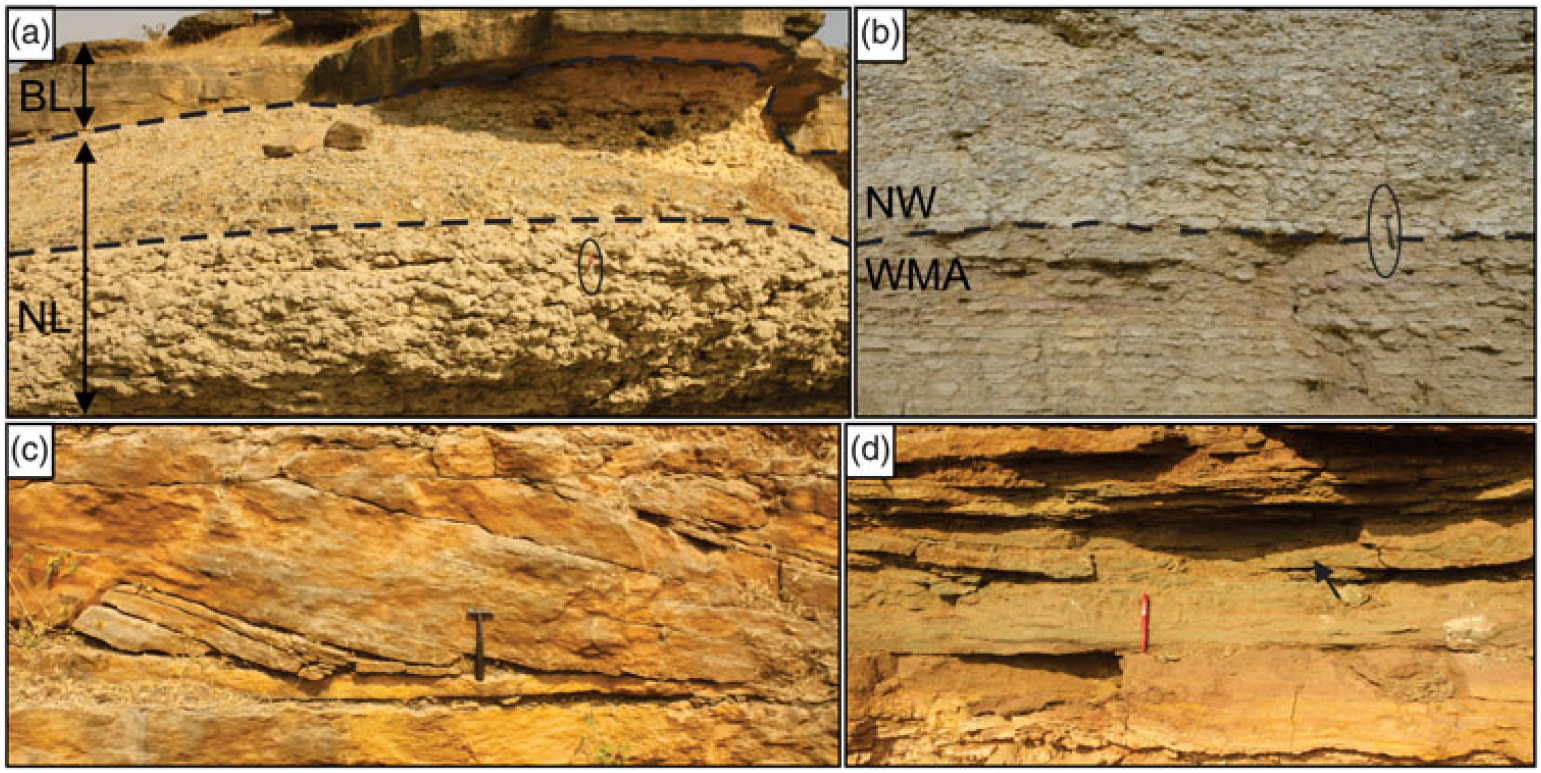
Field photographs showing (a) the contact between Nodular Limestone and Bryozoan Limestone formations, (b) the contact between wackestone–mudstone alteration (WMA) and nodular wackestone (NW) facies of Nodular Limestone Formation, (c) cross-stratified rudstone facies and (d) planar laminated rudstone facies containing glauconite bed marked by arrow (hammer length 38 cm; coin diameter 2.5 cm; pen length 14 cm).
Resting directly on the Precambrian basement, the Nimar Formation (~30 m thick) consists of a shallow marine siliciclastic succession (Bose & Das, Reference Bose and Das1986). The overlying ~6.5 m thick Nodular Limestone Formation comprises three non-repetitive facies, viz. wackestone–mudstone alternations, nodular wackestone and poorly bedded wackestone in ascending order in the study area around Ratitalai (Fig. 2). The overlying ~3.5 m thick Bryozoan Limestone begins with a cross-stratified rudstone consisting predominantly of broken shells of bryozoans, bivalves, gastropods, brachiopods and echinoids. It consists of three facies, viz. cross-stratified rudstone, planar laminated rudstone and faintly laminated packstone. The planar laminated rudstone at the top, hosting the glauconite, contains abundant clastics, including, quartz, feldspars and mud fragments (Fig. 2).
The 40–60 cm thick glauconitic bed within the Bryozoan Limestone Formation occurs in the top part of the transgressive deposit of the Bagh Group. It gradationally passes upward to the overall prograding Lameta Formation as content of siliciclastics increases significantly (Tandon, Reference Tandon, Okada and Mateer2000; Bansal et al. Reference Bansal, Banerjee, Ruidas and Pande2018). The dominance of fine-grained sedimentary rocks, intact nature of the bioclasts and the facies association of the Nodular Limestone Formation indicate a shallow marine restricted platform–tidal flat system (Gangopadhyay & Maiti, Reference Gangopadhyay and Maiti2012; Ruidas et al. Reference Ruidas, Paul and Gangopadhyay2018). Moderate sorting of bioclasts, abundance of current structures, local reactivation surfaces and bipolarity of current structures suggest deposition in tidal channels.
3. Materials and methods
This study includes samples collected from the outcrops of the Ratitalai Section of the Bagh Group. Precise sample positions are marked in the graphic log (Fig. 2). Detailed petrography was carried out using a Leica DM 4500P polarizing microscope connected to a Leica DFC420 camera. All rock samples were powdered and processed to obtain glauconite pellets. Processing of samples included wetting of the samples and treatment with anhydrous Na2CO3 powder and H2O2 solution before heating for 15–20 min on a hot plate. The treated samples were finally cooled, washed and oven-dried for 24 hours. Clean glauconite pellets were further picked for geochemical and mineralogical analysis using a Zeiss Stemi 2000 stereo zoom microscope. About 0.1 g of glauconite pellets was powdered and ultra-sonicated for preparation of smear mounts. These smear mounts were scanned from 1° to 70° (step size 0.026° 2θ), using nickel filter copper radiation at a scan speed of 96 s/step in an Empyrean X-Ray Diffractometer with Pixel 3D detector at the Department of Earth Sciences, Indian Institute of Technology Bombay. The glauconite pellets were examined under three different modes of scanning, viz., air-dried, after ethylene glycol treatment and after heating at 400 °C, for 2 hours maintaining the same instrumental settings. Major element concentrations in glauconite were examined in five thin sections on 34 points using a Cameca SX 5 Electron Probe Micro Analyzer at the Department of Earth Sciences, Indian Institute of Technology Bombay, with accelerating voltage 15 kV, specimen current of 40 nA and beam diameter of 1 μm (peak 10–20 s and background counting 5–10 s) with analytical error of less than 1 %. Standards included minerals as well as synthetic phases. Concentrations of REE were determined using a Thermo Fisher Scientific, Germany (Element XR) instrument at the Thermo Fisher Lab in Mumbai. About 25 mg of cleaned glauconite pellets was precisely weighed and dissolved in a mixture of ~2.5 mL of HF–HNO3 (2:1) in Teflon bombs for REE analysis. The solution was kept in an ultrasonic bath for 45 min, evaporated and dried down. The residue was treated with concentrated 8N HNO3 and evaporated. The same step was repeated three times before diluting the sample with 25 mL of 1N HNO3. Ruthenium (Ru) was added as internal standard to all samples and standards to monitor the instrumental drift induced during analysis. US Geological Survey (USGS) geochemical reference standards (SCO-1, SCO-2, SBC-1) were used to assess the accuracy of the analyses.
4. Results
4.a. Sedimentological background
The Nodular Limestone Formation comprises three non-repetitive facies, viz. wackestone–mudstone alterations, nodular wackestone and poorly bedded wackestone in ascending order in the study area around Ratitalai (Fig. 2). All three facies of the Nodular Limestone Formation are almost devoid of primary sedimentary structures. Juvenile tests of echinoderms, molluscs and gastropods sporadically occur within the constituent facies. The basal ~2 m thick wackestone–mudstone facies exhibits alternations between planar and wavy bedded wackestone and mudstone (Fig. 3b). Wackestone beds are tabular, irregular and knobby, often exhibiting diffused planar laminae. Bed thickness varies from 3 to 7 cm. Both mudstone and wackestone beds exhibit desiccation cracks. The overlying 3.5–5 m thick, nodular wackestone facies is characterized by the conspicuous nodularity (Fig. 3b). The average diameter of nodules is ~5 cm. Desiccation cracks are common within the facies. Highly impregnated Fe-oxide borings and localized Thallassinoides burrows mark the top of the facies. The uppermost facies of the Nodular Limestone Formation consist dominantly of wackestone with thin mudstone interbeds. The thickness of the facies varies from 3.5 to 4 m in the study area. A 20 cm thick hardground with highly impregnated Fe-oxide borings occurs at the top. In situ root traces are frequent.
The Bryozoan Limestone Formation consists of three facies: cross-stratified rudstone, planar laminated rudstone and faintly laminated packstone. The cross-stratified rudstone facies consists of reddish to greyish brown, 30–90 cm thick tabular cross-beds of rudstones (Fig. 3c). It consists entirely of reworked bioclasts including bryozoans, bivalves, gastropods, brachiopods and echinoids. Reactivation surfaces occur within cross-stratified sets locally. Thalassinoides burrows are uncommonly present. The overlying glauconitic, planar laminated rudstone facies varies in thickness from 40 cm to 1 m and alternates with a faintly laminated packstone (Figs 2 and 3d). The content of siliciclastics is significantly high within the planar laminated rudstone (avg. ~50 %) compared to the background facies. The siliciclastics include quartz, feldspars and mud fragments, while allochems consists of broken bioclasts of bryozoans, bivalves, gastropods and echinoid spines. The occurrence of abundant oysters marks the top of the facies. The thickness of the faintly laminated packstone, sandwiched between two planar laminated rudstone beds, ranges from 1 to 1.7 m. Glauconite occurs within the top 20 cm thick rudstone overlying this packstone.
The underlying Nimar Formation consists predominantly of shallow marine sandstones (Bose & Das, Reference Bose and Das1986; Ahmad & Akhtar, Reference Ahmad and Akhtar1990; Akhtar & Ahmad, Reference Akhtar and Ahmad1991; Bhattacharya & Jha, Reference Bhattacharya and Jha2014). Curtailment of clastic supply at the end of deposition of the Nimar Sandstone facilitated the deposition of carbonate sediments. The dominance of fine-grained sediments, thin and very small shells and intact nature of the bioclasts indicate a low-energy depositional setting for the Nodular Limestone Formation. Recent petrographic investigations reveal a wide spectrum of emergence features within the constituent facies of the Nodular Limestone Formation including rhizoconcretions, alveolar texture, in situ brecciation and micro-nodulation (Ruidas, Paul & Gangopadhyay, Reference Ruidas, Paul and Gangopadhyay2018). The facies association of the Nodular Limestone indicates a shallow marine restricted platform–tidal flat system with periodic subaerial exposure (Ruidas et al. Reference Ruidas, Paul and Gangopadhyay2018). The peritidal nature of the Nodular Limestone Formation is also indicated in previous studies (Gangopadhyay & Halder, Reference Gangopadhyay and Halder1996; Akhtar & Khan, Reference Akhtar and Khan1997; Gangopadhyay & Bardhan, Reference Gangopadhyay and Bardhan2000; Jaitly & Ajane, Reference Jaitly and Ajane2013; Ruidas et al. Reference Ruidas, Paul and Gangopadhyay2018). The Bryozoan Limestone Formation begins with a cross-stratified rudstone in most places. Moderate sorting of bioclasts, rarity of mud and abundance of current structures indicate a high-energy depositional environment. The occurrence of reactivation surfaces and bipolarity of current structures suggests deposition in tidal channels. Planar laminae as well as abundant siliciclastics indicate a shallow marine, high-energy depositional condition.
The Nodular Limestone Formation is overall deepening upward and it represents the upper part of a transgressive deposit. The lower part of the same transgressive deposit incorporates the Nimar Formation (Bose & Das, Reference Bose and Das1986). The glauconite bed within the Bryozoan Limestone Formation, therefore, occurs near the top part of a shallow marine transgressive deposit. It gradationally passes upward to the overall prograding Lameta Formation with increase in the content of siliciclastics.
4.b. Petrography of glauconite
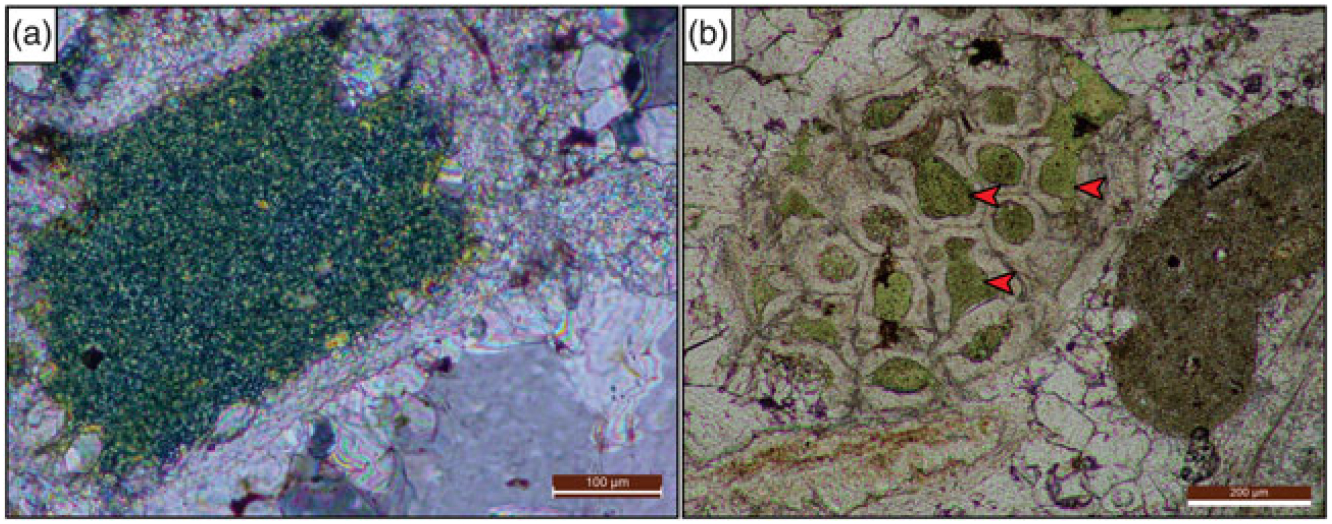
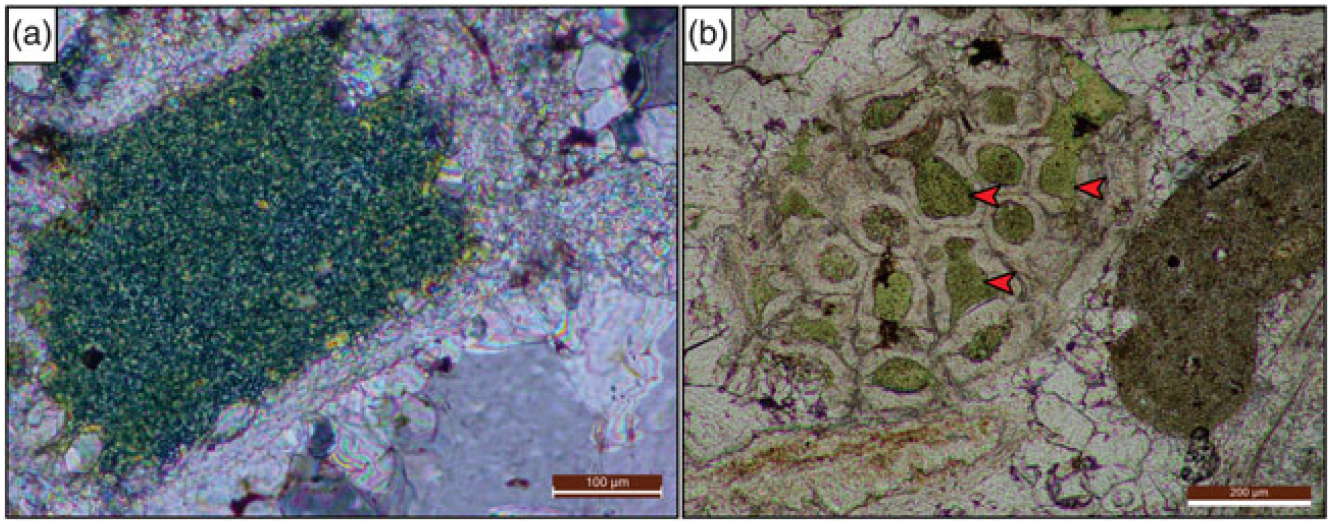
Glauconite grains constitute up to ~30 % of the rock by volume within the planar laminated rudstone facies at the top of the Bryozoan Limestone Formation. Glauconite occurs as two different forms: as replacement of K-feldspars, referred to as glauconitized feldspars (Fig. 4a), and as infillings within pores, and carapaces of bioclasts, referred to here as glauconite infillings (Fig. 4b). The glauconite replaces K-feldspar along cleavages and fractures, forming linear and interconnected stringers which are up to 150 µm long. The K-feldspar is thoroughly altered to glauconite in places, leaving no trace of the primary mineral (Fig. 4a). On the other hand, glauconite infillings occur within zooecia of bryozoa (Fig. 4b), pores of echinoid and carapaces of ostracoda. The average diameter of individual bryozoan infillings varies between 40 and 250 μm. Both varieties of glauconite exhibit light green to olive green colour in plane polarized light and high-interference colour under crossed polars. The absence of broken pellets as well as poor sorting of glauconite grains suggest an autochthonous nature for the glauconites (Amorosi, Reference Amorosi1995, Reference Amorosi1997; Hesselbo & Huggett, Reference Hesselbo and Huggett2001; Longuépée & Cousineau, Reference Longuépée and Cousineau2006; Banerjee et al. Reference Banerjee, Chattoraj, Saraswati, Dasgupta and Sarkar2012a, Reference Banerjee, Chattoraj, Saraswati, Dasgupta, Sarkar and Bumbyb , Reference Banerjee, Mondal, Chakraborty and Meena2015, Reference Banerjee, Bansal, Pande and Meena2016a).
Photomicrographs (a) under cross polars showing glauconitized feldspar; (b) glauconite infillings within bryozoan test marked by red arrows.
4.c. Mineralogical characteristics of glauconite
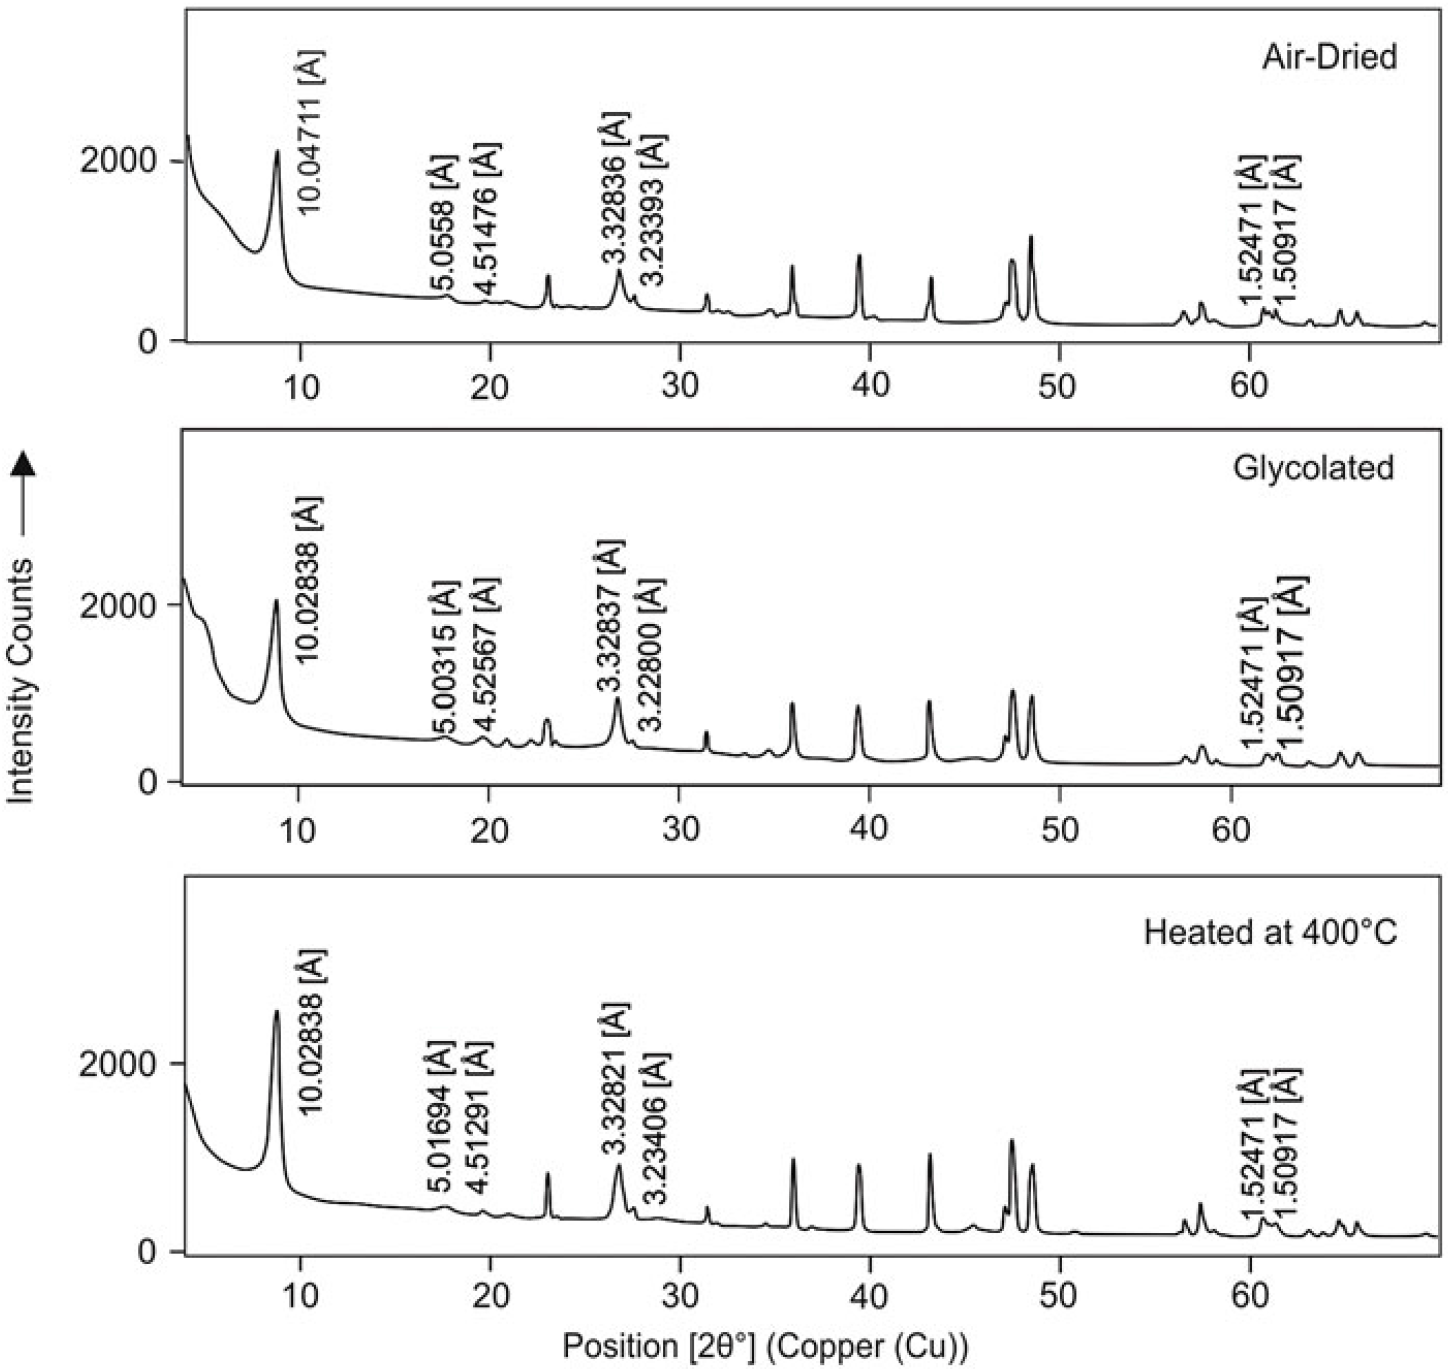
The air-dried samples of glauconite pellets exhibit a prominent basal reflection (001) at 10.04 Å, and relatively weaker reflections of (020) at 4.51 Å, (003) at 3.32 Å and (060) at 1.52 Å (Fig. 5). The peaks remain unchanged after glycolation and heating at 400 °C. The peaks appear sharp, narrow and intense in all three modes of sample scanning, even though they exhibit broad bases. The 3.66 Å peak at 11 $\overline 2 $ and the 3.09 Å peak at 112 reflections are absent. A minor coexisting peak of illite is observed at 5.05 Å (001 reflection) and 1.50 Å at (060 reflection) (Fig. 5).
XRD diffractograms of a glauconite sample under different conditions: air-dried, glycolated and heating at 400 °C.
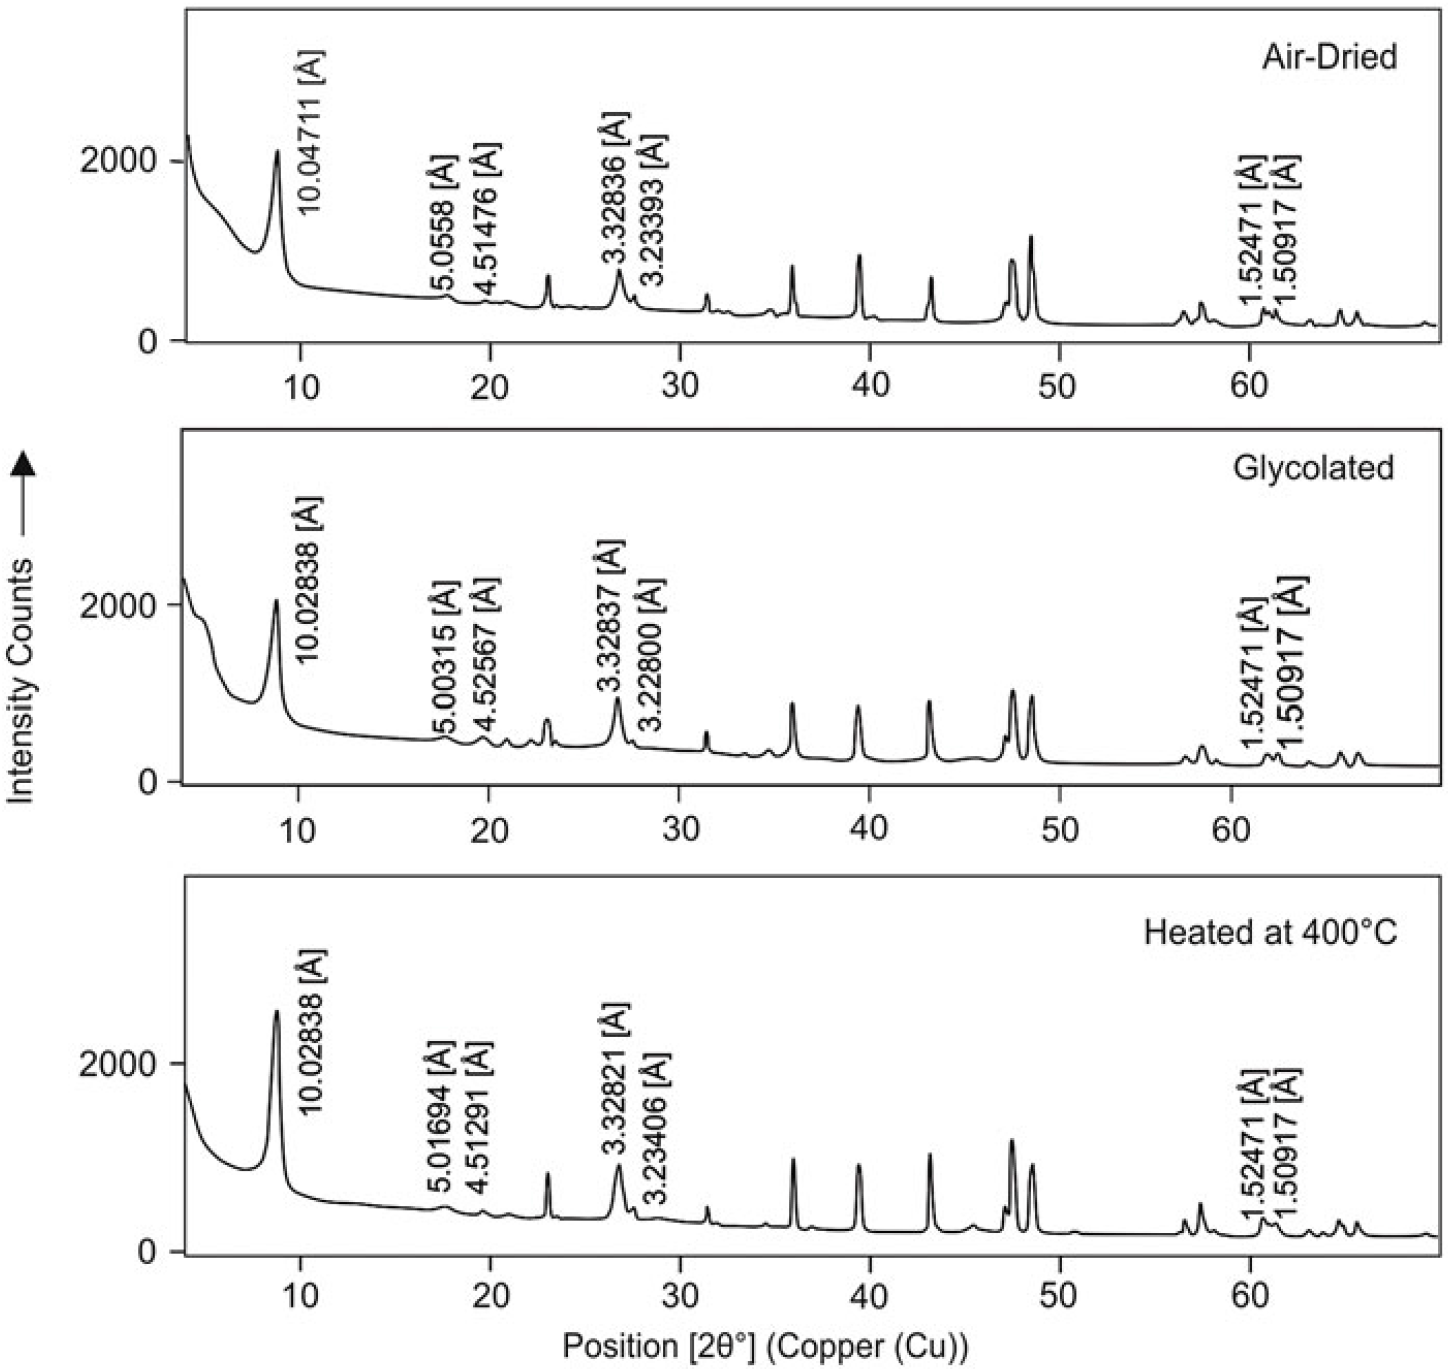
The prominent peak at 10.04 Å (001) basal reflection along with the (020) reflection at 4.51 Å (003) reflection at 3.33 Å and (060) reflection at 1.52 Å are characteristic of glauconite (Odin & Matter, Reference Odin and Matter1981; Odom, Reference Odom and Bailey1984). Unmoved (001) reflection after glycolation and heating and the absence of 11 $\overline 2 $ and 112 reflections suggest negligible inter-stratification between expandable and non-expandable layers (Thompson & Hower, Reference Thompson and Hower1975). Glauconite in the Bryozoan Limestone Formation may be described as ‘highly-evolved to evolved’ type, containing ~10 % expandable layers, corresponding to ~8 % K2O content (Odom, Reference Odom and Bailey1984) which are clearly different from clay minerals of verdine facies (cf. Harding et al. Reference Harding, Nash, Petersen, Ekdale and Dyar2014).
4.d. Mössbauer spectroscopic study of glauconite
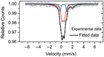
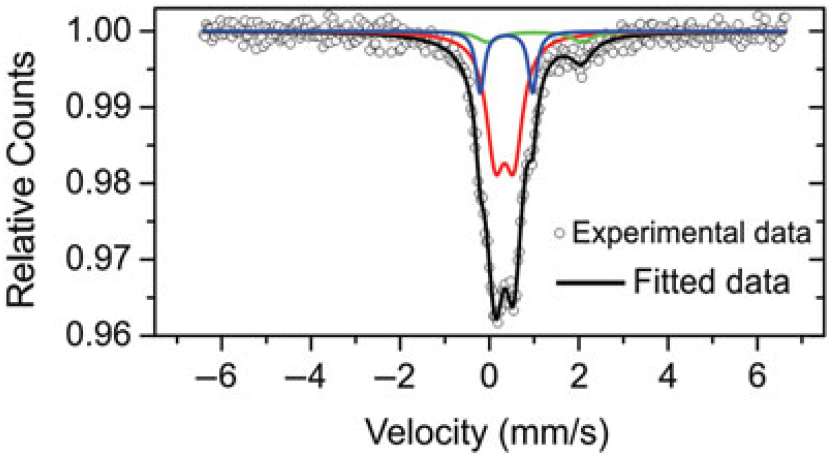
The Mössbauer spectrum of the glauconite sample indicates three symmetric doublets (Fig. 6). Doublets A and C, with isomer shift (δ) value δ = 0.33 and 0.37 mm s−1 respectively, correspond to ferric ions, and doublet B (δ = 1.01 mm s−1) indicates ferrous ions (Table 1). The doublet with the smaller quadrupole splitting (ΔEQ) is assigned to the less distorted cis-M (2) position whereas the doublet with the larger quadrupole splitting is assigned to Fe3+ ions in the trans-M (1) position (Hogg & Meads, Reference Hogg and Meads1970; Rolf et al. Reference Rolf, Kimball and Odom1977; McConchie et al. Reference McConchie, Ward, McCann and Lewis1979; Kotlicki et al. Reference Kotlicki, Szczyrba and Wiewiora1981). The ΔEQ has a lower value for doublet A (ΔEQ = 0.415 mm s−1) than for doublet C (1.18 mm s−1). Therefore, doublet A is assigned to ferric ions in the cis-M (2) position, and doublet B is assigned to ferric ions in the trans-M (1) position. Doublet D belongs to ferrous ions and it has a high ΔEQ value equal to 2.105 mm s−1, corresponding to the trans-M (1) position (octahedral site). The Fe2+/Fe3+ ratio of glauconite was calculated by taking into consideration the χ2 value (fitting parameter) and the relative area (under curve) of the component belonging to the cationic composition of the octahedral sheets. The average Fe2+/Fe3+ ratio obtained by the Mössbauer spectroscopic study of glauconite is 0.12 (Table 1).
Mössbauer spectrum of glauconite sample RT-8 recorded at room temperature indicating the relative abundance of Fe3+ (red and blue doublet) and Fe2+ (green doublet) cations.
Computer-fitted Mössbauer spectral parameters of selected glauconite sample (RT-8)

4.e. Major element composition of glauconite
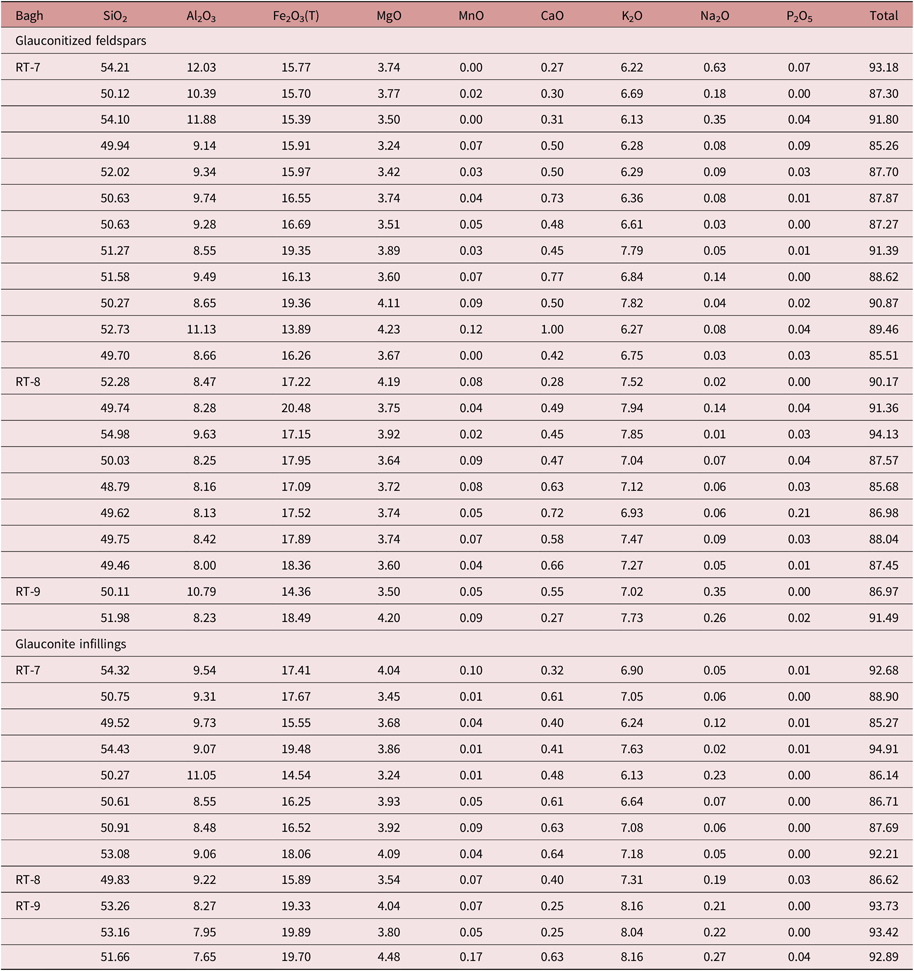
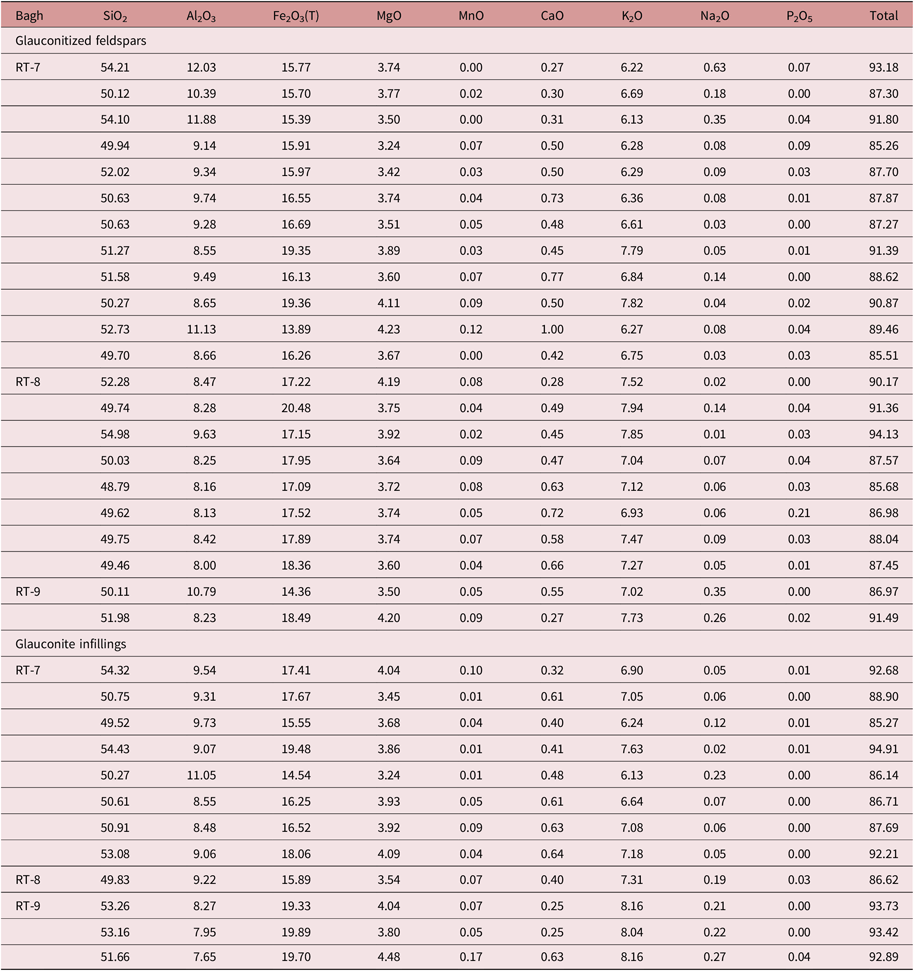
Electron Probe Micro Analysis (EPMA) data of both varieties of glauconites in the Bryozoan Limestone Formation are provided in Table 2. All analyses were normalized to 100 wt % on an anhydrous basis for different cross-plots. The K2O content of glauconites varies from 6.13 % to 8.16 %, suggesting ‘evolved’ to ‘highly evolved’ stage of maturation (Odin & Matter, Reference Odin and Matter1981; Amorosi, Reference Amorosi1997). The Fe2O3 (total) content of glauconite varies from 13.89 % to 20.48 %. The Al2O3 content of the glauconite is a bit higher than usual, varying from 8.00 % to 12.03 % (Odin & Matter, Reference Odin and Matter1981). The MgO content of glauconite is also slightly higher than the average, varying from 3.24 % to 4.48 % (cf. Odin & Matter, Reference Odin and Matter1981; Banerjee et al. Reference Banerjee, Bansal and Thorat2016b). The CaO content of all varieties of glauconites is negligible, mostly ~1 % (av. 0.49 %). The SiO2 content of glauconite varies from 48.79 % to 54.98 %. The mineral geochemistry of glauconite in Bryozoan Limestone Formation is therefore characterized by high K, high Si, high Mg, high Al and moderate Fe contents (Odin & Matter, Reference Odin and Matter1981; Banerjee et al. Reference Banerjee, Bansal and Thorat2016b). Similar compositions of glauconite are reported from the shallow-marine originated Kurnub Group (Jarrar et al. Reference Jarrar, Amireh and Zachmann2000) and the Nice Arc region (Pasquini et al. Reference Pasquini, Lualdi and Vercesi2004). In contrast, Baldermann et al. (Reference Baldermann, Dietzel, Mavromatis, Mittermayr, Warr and Wemmer2017) reported the deep marine glauconite of the Ivory Coast – Ghana Marginal Ridge as containing high Fe, low Al and K.
Oxide weight percentage of glauconite in the Bryozoan Limestone Formation
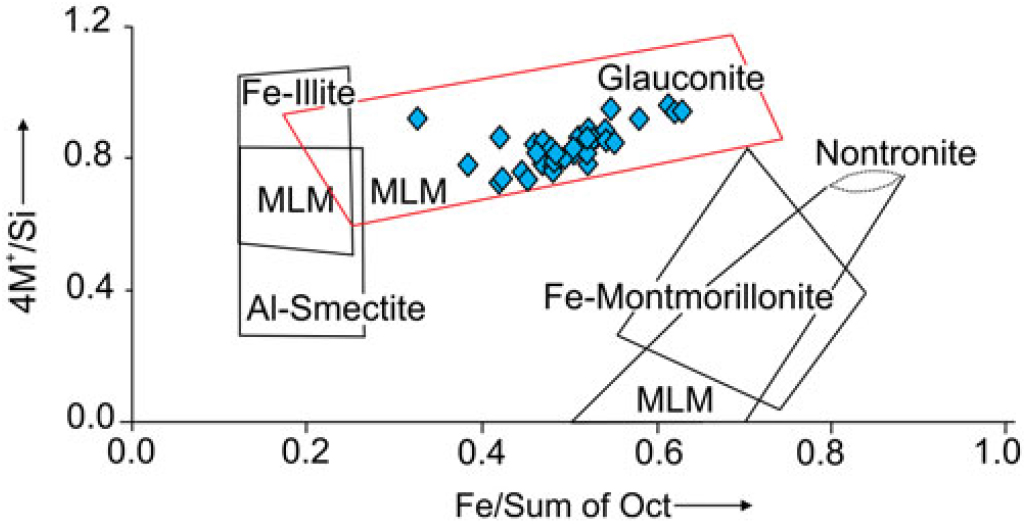
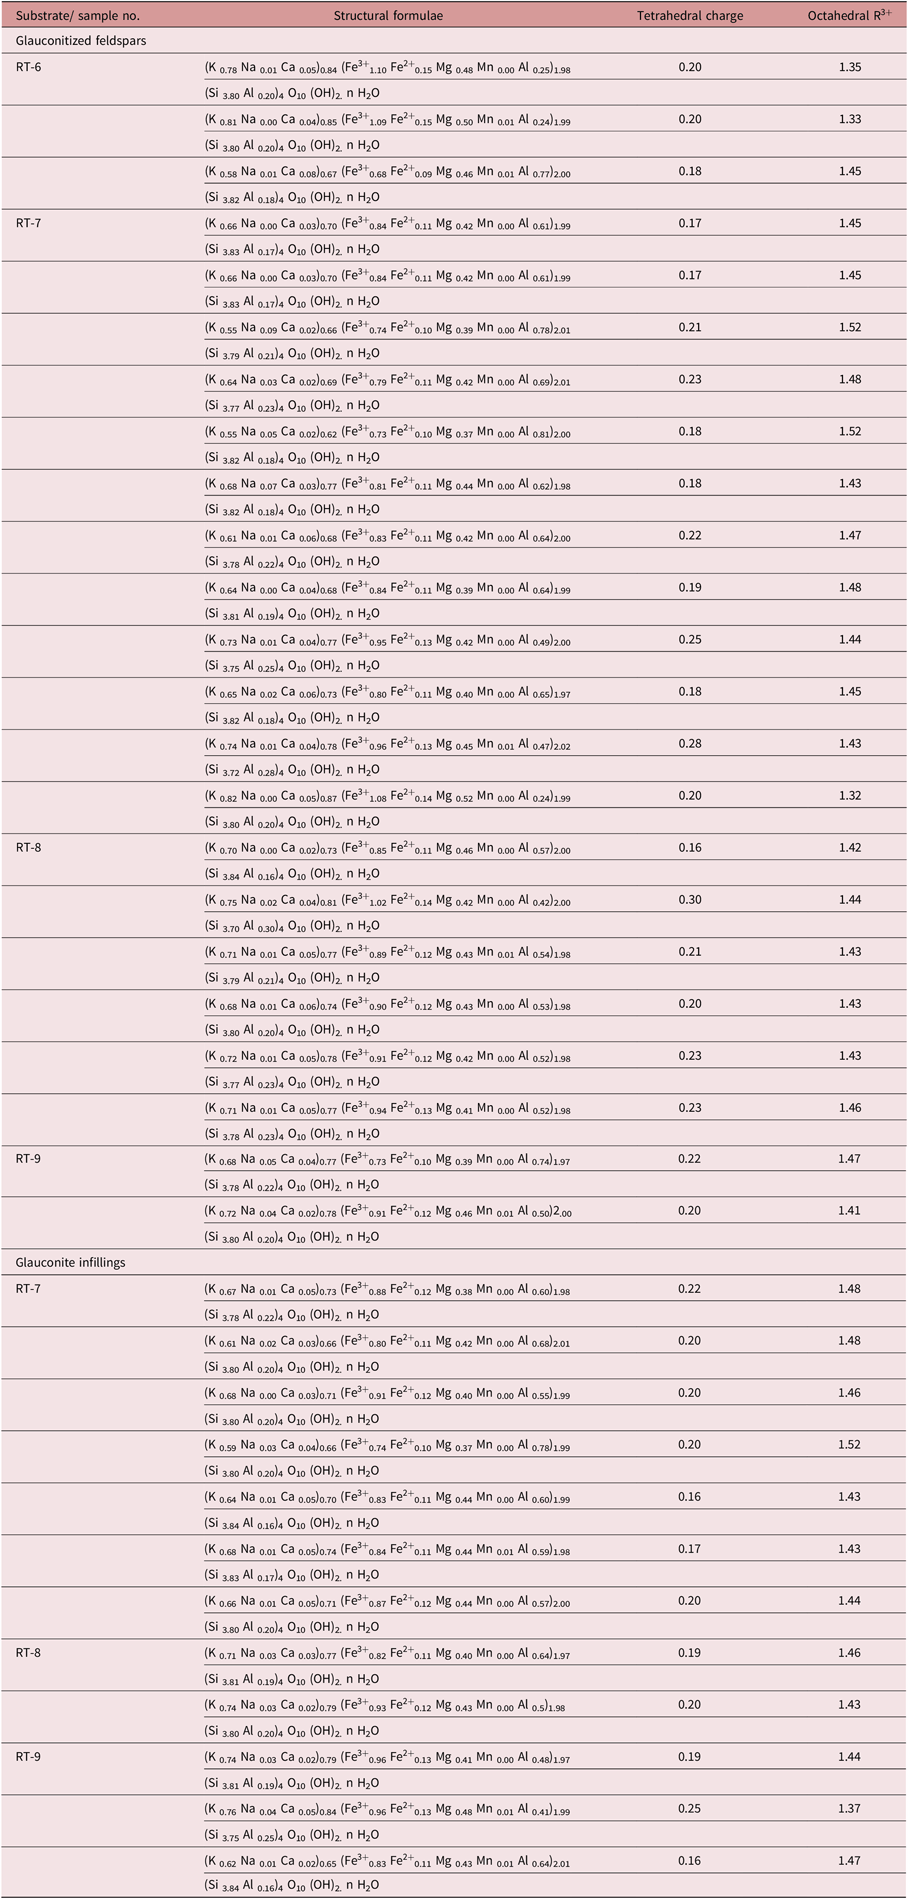
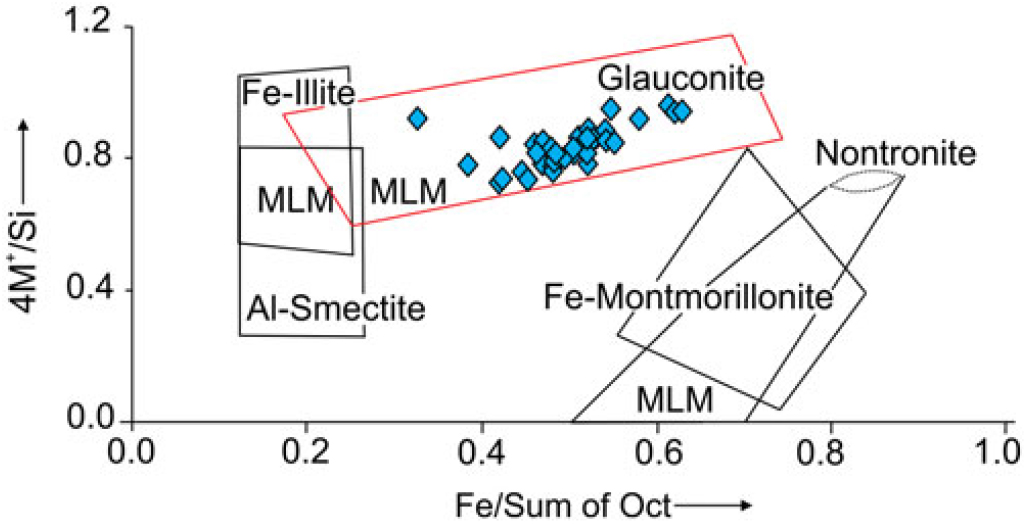
The average Fe2+/Fe3+ ratio (0.12) obtained by the Mössbauer spectroscopic study was used for calculation of octahedral and tetrahedral charge as well as the structural formula of all the glauconite (Table 3). All data plot within the field of glauconite in the cross-plot of 4 M+/Si (M+ = interlayered cations) vs (Fe octahedral)/(Sum of octahedral charge) (cf. Meunier & El Albani, Reference Meunier and El Albani2007) (Fig. 7). The average formula of the glauconite in the Bryozoan Limestone is
 $$\eqalign{& {\left( {{{\rm{K}}_{0.{\rm{7}}0}}{\rm{N}}{{\rm{a}}_{0.0{\rm{2}}}}{\rm{C}}{{\rm{a}}_{0.0{\rm{4}}}}} \right)_{0.{\rm{75}}}}{\left( {{\rm{F}}{{\rm{e}}^{{\rm{3}} + }}_{0.{\rm{87}}}{\rm{F}}{{\rm{e}}^{{\rm{2}} + }}_{0.{\rm{11}}}{\rm{M}}{{\rm{g}}_{0.{\rm{42}}}}{\rm{A}}{{\rm{l}}_{0.{\rm{57}}}}} \right)_{{\rm{1}}.{\rm{99}}}}\cr& {\left( {{\rm{S}}{{\rm{i}}_{{\rm{3}}.{\rm{78}}}}{\rm{A}}{{\rm{l}}_{0.{\rm{22}}}}} \right)_{\rm{4}}}{{\rm{O}}_{{\rm{1}}0}}{\left( {{\rm{OH}}} \right)_{\rm{2}}}.{\rm{n }}{{\rm{H}}_{\rm{2}}}{\rm{O}}.$$
Structural composition of glauconite in the Bryozoan Limestone Formation
Cross-plot of (4 M+)/Si (M = interlayered cations) vs (Fe octahedral)/(Sum of octahedral charge) (original plot after Meunier & El Albani, Reference Meunier and El Albani2007).
4.f. Concentrations of REE in Glauconite
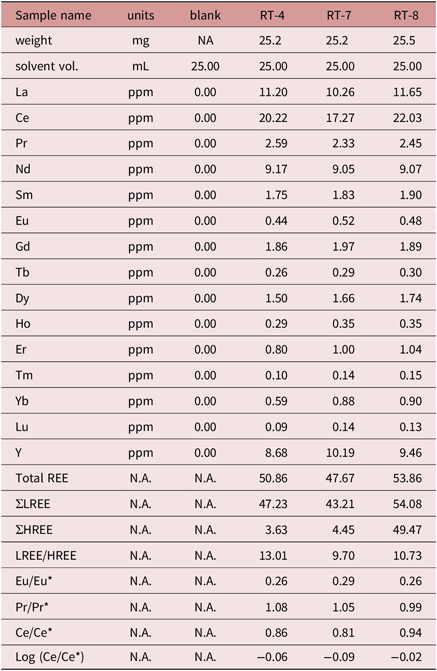
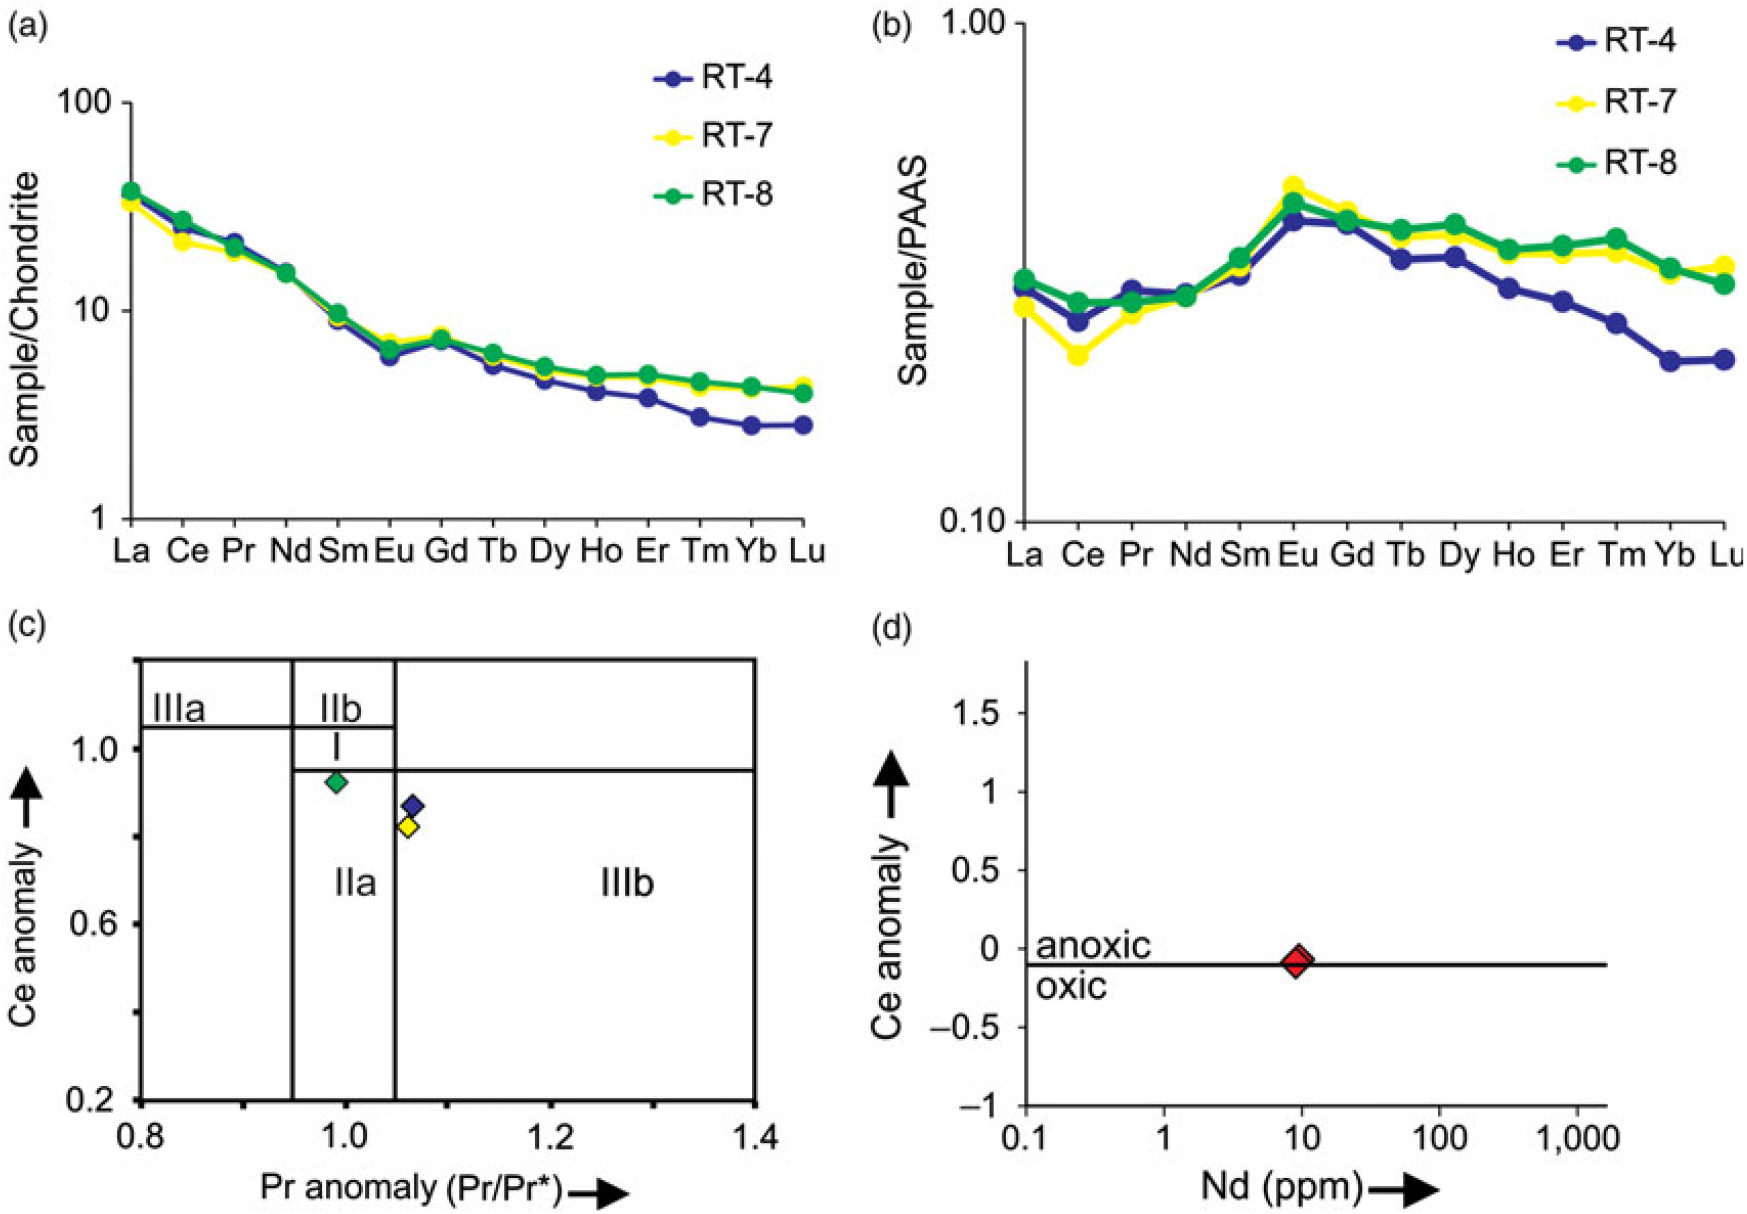
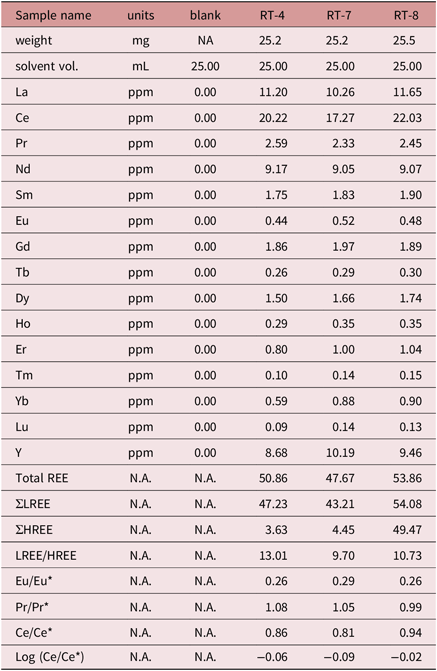
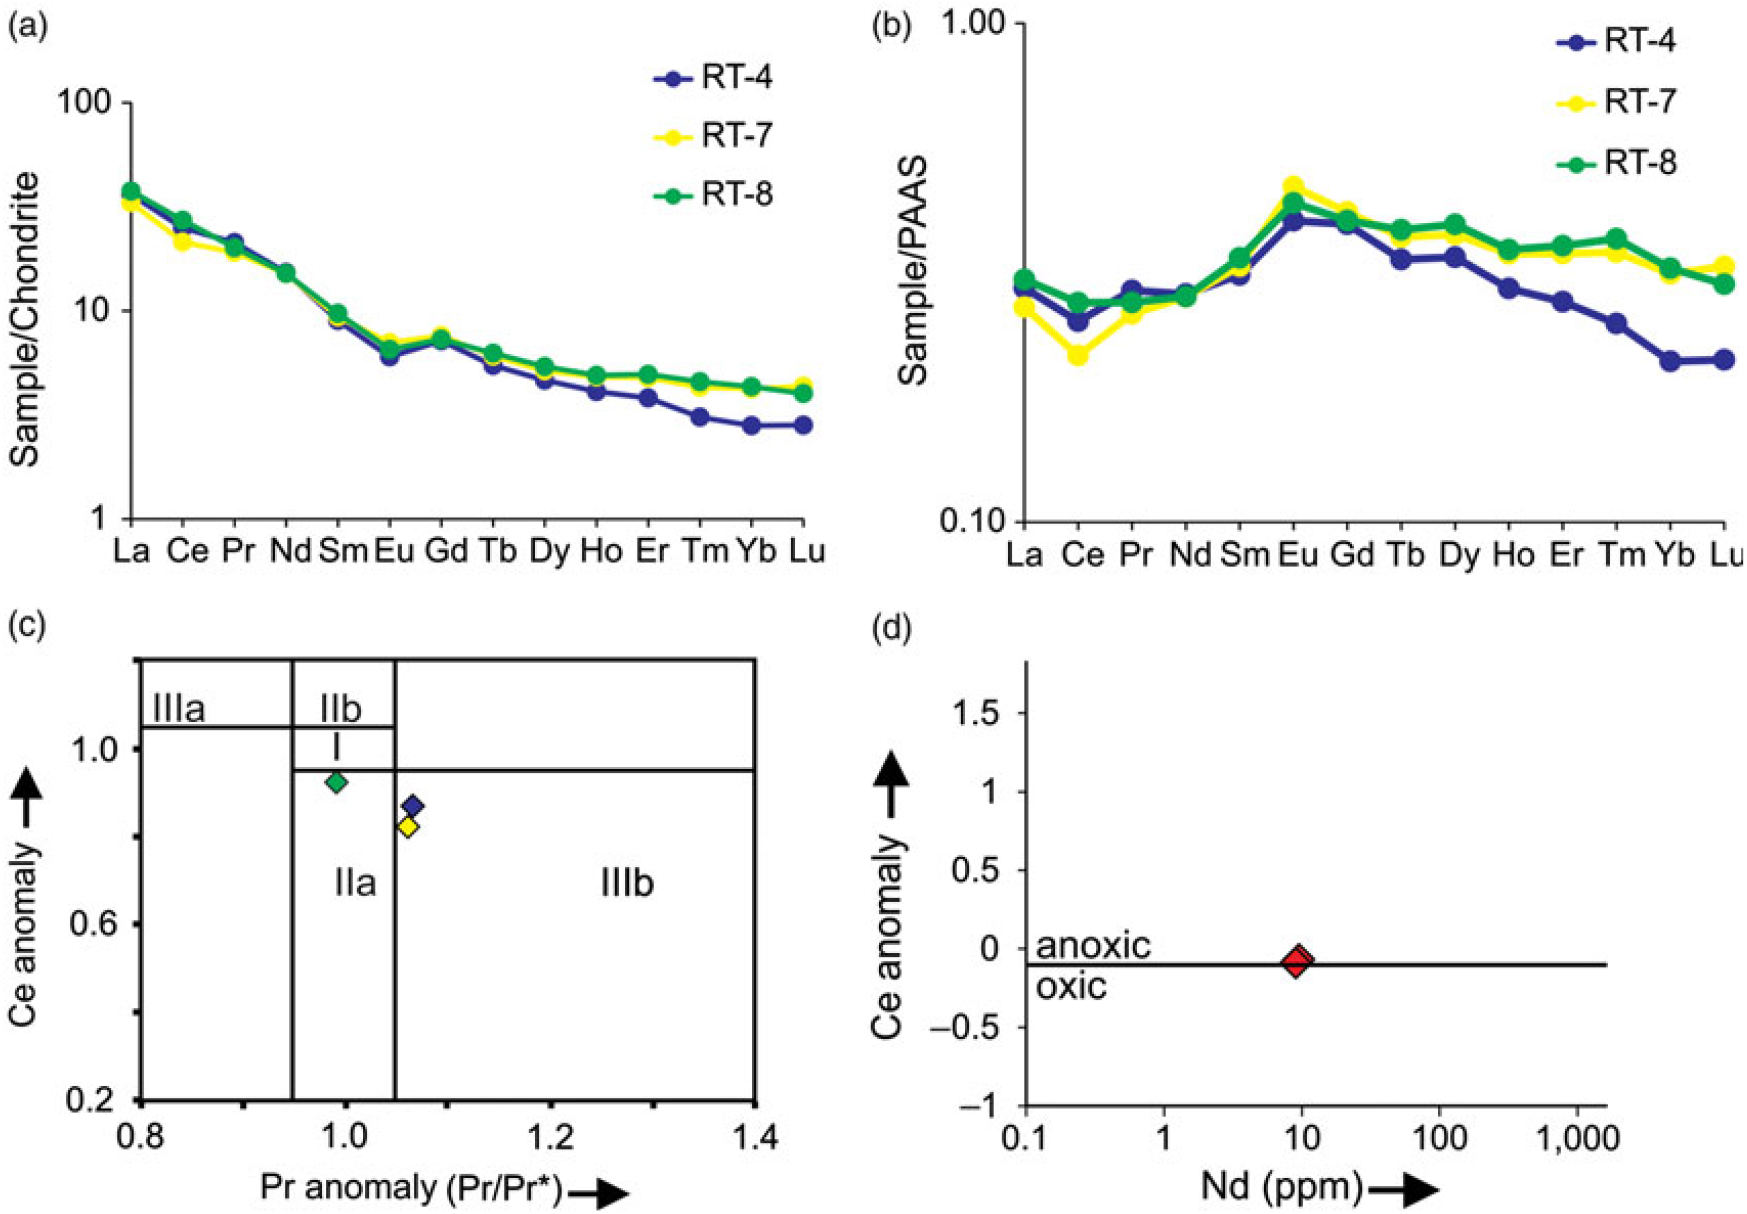
Total REE concentrations of glauconite remain similar in all the samples (Table 4). The concentration of ΣLREE is higher (avg. 46.57 ppm) than ΣHREE (avg. 4.23 ppm). Chondrite-normalized pattern reveals moderate light-REE (LREE)/heavy-REE (HREE) fractionation (9.70 to 13.01) and very weak negative Eu anomaly (Fig. 8a). The PAAS (Post-Archean Australian Shale)-normalized pattern exhibit a ‘hat-shape’ with a negative Ce anomaly and a moderately positive Eu anomaly (Fig. 8b). The hat-shape of the PAAS-normalized – REE pattern is characteristic of authigenic glauconite (cf. Jarrar et al. Reference Jarrar, Amireh and Zachmann2000; Banerjee et al. Reference Banerjee, Chattoraj, Saraswati, Dasgupta and Sarkar2012a, Reference Banerjee, Chattoraj, Saraswati, Dasgupta, Sarkar and Bumbyb ; Bansal et al. Reference Bansal, Banerjee, Ruidas and Pande2018). Glauconite samples occupy both IIb and IIIb fields in the Ce anomaly vs Pr anomaly (Pr/Pr*) cross-plot of Bau & Dulski (Reference Bau and Dulski1996) (Fig. 8c). The samples plotting in the IIIb field correctly indicate the palaeo-redox condition(cf. Bau & Dulski, Reference Bau and Dulski1996). The true negative Ce anomaly reflects a sub-oxic condition of the early diagenetic environment (cf. Elderfield & Pagett, Reference Elderfield and Pagett1986; Wright et al. Reference Wright, Schrader and Holser1987; Fig. 7d). Nd concentrations of glauconite (9.05–9.17 ppm) suggest moderate sedimentation rate (cf. Wright et al. Reference Wright, Schrader and Holser1987; Fig. 8d; Table 4).
REE concentrations of selected glauconites in the Bryozoan Limestone Formation
(a) Chondrite-normalized and (b) PAAS-normalized REE patterns of glauconite; (c) cross-plot of (Ce/Ce*) vs (Pr/Pr*) in glauconites (after Bau & Dulski, Reference Bau and Dulski1996) (note two glauconite samples plotting in the IIIb field); (d) cross-plot of Ce anomaly and Nd concentrations (anoxic–oxic boundary is placed at −0.10 after Wright et al. Reference Wright, Schrader and Holser1987).
5. Discussion
The early diagenetic glauconite in the Bryozoan Limestone Formation occurs as stringers within feldspars. Textural evidences indicate that glauconite replaces K-feldspars (Banerjee et al. Reference Banerjee, Jeevankumar and Eriksson2008, Reference Banerjee, Mondal, Chakraborty and Meena2015; Bansal et al. Reference Bansal, Banerjee, Pande, Arora and Meena2017, Reference Bansal, Banerjee, Ruidas and Pande2018). The evolutionary trend of glauconite within the Bryozoan Limestone Formation neither supports the ‘verdissement’ nor ‘layer lattice’ theory as the K2O contents of glauconites are consistently high. The high K2O content of glauconite, moderate Fe2O3 (total) and textural evidences corroborate the replacement of K-feldspar (Banerjee et al. Reference Banerjee, Mondal, Chakraborty and Meena2015; Bansal et al. Reference Bansal, Banerjee, Pande, Arora and Meena2017, Reference Bansal, Banerjee, Ruidas and Pande2018). The Fe2O3 (total) content of glauconite in the Bryozoan Limestone Formation varies from 13.89 % to 20.48 %, averaging 17.19 %. The rate of sedimentation, palaeo-redox condition, composition of substrate, microenvironment within the substrate and surrounding sediment determines the Fe2O3 (total) content (Odin & Matter, Reference Odin and Matter1981; Meunier & El Albani, Reference Meunier and El Albani2007; Banerjee et al. Reference Banerjee, Bansal and Thorat2016b; Baldermann et al. Reference Baldermann, Dietzel, Mavromatis, Mittermayr, Warr and Wemmer2017; Tang et al. Reference Tang, Shi, Ma, Jiang, Zhou and Shi2017). The sub-oxic condition of the Bryozoan Limestone Formation resulted in mobility of Fe ions. The moderate Fe2O3 (total) content emplaced into the glauconite structure possibly related to a moderate rate of sedimentation (Baldermann et al. Reference Baldermann, Dietzel, Mavromatis, Mittermayr, Warr and Wemmer2017). The Al2O3 content of the glauconite remained high because of its availability in the shallow marine environment and Al–Fe substitution in the glauconite structure. The Bryozoan Limestone glauconite formed in shallow sea surrounded by cratonic areas. Detrital siliciclastics delivered from these cratonic areas provided additional cations like Si, Al, Fe and K. A combination of moderate Fe2O3 and high Al2O3, SiO2 and K2O, therefore, characterizes shallow marine glauconite formed in sub-oxic conditions under moderate sedimentation rate. Deep marine glauconite, forming at a lower temperature, usually exhibits a high Fe2O3, low Al2O3 and a five times slower sedimentation rate compared to shallow marine glauconite.
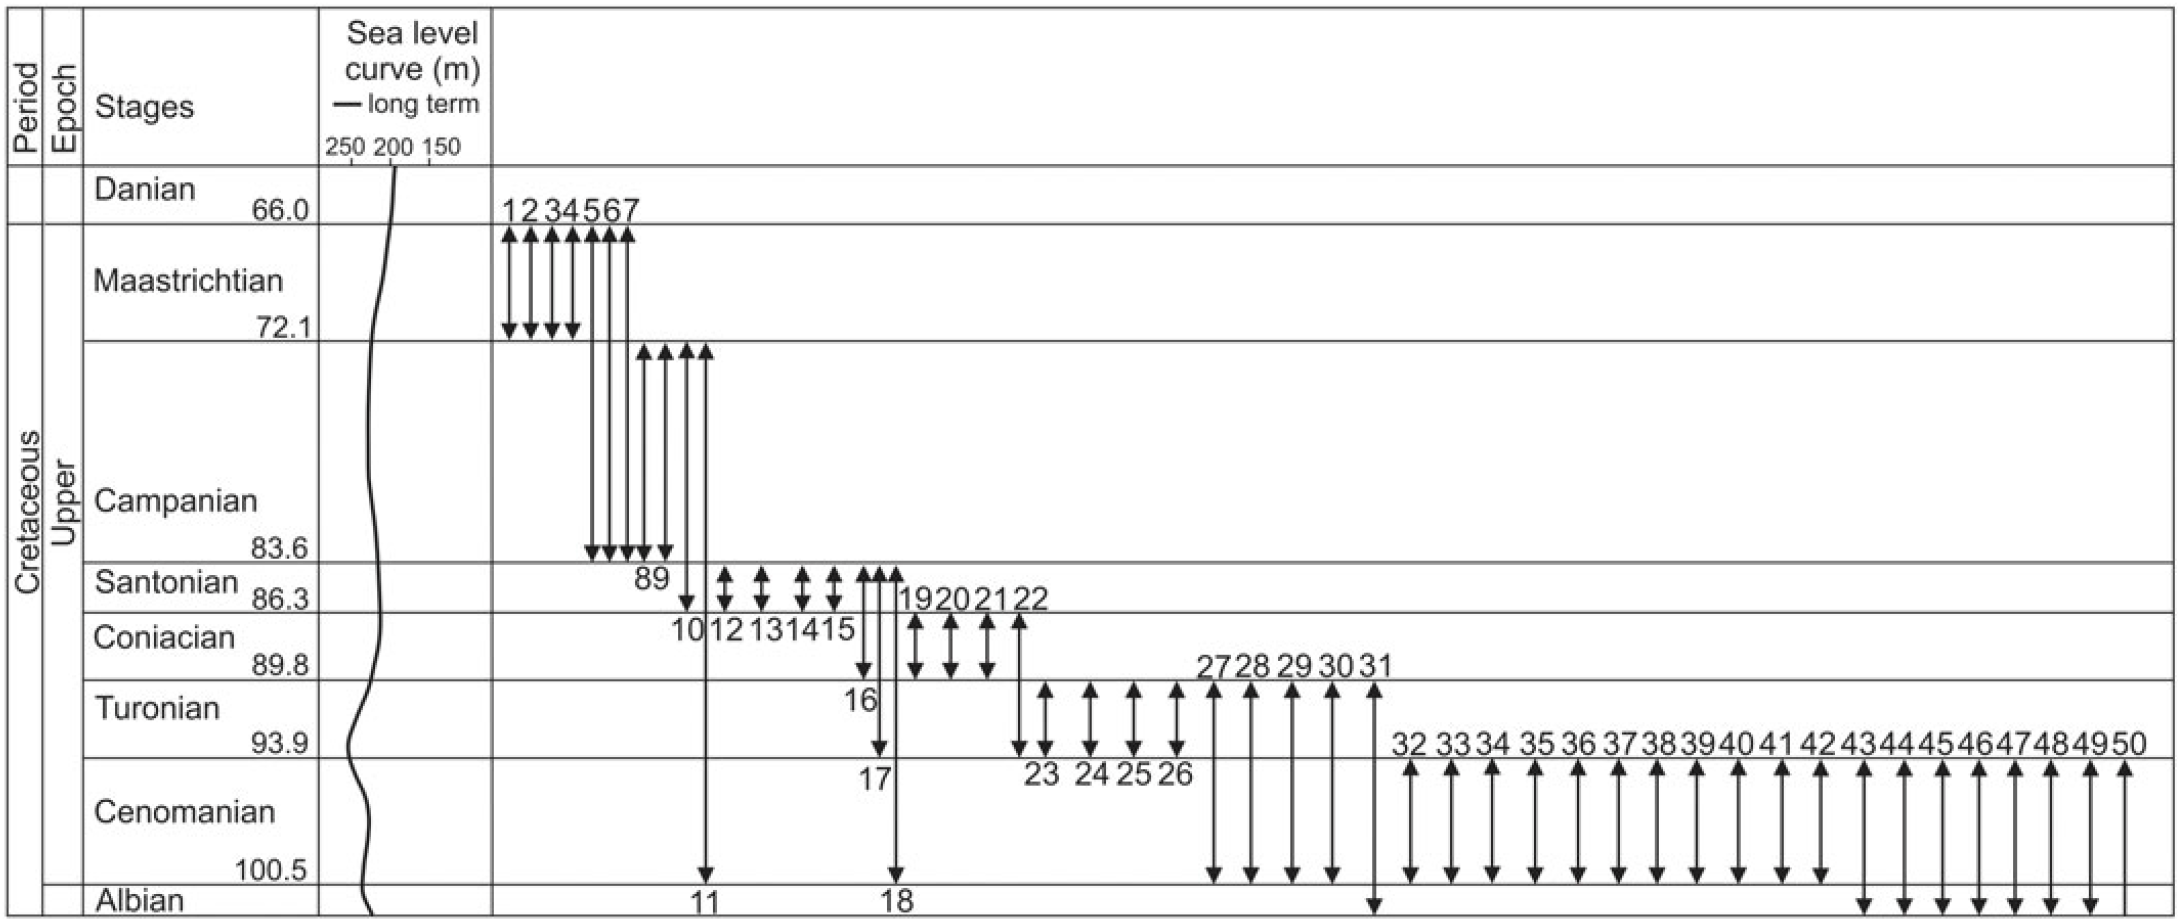
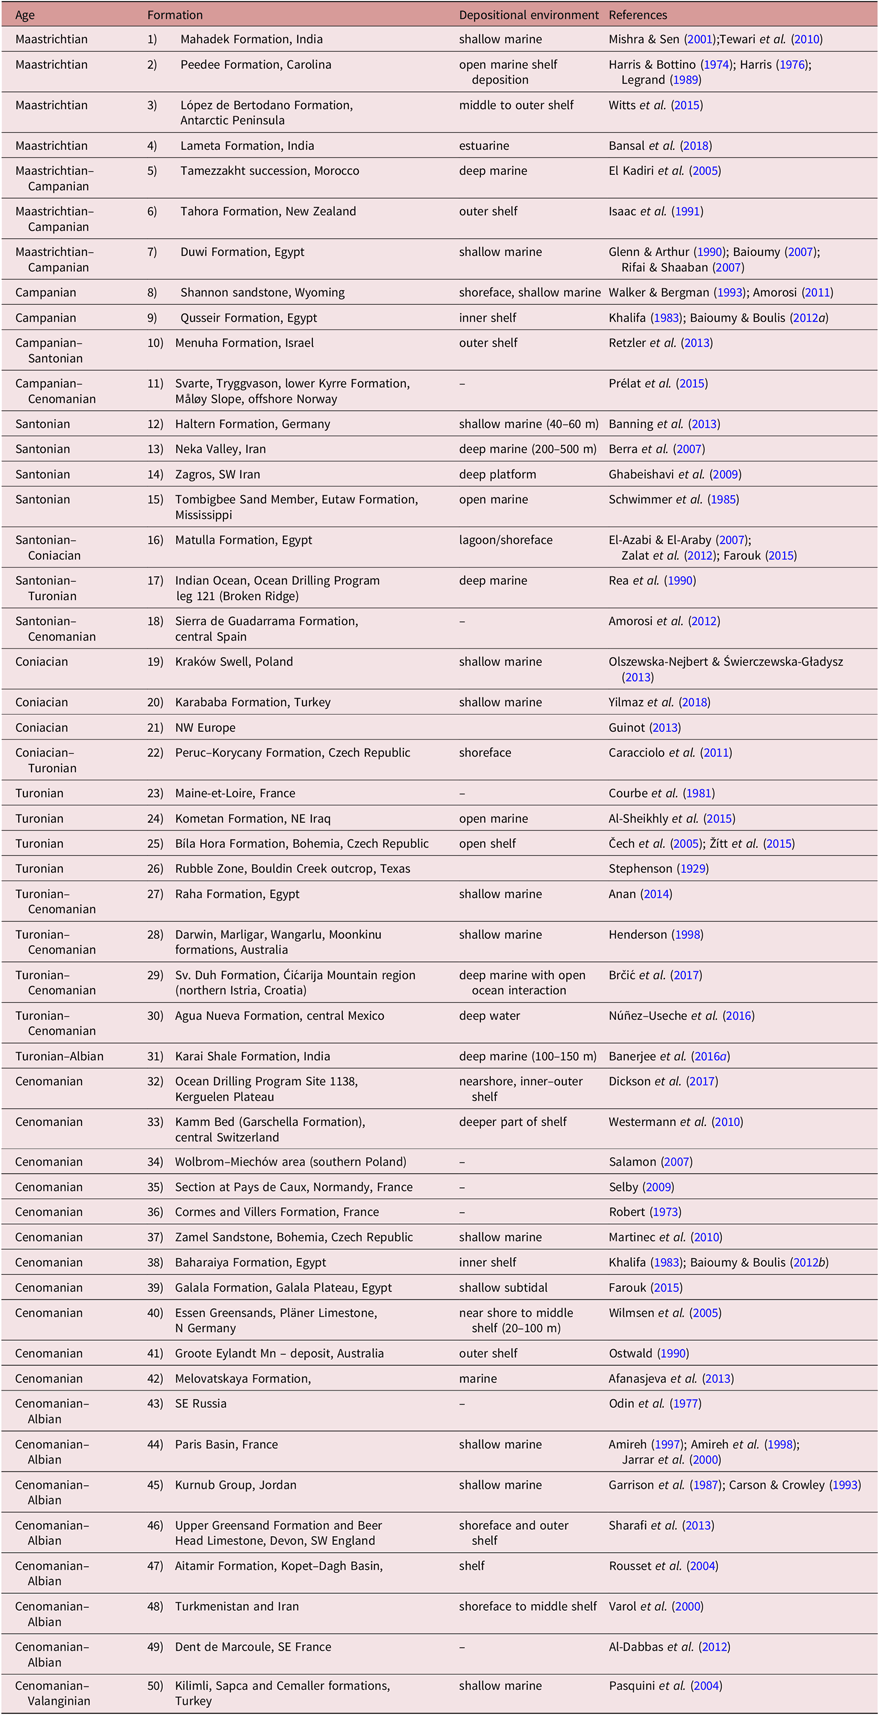
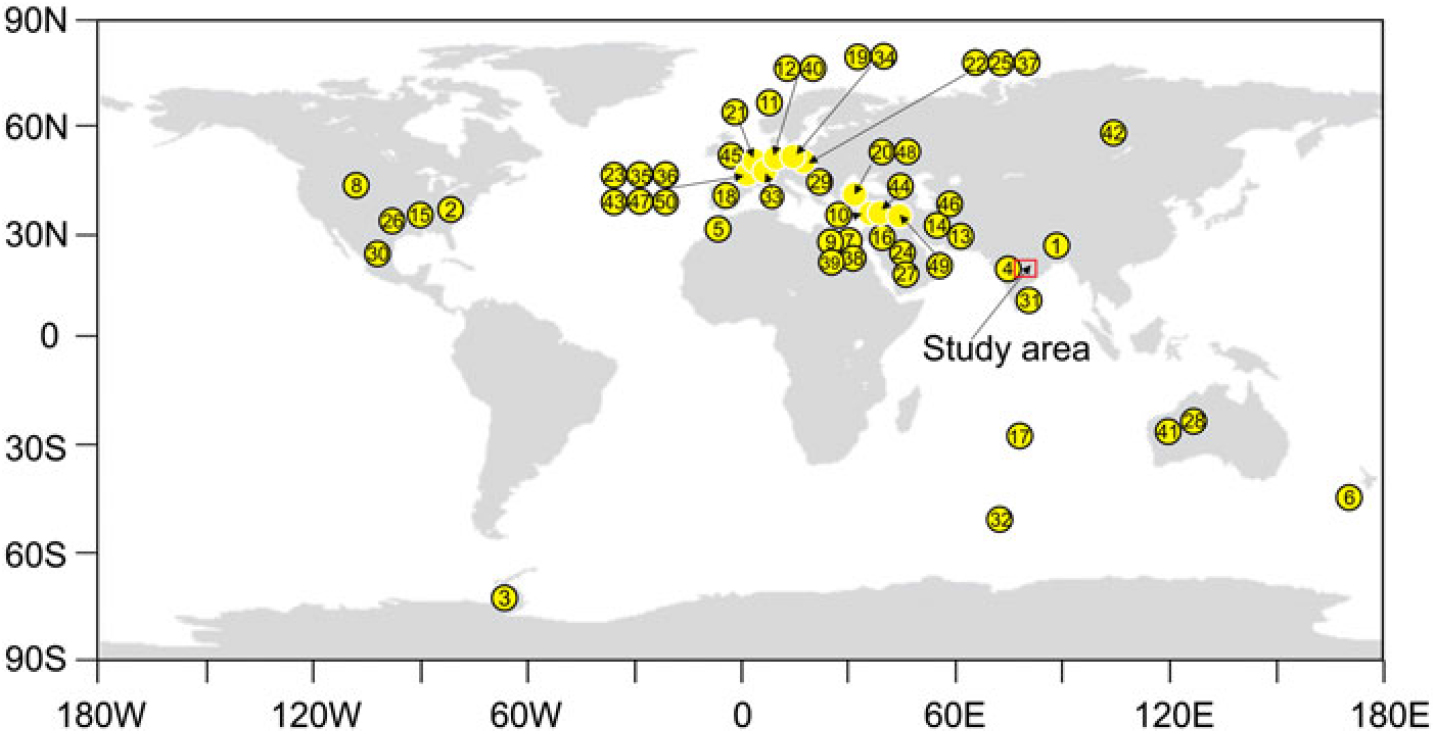
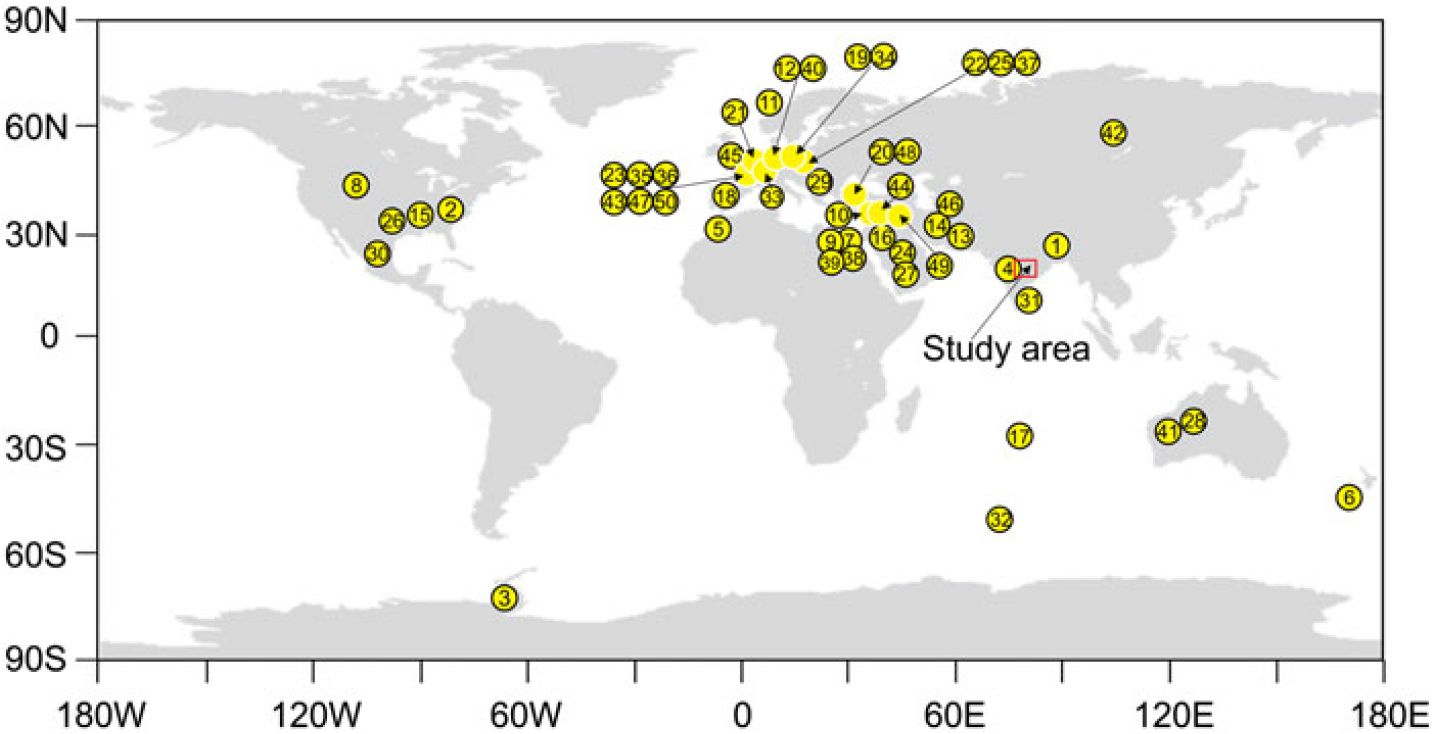
In a recent review, Banerjee et al. (Reference Banerjee, Bansal and Thorat2016b) reported an unusually high abundance of glauconite corresponding to greenhouse climates in the Early Cretaceous, Late Cretaceous and Eocene epochs. This study focuses upon the abundance of glauconite in the Late Cretaceous Epoch and explores possible reasons for it (Fig. 9). Haq (Reference Haq2014) reported consistently high sea level during the Late Cretaceous Epoch, with the highest peak during the Turonian, ~240–250 m above the present-day mean sea level. The Haq curve also displays two ~20 Ma long periods of relatively high and stable sea levels (Aptian through Early Albian and Coniacian through Campanian). Our review suggests that the highest degree of glauconite enrichment occurred during the Cenomanian, followed by Turonian, Coniacian, Campanian and Maastrichtian (Fig. 9; Table 5). The Late Cretaceous glauconites are traced all along the margins of Tethys (Fig. 10). Local conditions such as freshwater input may influence the formation of authigenic glauconite within basins (El Albani et al. Reference El Albani, Meunier and Fürsich2005; Bansal et al. Reference Bansal, Banerjee, Ruidas and Pande2018). However, the widespread occurrence of glauconite across the Tethyan margin suggests broadly similar palaeo-depositional conditions. Most of these Late Cretaceous, Tethyan margin glauconites formed in a shallow marine environment (Garrison et al. Reference Garrison, Kennedy and Palmer1987; Glenn & Arthur, Reference Glenn and Arthur1990; Carson & Crowley, Reference Carson and Crowley1993; Amireh et al. Reference Amireh, Jarrar, Henjes-Kunst and Schneider1998; Pasquini et al. Reference Pasquini, Lualdi and Vercesi2004; Martinec et al. Reference Martinec, Vavro, Scucka and Maslan2010; Tewari et al. Reference Tewari, Lokho, Kumar and Siddaiah2010; Yilmaz et al. Reference Yilmaz, Altiner, Tekin and Ocakoglu2012; Zalat et al. Reference Zalat, Zaid, Gadallah and Abdel–Aziz2012). However, the sharp decline in the abundance of glauconite across the Cretaceous/Tertiary boundary and the shift of its depositional setting to deep marine (Amouric & Parron, Reference Amouric and Parron1985; Parron & Amouric, Reference Parron and Amouric1990) indicates an unusual seawater composition of the Late Cretaceous Tethys. The seawater during the Late Cretaceous Epoch was warm; palaeoclimate was humid with considerably high hydrothermal flux associated with elevated production of mid-oceanic ridges (Hardie, Reference Hardie1966; Demicco et al. Reference Demicco, Lowenstein, Hardie and Spencer2005; Timofeeff et al. Reference Timofeeff, Lowenstein, Da Silva and Harris2006). Lush growth of land vegetation led to increasing nutrient supply, enhanced organic productivity and oxygen depletion on the marine shelf. Enhanced biological productivity induced a sub-oxic depositional condition facilitating the formation of glauconite on shallow shelves (Ozaki & Tajika, Reference Ozaki and Tajika2013). Several studies recorded lateral transition of glauconitic sediments to organic-rich shales in deeper parts of the basin where conditions were anoxic (Parrish et al. Reference Parrish, Droser and Bottjer2001; Bansal et al. Reference Bansal, Pande, Banerjee, Nagendra and Jagadeesan2019). The ‘greenhouse’ condition of the Late Cretaceous Epoch increased the rate of shelf sedimentation and continental weathering. It can be assumed that, in consequence, concentrations of H3SiO4, SO4, Cl, Na, Mg, K, Fe and other ions in seawater were elevated. Experimental investigations suggest abundant supply of K, Fe, Si and Mg favours glauconite formation on the seafloor (Harder, Reference Harder1980). Chafetz & Reid (Reference Chafetz and Reid2000) rejected the requirement of slow rate of sedimentation for glauconite precipitation on the basis of sedimentary structures and textures in the Late Cambrian Morgan Creek Limestone.
Abundance of glauconite within the Upper Cretaceous. Note maximum abundance of glauconite in Cenomanian, followed by Turonian; Coniacian, Campanian and Maastrichtian exhibit similar, moderately abundant glauconite.
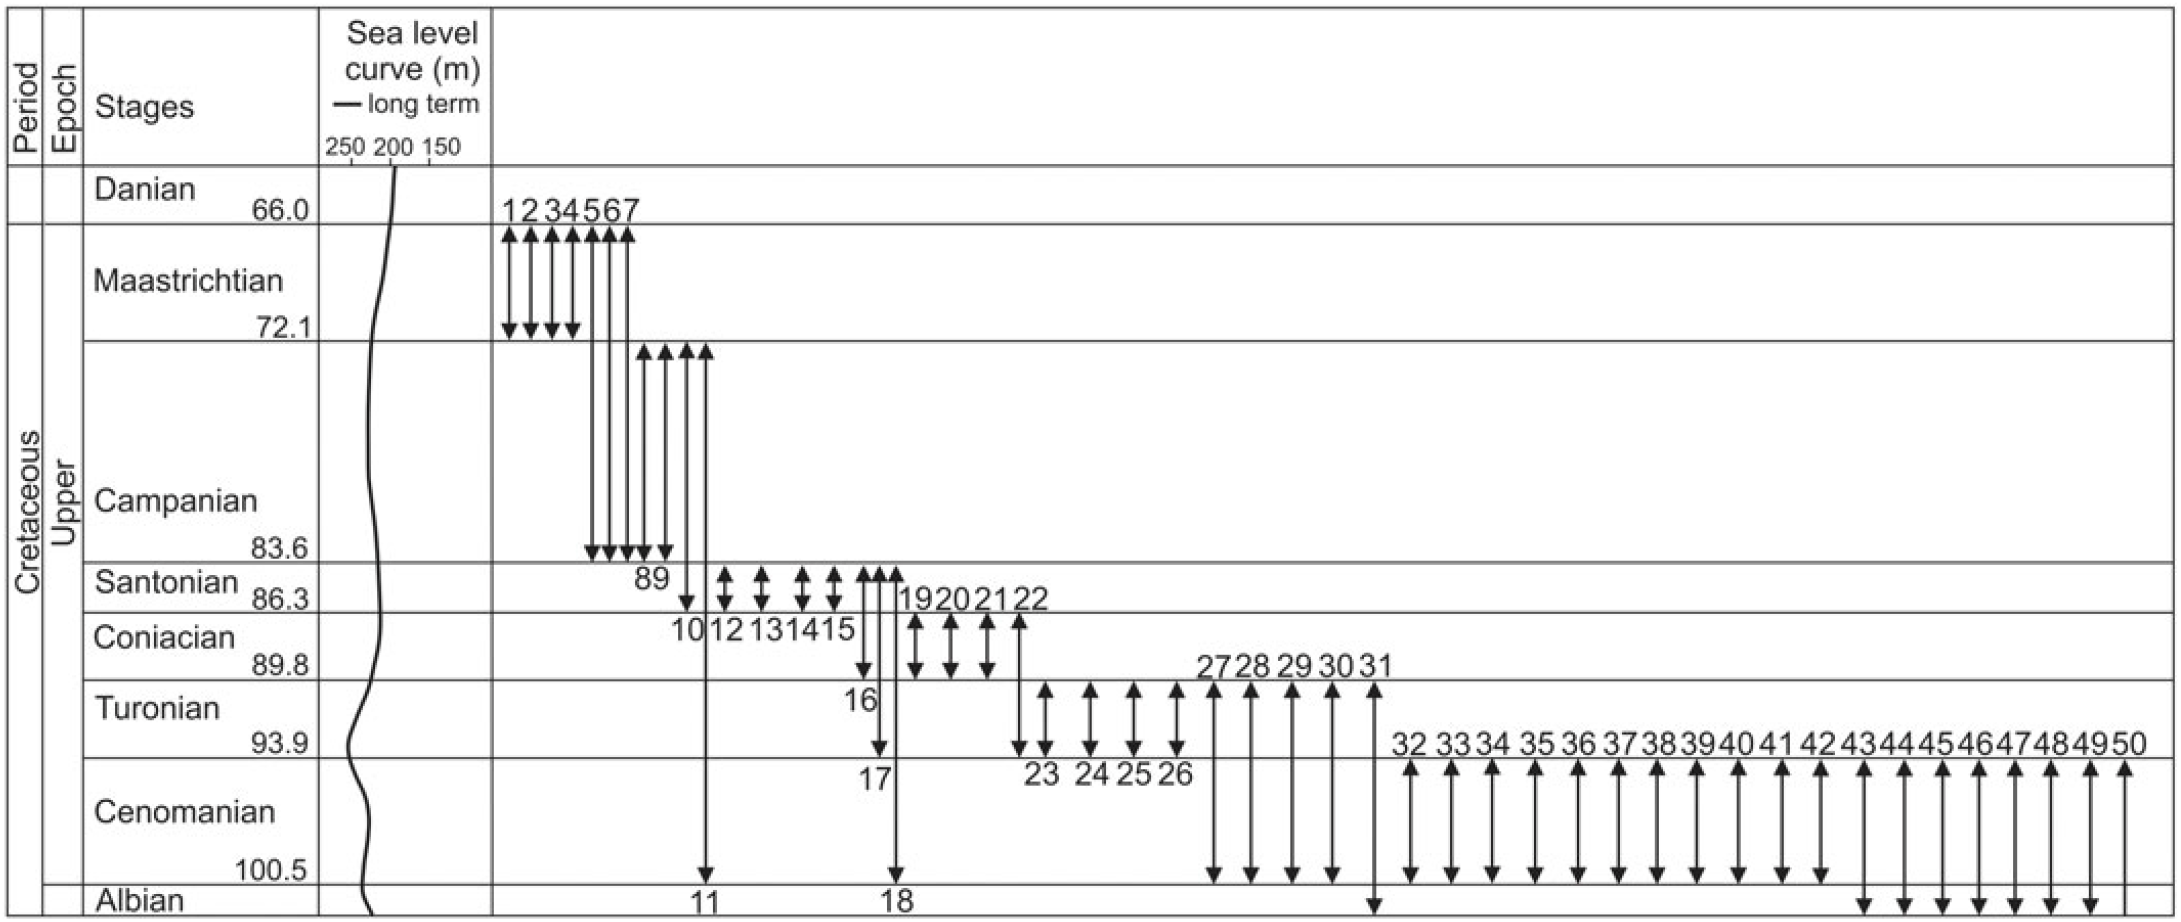
Glauconite occurrences during Late Cretaceous with environmental interpretations
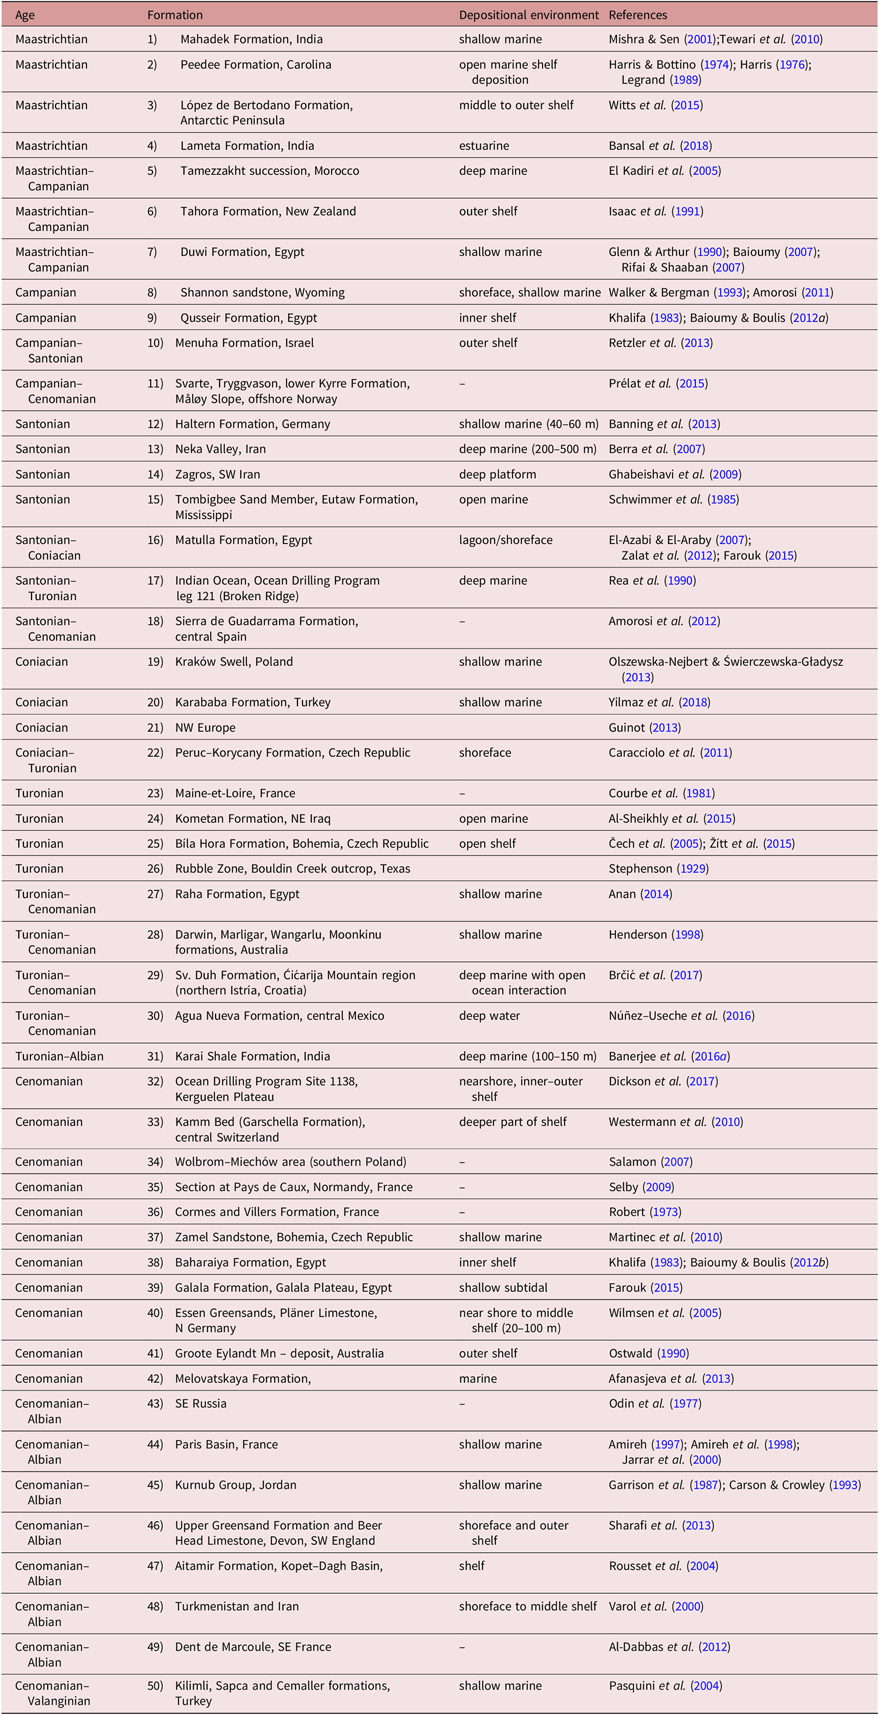
Occurrence of Late Cretaceous glauconite. Note continuity of glauconite abundance across the Tethyan belt (reference number corresponds to that provided in Table 5).
Abundant occurrence of glauconite in the Late Cretaceous shallow shelves, therefore, can be related to the different seawater composition, charged with high concentrations of Na, Mg, K, Fe, Si, Al and Ca and depleted in oxygen. Recently Tang et al. (Reference Tang, Shi, Ma, Jiang, Zhou and Shi2017) suggested a shallow redoxcline for shallow marine Precambrian glauconite. The glauconite within the Late Cretaceous Bryozoan Limestone Formation, therefore, supports the existence of a ‘glauconitic sea’ and attributes its widespread occurrence to unusual seawater composition across the Tethyan belt. The shift of authigenic glauconite from shallow to deep water during the Post-Cretaceous time relates to increased oxygenation (Gale et al. Reference Gale, Rachmilevitch, Reuveni and Volokita2001) in the shallow marine environment.
6. Conclusions
Glauconite formed in a shallow marine environment within the Late Cretaceous Bryozoan Limestone Formation. The Ce anomaly of glauconite confirms the existence of a sub-oxic diagenetic environment that limited the mobility of Fe ions into the glauconite structure. The concentration of Nd indicates a moderate rate of background sedimentation. The seawater possessed a high Al2O3, moderate Fe2O3 and moderately high Mg content. Extensive glauconite formation suggests prevalence of broadly similar chemical constraints all along the Late Cretaceous Tethyan belt. Enhanced organic productivity and elevated concentrations of Mg, K, Fe, Si and Al cations in low oxygenated seawater during the Late Cretaceous greenhouse climate favoured the formation of glauconite.
Author ORCIDs
Santanu Banerjee, 0000-0002-9548-7047
Acknowledgements
The authors thank the Indian Institute of Technology Bombay (IITB) for infrastructure facilities. S.B. is thankful to Ministry of Mines, Government of India, for the financial support through grant F. No. 14/77/2015-Met IV. The authors thank SC Patel and Javed M Shaikh for analysis at the DST–IITB National Facility for EPMA, Department of Earth Sciences, IITB. Authors are thankful to anonymous reviewers for their suggestions on an earlier version of the manuscript.