The almost complete absence of French Canadians among settlers of Western Canada at the end of the nineteenth century is striking. Had there been a substantial flow of francophone internal migrants to the Prairies and the Pacific coast, there would have been a significant francophone presence in 1914, instead of a proportionately shrinking minority in Manitoba, and only scattered pockets of French-speaking settlers elsewhere. This is one of the great might-have-beens of Canadian history. Without much of a base established by the beginning of the twentieth century, there was little possibility for later chain migration of French Canadians to the West. By contrast, migrants from anglophone Canada, the United Kingdom, the United States, and parts of continental Europe, had put networks into place by 1900.
At the time of Confederation (1867), virtually all of Canada's population was located between the Atlantic Ocean and Lake Erie. By the early 1870s, control of all British territory west to the Pacific Ocean had passed to the new dominion, but the European-origin population remained almost entirely in the east. Western settlement, particularly of the Prairies, was very limited until the mid 1890s, and then accelerated rapidly during the Wheat Boom.1
Norrie, “Rate of Settlement.”
In 1871 the total population of western Canada was only about 110,000, by 1891 about 350,000, with those of European origin highly concentrated in Manitoba and British Columbia. The population nearly doubled in the next decade, rising to almost 650,000, and more than doubled (to 1.75 million) between 1901 and 1911.
2 Probably less than 20 percent of the population in western Canada in 1871 was of European origin (Urquhart and Buckley, Historical Statistics, p. 4). Population data from series A2-14.
Westerners were less than 3 percent of the total Canadian population in 1871, almost a quarter in 1911.
Regional divisions in language and ethnicity have had a tremendous impact on a wide range of Canadian institutions, fuelling bitter disputes over language policies, the appropriate degree of centralization of political decision making, and at least since 1960, the desirability of Canada remaining as a single nation-state. As total population increased and its regional composition shifted westward, the political weight of Canada's French Canadian minority diminished. In 1867 Quebec was the only predominantly French-speaking province, but it was one province out of four. From 1905, the year when Alberta and Saskatchewan were separated from the North West Territories, Quebec was still the only predominantly French-speaking province, and it was one province out of nine.3
Manitoba became a province in 1870, British Columbia in 1871.
Despite the establishment of some French Canadian settlements in Manitoba prior to the 1860s, only about 5 percent of the white population of western Canada in 1901 spoke French as their mother tongue. About 15 percent reported another continental European language (mainly German, a Scandinavian language, or Russian). This pattern continued during the great wave of settlement up to 1914. Without a substantial minority of francophone voters in the early 1900s, political institutions in the new provinces of Alberta and Saskatchewan were most unlikely to be designed with the needs of francophones in mind.
Chain migration is often given as a dominant explanation for locational concentrations of migrants of one ethnicity or regional background, but every chain has a beginning. Francophone Canadians were not trapped in Quebec. In response to economic opportunities in the United States, many moved southward in the late nineteenth century, and soon established strong links back to their regions of origin.4
Ramirez, On the Move; and Roby, Franco-Américains.
The Dominion government employed immigration agents to encourage the Canadian-born and their children to come to Western Canada, but few French Canadians moved. Among anglophone Canadian-born men, there were approximately four in the United States in 1900 for every one in the Canadian west, but for francophones, the ratio was about 24 to one.
5 According to the CFP and IPUMS data sets, and Table 1's definitions, there were about 365,000 anglophone and 171,000 francophone Canadian men in the United States in 1900, 84,000 and 7,000 in western Canada in 1901.
Cultural and political considerations are usually advanced to explain why so few French Canadians moved west and so many went south.6
Rumilly, Problème National, p. 19; Lalonde “Intelligentsia,” Silver French-Canadian Idea, especially pp. 131–50; Painchaud, “French-Canadian Historiography”; and Leblanc, “Colonisation.”
Some scholars argue that the federal government deliberately attempted to reduce the influence of French Canadians by favoring European immigrants over francophone migrants. The elite class in Quebec often opposed settlement in the Canadian west, instead encouraging colonization of northern Quebec and Ontario. Negative portrayals of living conditions in Western Canada were coupled with the perception that western anglophones were hostile towards Roman Catholic francophones.
Many of Quebec's elite initially opposed emigration to the United States, where there was no governmental protection or support for their religion or language. By the end of the nineteenth century, clerical opposition towards the southern exodus had waned, partly because French Roman Catholic institutions had been established in most New England destinations. We do not know if French Canadians suffered greater discrimination in the west than in New England. Europeans had good reason for concern about discrimination in the west.7
Lehr, “Peopling the Prairies.”
These immigrants, however, may have felt that they would be outsiders wherever they settled in North America.
In contrast with most of the previous literature, we highlight the economic and demographic factors affecting migration patterns of francophones. Moving to the western frontier was much less economically attractive for francophones than anglophones. The main new source of information we use is the Canadian Families Project sample of the 1901 Census of Canada. This census recorded information on birthplace, mother tongue, language ability, religion, and racial origin. Occupation, and for most wage earners, annual earnings, were also reported. The 1870, 1880, and 1900 IPUMS, and Immigration Commission data collected in 1908/09, allow us to compare how job opportunities in the Canadian west and in the United States were matched with the skills of actual and potential migrants.8
Given data limitations (no information on place of birth within Canada, or religion, for those in the United States, or information on year of movement for internal migrants within Canada), we cannot estimate migration equations relating the probability of living in different regions to personal characteristics.
We argue that given their demographic and human capital characteristics, the option of moving to the United States did little to divert eastern francophones from the west. Most of the French Canadians who went south would have been unlikely to prosper in the west.
THE REGIONAL DISTRIBUTION OF THE MALE LABOR FORCE
At the beginning of the twentieth century, Canadian-born men were widely distributed across North America. Table 1 shows the proportions of working-age men by birthplace or ethnic group living in eastern and western Canada and the northern and western United States.9
The implied total working-age male population of eastern Canada was 1.36 million, of western Canada 0.22 million. Most men of aboriginal and Asian origin lived in the west. Virtually none of these men would have been able to vote.
These figures are derived from the 1901 Canadian manuscript census sample prepared by the Canadian Families Project, and the new 1/200 preliminary IPUMS sample of the U.S. 1900 manuscript census.
10 The CFP project was conducted at the University of Victoria. Five percent of dwellings were randomly selected from each of the 129 reels of microfilm of the manuscript census, and population information was entered for all residents of the sampled dwelling. We eliminated the duplicates that occur because some people owned multiple dwellings, which results in a sample of approximately 262,000 individuals. Most variables in the CFP have been coded to be as comparable as possible to the IPUMS samples, although this is not the case for the occupation variables. Sager, “National Sample”; and Ruggles and Sobek, “Integrated Public Use Microdata.” Unlike the 1901 Census sample used in Green, MacKinnon and Minns, “Dominion,” the CFP sample covers the whole country.
The Canadian census asked for mother tongue, and we use mother tongue French and birthplace anywhere in Canada as our definition of French Canadian. Over 90 percent of white, native-born, non-French Canadians were mother tongue English, and we use the terms “Other Canadian” and “anglophone” interchangeably. The U.S. 1900 census roughly divided “Canadians” (which includes Newfoundlanders) into “English Canadians” and “French Canadians.” For greater compatibility with the 1870 and 1880 IPUMS samples, which do not make this distinction, we used names of family members (both surname and given name) to distinguish “French” and “other” Canadians.
11 Where the surname was clearly French, or a direct English translation of a French name (e.g., Short Sleeve for Courtemanche), we considered the person French. Where the surname was not French, but at least one member of the family had a French given name, we classified the family as French. For 1900, 79 percent of those we classed as French, the census recorded as born in French Canada, 13 percent in English Canada. Seventy-two percent of those we considered as non-French Canadians were recorded as born in English Canada, 7 percent in French Canada. (Most of the rest were simply listed as born in Canada.) Non-French-speaking census enumerators likely found it hard to record French names, and at the stage of data entry into the IPUMS sample, coders likely also found it hard to decipher French names. We have tended to assign people to the French category if their surnames appear to have been mangled in the enumeration or transcription process, or if their name appears to be a phonetic rendering of a French name. For example, “Bushey” is likely “Boucher.”
About 30 percent of working-age Canadian men lived in the United States. For anglophones, average annual earnings by occupational category in U.S. urban areas were only about 10–15 percent above those in urban Canada, but the number of job openings in the United States was far greater.12
Green, MacKinnon, and Minns, “Dominion.”
Similar proportions of anglophone and francophone Canadian men were in the United States; French Canadians were much more heavily concentrated in New England.
Approximately 15 percent of anglophone Canadian men were in western North America, but only about 5 percent of French Canadians.13
All of the states defined as Northwestern became states between 1858 and 1896, and we think they were the closest substitutes for the Canadian west. On the whole, the states we define as Northwestern were the states from which a substantial number of homesteaders came in 1899 (Percy and Woroby, “American Homesteaders,” p. 81). Almost no Canadians lived in the southern United States, so we do not show information for that region.
If the proportion of French Canadian men in the Canadian west had been as high as that for Other Canadians (7 percent), and further assuming no displacement effect of this counterfactual movement, the francophone proportion of the western population would have been roughly 20 percent, similar to the proportion living in New Brunswick. Today, New Brunswick is Canada's only officially bilingual province. We think it is plausible to argue that a 20-percent francophone voting minority in the west would, in at least some provinces, have ensured the provision of public services in French.
Central and Eastern European immigrants were much less likely to be in the west than Germans and Scandinavians, but if they were in the west, were more often in Canada.14
We ignore immigrants from all of southern Europe and the parts of western Europe from which there were few immigrants living in the Canadian west in 1901.
By 1900 there were far more Germans, Scandinavians, and Central and Eastern Europeans in North America than there were French Canadians, so even a small flow to the Canadian west resulted in substantial pockets of European mother tongue men.
Table 1 does not suggest that Western Canada was an attractive destination for many of the European born. However, given the large European-born population base, modest migration rates meant that there were roughly four working-age men from Europe living in the Canadian west for every Canadian francophone.
In both the United States and Canadian west, men were very likely to be farmers, and this was particularly true for non-English mother tongue men in the Canadian west. In the eastern United States, by contrast, few Canadian men worked in the primary sector.15
In 1910, for the United States as a whole, only about 16 percent of the French Canadian and 22 percent of Other Canadian men reporting a gainful occupation worked in agriculture, fishing, forestry, or mining (Truesdell, Canadian Born, p. 206).
Anglophones held almost all the white-collar jobs in both wests.
The francophone proportion of Canadians in the United States was increasing towards the end of the century. According to the IPUMS samples, as of 1870, roughly 20 percent of working-age Canadian men in the United States were francophone, over 30 percent by 1900.16
Paquet and Smith, “Émigration,” p. 446, suggest that the net emigration of French Canadians rose from 120,000 during the decade of the 1870s to 195,000 during the 1890s. According to the IPUMS sample, there were fewer than 200,000 Canadian-born men in the Northern and Western states in 1870.
This trend is consistent with the idea that for francophones, the south always dominated the western Canadian option, whereas the Canadian west became a popular choice for Other Canadians from the 1880s onward. However, even if all the Canadian men in the Canadian west in 1900 had lived in the United States instead, the proportion of francophones among U.S.-based Canadians would still have been 28 percent.
COSTS AND BENEFITS OF MIGRATION WITHIN NORTH AMERICA
A gravity model provides one way of thinking about the settlement patterns of various ethnic groups, with higher income and closer locations being more attractive to potential migrants. Richard Vedder and Lowell Galloway estimated such models to explain the locational pattern of Canadian settlement in the United States.17
Vedder and Gallaway, “Settlement Patterns.”
One major problem with their approach is that there is no information on the birthplace within Canada for the vast majority of Canadians enumerated in the U.S. census. In any case, distance between birthplace and place of residence may be a poor proxy for out-of-pocket travel costs. As we show in this section, travel costs from eastern Canada to the northern United States and to the Canadian west were highly variable by season and route, and fares from a broad set of origins, or to a broad set of destinations, were often virtually identical.
In a human capital model of migration, a relocation decision depends on the benefits and costs of the move.18
Sjaastad, “Costs and Returns.”
The main measurable benefit is better labor market opportunities in the destination. These opportunities probably improve, the greater the number (or proportion) of the inhabitants in the receiving region who are of the same ethnic group as the potential migrant. Information about labor market opportunities is likely better, and minority language skills more useful. In the Canadian west of the 1890s, total population and population density were low. The settlement of fairly small numbers of immigrants in an area could substantially alter its ethnic composition and attractiveness for later migrants. Thus we see less role for chain migration as a determinant of migration to western Canada in the 1880s and 1890s than in the years of peak migration around 1910.
Although the human capital model of migration is often formulated for an individual, some families moved together, or in a planned series of subgroups. Bigger families faced higher transport costs, and employment opportunities for secondary earners varied by location. The possibility of borrowing to finance a move was limited, so for capital-constrained families, moving costs probably increased nonlinearly. Thus demographic differences across ethnic groups affect the probability of moving, and the choice of location if a move is undertaken. We start with the decision of a man moving by himself, and then broaden our investigation to consider how the addition of other family members affected the costs and benefits of locating in the west.
Differences in returns between source and destination labor markets reflect the relative scarcity of various types of labor, and variations in the extent of discrimination. A second reason why we think that a human capital approach will be more useful in explaining settlement patterns than a gravity model is that the former allows returns to vary by skill level. George Borjas outlined a theoretical framework explaining how differences in the dispersion of earnings between source and host regions determine the part of the earnings distribution in the source region from which migrants will come.19
Borjas, “Self-Selection.”
If earnings were no higher in the west than in the east for occupations that were disproportionately French Canadian in eastern Canada, French Canadians had little incentive to migrate.
Were the returns to western migration lower for French Canadians? As we explain in what follows, francophones typically had less education than anglophones. Although we often think of formal education as largely irrelevant for people on the frontier, those without basic literacy probably had poorer information about swiftly changing job opportunities. As we show below, white-collar, presumably fairly well-educated, workers were well paid in the west.
Unilingual francophones would have been unable to hold a wide range of jobs in the west. A modest command of English was quite adequate for a hotel-keeper in Rivière du Loup, but not Regina. A railway worker in Montreal had a francophone, or at least bilingual, foreman. This was unlikely in Winnipeg. As we will show, the penalty for being a unilingual francophone was higher in the west than in Quebec, and it may have been higher than for a cotton mill worker in New England. By the 1880s it was possible to get by without speaking English in towns such as Woonsocket (Rhode Island) or Fall River (Massachusetts). For virtually all jobs outside farming, workers in the west needed to interact regularly with non-French speakers, as roughly two-thirds of the adult population of the west were English mother-tongue. Only with the development of a set of mainly French-speaking communities would it have been possible for unilingual migrants to thrive in the west.
Lack of English-language skills should have been at least as much of a barrier for European immigrants as for French Canadians. There were no substantial areas in late-nineteenth-century Canada where a European immigrant speaking neither English nor French could prosper in an occupation where interactions with a broad range of people were needed. In the United States, by contrast, there were many communities with high concentrations of immigrants of one language group.
The costs of migration in this period were mainly transportation costs, rather than earnings forgone during the move. Even the slowest trains took only about a week to reach Winnipeg from eastern Canada, two weeks to reach Vancouver. For migrant Europeans, time, as well as travel, costs, were greater.
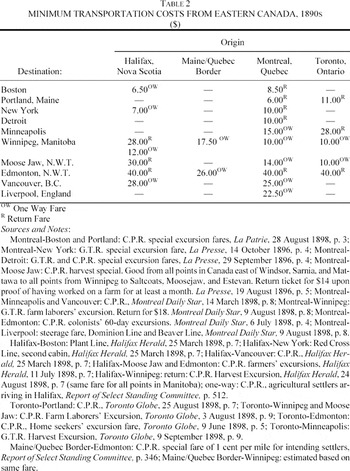
The pattern of travel costs does little to explain the outcomes seen in Table 1. Table 2 shows the lowest advertised fares we could find for the late 1890s.20
There was a passenger rate war in North America in 1898, which explains the very low fare to Vancouver then available.
Fares to Winnipeg from Halifax, Montreal, and Toronto were almost identical, and probably about twice the cost of travel to the northeastern United States. The trips to the Prairies were mostly special excursions for harvesters and those considering purchasing farmland, and were normally advertised as return fares.
21 Harvesters returned before winter set in, and intending colonists moved west the following spring.
The advertised fares for travel within eastern North America were generally for round-trip holiday excursions. However, we presume that one-way tickets at half to two-thirds of the advertised fares could be purchased.
22 Contemporaries commented on nonagricultural workers who took the harvest trains and then stayed on in urban areas. Thompson, “Bringing in the Sheaves,” pp. 487–88.
The bargain fares implied slower trains, more uncomfortable coaches, greater crowding, and travel restricted to certain times of year.
23 The CPR, Settlers' Index, listed much higher standard second-class passenger fares for trains leaving in the early spring: $21 to Winnipeg, $37.20 to Calgary, $41.05 to Edmonton. These rates, good from all points in Ontario, included generous baggage allowances. In 1886 the lowest priced tickets from New England to Winnipeg cost $36. Minister of Agriculture, Annual Report, 1887, p. 157.
Per person travel costs to the west could have been much higher for families, as the harvest excursion trains, at least, were only for single men. French Canadians married younger and had more children than other Canadians.24
McInnis, “Population,” pp. 408–09. In the CFP sample, 36 percent of the French origin population living in eastern Canada in 1901 were aged less than 13, 27 percent for the British/Irish origin. Here we use reported “racial” origin to separate francophones and anglophones, because mother tongue was rarely reported for children under the age of five.
To the extent that families wanted to move west, French Canadians faced higher total costs than English Canadians. Travel costs to the U.S. northeast, even for large families, were modest, so it seems doubtful that lack of cash stopped potential emigrants from moving.
25 Manufacturers sometimes advanced travel costs for families from Quebec. Massachusetts Bureau of the Statistics of Labor, Report, p. 63.
As we show in more detail later, the typical francophone man in eastern Canada had lower earnings than the typical anglophone. For all men in the east (aged 18–65) reporting positive annual earnings in the CFP sample (mainly wage-earners), the medians were $300 and $350 respectively (not adjusted for regional differences in prices).26
Virtually no farmers reported their income in the census, as they were not wage earners. Quebec farms were much less productive than Ontario farms. In 1891 average Gross Value Added per worker in agriculture in Quebec was two-thirds the Ontario level (Green, Regional Aspects, pp. 85, 104).
Given the lower incomes and the greater number of dependents per adult male, francophones must typically have had fewer assets. They certainly had much less opportunity to put their savings into banks. In the late nineteenth century there were far fewer bank branches in Quebec than in any other province, and within Quebec, predominantly French-speaking areas were least likely to have a bank branch.
27 Rudin, Banking en français, pp. 7–21. In 1891 there were over 22 thousand Quebecers per branch, 9 thousand Ontarians. The national average was 12 thousand people per branch (p. 8).
If the reason for the move to the west was to establish a farm, prospective settlers had to bring capital with them, or work for wages and build up their savings. If poverty stopped some French Canadian families from buying train tickets, it would have stopped many more from becoming western farmers.
LITERACY AND LOCATION
Francophone and anglophone Canadians differed dramatically in one of the few measurable human capital characteristics, their ability to read and write.28
The self-reported ability to both read and write (in any language) is our measure of literacy. Greer, “Pattern of Literacy”; and Ouellet “Démographie,” examine francophone schooling.
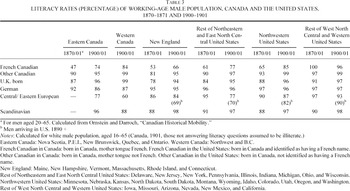
In 1871 only about half of French Canadian men in Canada were literate, whereas 90 percent of other Canadian men said they could read and write (
Table 3).
29 This question was asked only of those over 20.
French Canadian men in Canada were also much less literate than European immigrants in the United States. The French Canadians in the United States were at least as literate as those still in eastern Canada, with higher rates for those locating away from New England. Illiterate anglophone Canadian and U.K. immigrants were also concentrated in New England.
By 1901 literacy rates of Canadian francophones had shot up.30
For 1901 we classify those who did not answer the literacy questions as illiterate. Most men who did not answer were non-English mother tongue. If we exclude observations without answers to the literacy questions, 83 and 89 percent of male French Canadians, and 78 and 69 percent of Eastern Europeans, were literate.
The emigrant French Canadians in New England, however, showed far less improvement. The evidence on literacy suggests that in 1870 the emigrant francophone was quite possibly an average French Canadian; by 1900 there is a clear implication that French Canadian emigrants had less human capital than the average in the sending population.
31 Inwood and Irwin, “Emigration,” stress that French Canadian migrants who moved to the United States after age 15 were more often illiterate than were child migrants.
French Canadian men in New England had literacy rates similar to those of recent immigrants from central and Eastern Europe.
Most men in the Canadian and U.S. west around 1900 were literate, with the lowest rates for central and eastern Europeans in Canada. The second main message we take from Table 3 is that the North American west was generally not an attractive destination for those unable to read and write.
THE STRUCTURE OF THE CANADIAN LABOR MARKET, 1901
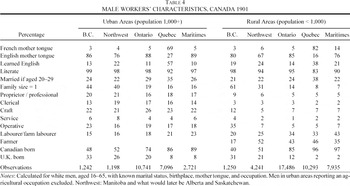
How different were western Canadian from eastern Canadian labor markets? The Canadian Families Project sample allows us to compare the demographic and occupational profiles of male workers across the country (Table 4). Immigrants made up about half of the male labor force in the west. Marriage rates were lower in the urban west, and a much larger share of the population lived in one-person family units.32
In Table 4 “married” means married with spouse present. Many men with family size of one were boarders in larger households. Despite the very different concentrations of immigrants and native-born men, average age was about 35 in all ten areas.
This was particularly true for British Columbia, where many worked in mining and logging occupations. In both town and country, more young Quebecers were married. With some exception for Quebec, almost all men in urban areas were literate and spoke English. Illiteracy was more common in rural areas, especially in Quebec and to some extent in the Maritimes, and many Quebec francophones did not speak English.
More men in the west were at the upper end of the occupational scale. In urban areas, there were more proprietors and professionals, and fewer laborers.33
Burley, “Frontier of Opportunity,” pp. 46, 55, notes that the proportion of businessmen in the male labor force of Winnipeg was at its peak in the 1880s. We base occupational categories on Edwards, Alphabetical Index.
There were far fewer laborers (both farm and nonfarm) in rural areas. In British Columbia, there was a high concentration of operatives (many of these were miners).
In the west, at least half of all adult male francophones, and those whose mother tongue was neither English nor French, worked in the agricultural sector as either farmers or farm workers. For men of English mother tongue, the proportion was below 40 percent. This suggests that men who were likely to lack English language skills flocked to occupations where difficulty speaking English was a fairly minor handicap.
Descriptions of French Canadian western settlement are consistent with the quantitative patterns revealed in the 1901 census. In New England, Roman Catholic institutions followed migrants to the towns they settled in; in the Canadian west, a small group of clerics played a leading role in establishing agricultural settlements. The earliest settlements were by the Red River in southern Manitoba, with later colonies in what would become Alberta and Saskatchewan. This is largely where we find French Canadians in 1901: they were less likely than Other Canadians to live in British Columbia or in the towns of the Northwest.
The Canadian Census of 1901 was the first to ask employees to report annual earnings. Thus for most employees, and some employers and own-account workers, we can relate earnings and personal characteristics. We use evidence on the cost of room and board and clothing costs in rural and urban areas to develop regional cost of living estimates.34
Green, MacKinnon, and Minns, “Earnings Gaps.” For urban areas, our estimates are broadly similar to those reported by Emery and Levitt, “Cost of Living.” Price levels were highest in B.C. and the Northwest, lowest in the Maritimes. Rural prices were 10–20 percent lower than urban prices in each region.
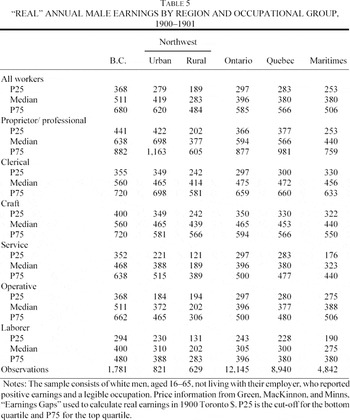
summarizes the median, and top and bottom quartile cutoff points, in the distribution of annual earnings for adult men who reported earnings. For the Northwest, we show estimates of rural and urban real earnings separately. The 1900 harvest in western Canada was exceptionally poor, due to very low rainfall. Many men in the rural Northwest would have worked fewer months, for lower pay, than in previous years.
35 In December 1900 the Winnipeg Labour Gazette correspondent noted that the poor harvest was causing “an unusually good class of workmen” to take jobs in lumber camps (p. 150).
After adjusting for the higher cost of living in the west, median real earnings in the rural Northwest were much lower, and in the urban Northwest only slightly higher, than in Ontario. The distribution of earnings was wider in the Northwest, so that earnings at the seventy-fifth percentile were higher in the urban Northwest than in Ontario, and substantially higher than in Quebec or the Maritimes. British Columbia showed higher real earnings across the distribution.
The 1900 U.S. Population Census did not ask respondents about their earnings, but the U.S. Census of Manufactures collected information about total wage payments and numbers of employees. Assuming that regional patterns of real earnings for male manufacturing workers were similar to those for all male wage-earners in the United States, high real earnings in the far west, and roughly equal average earnings east of the Rockies were common to both the United States and Canada.36
Rosenbloom, “Was There a National Labor Market,” p. 635. We assume that New England and the East North Central States are similar to Quebec and Ontario, the West North Central to the Northwest, and the West to British Columbia. Rosenbloom's results always show real annual earnings in the West North Central region slightly above those in the eastern states, and a more modest real earnings premium for the U.S. West than we see for B.C.
As noted earlier, Borjas's adaptation of the Roy model points to differences in the return to skill across regions as being critical in understanding which individuals migrate.
Table 5 shows earnings for six broad categories of occupations. Earnings in British Columbia were relatively high in all types of occupations, although the advantage was less pronounced in the top occupational category.
At the top of the occupational ladder, men in the urban Northwest were usually very well paid. Although median real earnings for clerical and craft workers in the Northwest were below B.C. levels, they were similar to those reported in the east. Less-skilled workers in the rural Northwest were conspicuously poorly paid.37
In October 1900 (p. 50), the Labour Gazette's Winnipeg correspondent commented on the low real wages for “ordinary manual labour.”
There are two main reasons why unskilled men may have done worse in the Northwest than in B.C. It was fairly cheap to travel to and from Winnipeg, with low-skilled workers readily going there for the harvest. Such temporary members of the western labor force would not have been enumerated in the West in April 1901, but their presence each summer eliminated labor shortages. The negative effects of 1900's poor harvest were also probably particularly severe for less skilled workers in rural areas.
Table 5 suggests that migration to the urban Northwest was often profitable for high-skilled individuals at the upper tail of the income distribution, but that there was little incentive for low-skilled Eastern Canadians to move there.38
Men working in the Northwest were less likely to be laborers than men in any other Canadian region. Thus it seems unlikely that many low-skilled men had moved west in response to small earnings gaps, and stayed there to work in low-skilled jobs.
Labor markets in British Columbia offered large earnings premia for most workers. The conditions of pioneer life in mining, lumber, and railroad construction camps were, however, unattractive for married men who wanted to live with their families. The earlier age at marriage among French Canadians likely reduced the supply of potential low-skilled migrants to B.C. In addition, it appears that a good command of English was an important asset. As
Table 4 shows, white men in B.C. were much more likely to be English mother tongue than were men in the Northwest.
FRANCOPHONE EARNINGS IN CANADA AND THE NORTHERN UNITED STATES
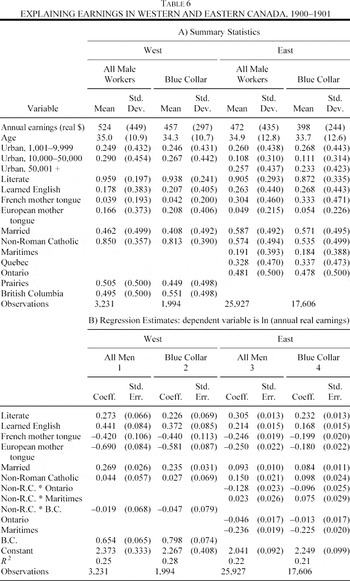
We have implicitly been assuming that all across Canada, francophones would have been able to earn about the same amount as nonfrancophones. To investigate the extent of, and regional variation in, earnings gaps for francophones, and the returns to language and literacy, we estimate standard human capital earnings regressions. Table 6, panel A) shows means and standard deviations for the variables used in the regression models. Table 6, panel B) shows estimated coefficients for key variables. Francophone men in the west, if they were literate and spoke English, had no clear earnings disadvantage relative to anglophones, and generally earned more than men of European mother tongues.39
For the models estimated in columns 1 and 2, we cannot reject the hypothesis that the sum of the coefficients on the learned English and French mother tongue variables is zero. The same results for francophones relative to anglophones are found when we look only at native-born Canadians.
Clearly, literacy and ability to speak English were important characteristics for western workers, with the ability to speak English more highly rewarded than in eastern Canada. This finding is plausible, as in much of Quebec, knowing how to speak English probably had little impact on earnings capacity. Although the estimated coefficients are smaller when the models are estimated for blue-collar workers only, they are still substantial.
40 When we include dummy variables for months worked, marriage premia decline, but other coefficients are largely unaffected. Omitting observations where the literacy questions were not answered, rather than treating them as illiterates, has no effect.
Many anglophones in the west opposed the extension or maintenance of French and Roman Catholic institutions in the newly settled territories.41
Friesen, Canadian Prairies, p. 259.
In Quebec and the Maritimes, non-Roman Catholics earned more than Roman Catholics, but in the west we find no clear effect of religion on earnings. This evidence suggests there is no reason to believe that Roman Catholics faced greater labor market discrimination in the west than in the east.
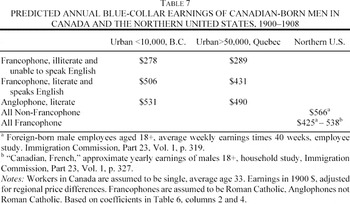
In Table 7, we use the coefficient estimates in Table 6 to compute predicted annual earnings in eastern and western Canada for men with different levels of human capital. These estimates strongly suggest that illiterate, unilingual francophones had no incentive to move west. Their predicted earnings in urban B.C. were even lower than their predicted earnings in urban Quebec.
Estimates of industrial workers' earnings in the United States are also shown in Table 7. The best source of information on the earnings of French Canadians in the United States comes from the Immigration Commission, which collected weekly earnings data from over 8,000 French Canadian men working in industry in early 1909.42
Roughly a thousand more men (mainly youths aged 14 to 17) provided information on literacy and ability to speak English. With 80 percent reporting they could read and write, the industrial employees were better educated than the average French Canadian man in the United States in 1900. The employees in their twenties surveyed by the Immigration Commission were also more likely to be married than the men of the same age in the IPUMS. Proportions reporting they could speak English were similar, at about 80 percent in both samples. Immigration Commission, Part 23, Vol. 1, p. 365 (marital status), Vol. 2, p. 594 (literacy), 1368 (ability to speak English).
Assuming that these men worked 40 weeks in the year yields our lower estimate of earnings. The Immigration Commission also surveyed a limited number of households. We use the estimated mean annual earnings for the French Canadian men in the household study as our higher estimate. 1909 earnings were almost certainly higher than 1900 earnings, and prices in the United States may have been a little higher than in Canada. Any plausible allowance for these factors still leaves us with the strong impression that for many bluecollar francophone men, moving to New England was financially far more appealing than moving to western Canada.
43 French Canadian men in the Immigration Commission sample were much more likely to be bilingual than men in eastern Canada, only about 60 percent of whom reported that they spoke English. Bilingual migrants probably were better-paid, so this also raises the Immigration Commission earnings estimates relative to the sum a typical French Canadian could have earned had he moved to the United States in 1900.
ADDING THE FAMILY
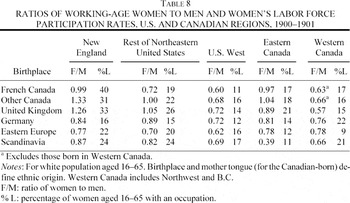
Table 4 showed that men in the Canadian west were much more likely to be living without relatives than men elsewhere in Canada. Table 8 shows a quite different gender balance for migrants to the eastern United States from that for migrants to the Canadian or U.S. west. Across the North American west, there were many fewer women than men.
The migrant Europeans had the highest ratios of women to men in the Canadian west. Many of the earliest Galician (Ukrainians from the Austrian province of Galicia) migrants to Canada were (by the standards of the sending population) fairly prosperous farmers, who were able to travel as families and to establish homesteads immediately. Estimated costs of travel from Austria to western Canada in the late 1890s range up to about $100 per adult, far above the cost of moving from eastern North America to the west.44
As Galician migration to Canada accelerated in the early 1900s, the flow of single, unskilled, males increased. Martynowych, Ukrainians, pp. 66 and 109. Journey time from Europe to the Canadian Prairies was about three weeks. In 1900 estimated travel costs, excluding board, from Galicia to Winnipeg were about $55 per adult. Report of the Select Standing Committee, pp. 528–29.
Traditionally, and in Canada until at least the 1920s, Galician women worked in the fields, which raised their value as producers on pioneer farms.
45 Most Galician farmers homesteaded in the more northern areas of the Prairies, where timber and fresh water were readily available. Galician farm families made more for home consumption than did farmers in the main wheat-growing areas further south, presumably in response to their different family structure and more limited capital. (Martynowych, Ukrainians, pp. 70–75, 78–83; Lehr, “Peopling the Prairies”; and Darlington, “Ukrainian Impress.”)
In the CFP sample, Eastern European farming families had a substantially higher ratio of adult women to men than did farming families of other ethnic backgrounds, which is consistent with the claim that Eastern European women were more actively involved in farm work.
46 Including all household members where the head had an agricultural occupation (farmers of all types, plus farm workers), for those of Eastern European racial origin, the ratio of women aged 16–70 to men was 0.77. For those of British/Irish racial origin, the ratio was 0.6, and for those of French origin, the ratio was 0.66.
For virtually every group of migrants, the ratio of women to men was at its highest in New England.47
For the English-speaking, ratios were well above one, which is consistent with observations of many single women moving there (Beattie, Obligation).
For most groups, women's labor force participation rates were also highest there. Manufacturing employment was, and long had been, an important source of work for women in New England. Even women who spoke no English could earn relatively good pay in the manufacturing sector. French Canadian women were employed in large numbers in the textile mills.
48 Goldin and Sokoloff, “Women,” p. 768; and Goldin, Understanding the Gender Gap, p. 64. Some English mother-tongue migrant women worked in blue-collar occupations, but many were in the service sector.
French Canadian women in New England had a higher labor force participation rate than did any other group.
49 Other Canadian men in the United States were much more likely to be white-collar workers or farmers. With higher incomes, earnings by wives and daughters would have been less important. In New England, almost 90 percent of unmarried French Canadian women 16–24, and about two-thirds of Other Canadians, reported an occupation. Among both French and Other Canadians in eastern Canada, about 30 percent of this group reported working in 1901.
Only for French Canadian men do we see a strong positive connection between the ratio of women to men and the regional concentration of men. For other immigrant groups, as Table 1 shows, the rest of the North East generally was the main location, and the U.S. West, where there were markedly fewer women than men, was typically at least as popular a destination for men as New England.
A sense of the relative importance of women's earnings for French Canadian and Eastern European families in the northern United States can be derived from the Immigration Commission's study of employees. The reported weekly earnings of French Canadian women (over age 18) were 78 percent of men's earnings, whereas for Poles, Russians, and Ruthenians, women's earnings were at most two-thirds the male level.50
Immigration Commission, Part 23, vol. I, pp. 318–21.
Most of the high-wage industries for men, such as iron and steel manufacturing, mining, and agricultural implement making, were located away from New England, and offered few jobs for women. The cost of moving to any part of the northeastern United States was far lower for French Canadians than for Eastern Europeans. French Canadian families often moved together, and New England offered good employment prospects for young women and teenage boys. Eastern European men were much more likely to move to the United States by themselves, so that considerations of employment possibilities for their children would have been less important.
FROM THE NORTHERN STATES TO THE CANADIAN WEST?
The Dominion government encouraged emigrant Canadians to move on to western Canada, with some success in the case of anglophone farmers, but far less among francophones. The repatriation agents in New England (usually Roman Catholic priests) blamed ignorance of western conditions and high travel costs for keeping French Canadians away from the Northwest. The occupational distribution of Canadian men in the United States also explains their limited success. Western Canada offered good opportunities for workers in the primary sector, but only 20 percent of the French Canadian men in the United States in 1880 were farmers, farm laborers, miners, or forestry workers, whereas about a third of Other Canadian men worked in these occupations. Western Canada was also a promising destination for a range of professionals and white-collar workers—again, French Canadians in the United States were rarely in these occupations.
The repatriation agents, who thought of emigration as a “national plague,” imagined that many New England francophones longed to take up farming in the west, because “those children raised amid the pure air of the country soon emaciate in the impure atmosphere of the manufactories.” Emigrants who had learned how to be factory workers were unlikely to move west, even if they had adequate capital. About a third of the working age francophone men in the United States in 1900 had moved there before age 14 and so probably had never acquired farm skills.51
Department of Agriculture, Annual Report, 1889, p. 165. Saxonhouse and Wright, “Two Forms of Cheap Labor,” p. 13, argue that in the U.S. south in the early twentieth century men who worked in cotton mills as adolescents and up to about age 25 were unlikely to move away to other industries. If this pattern held for French Canadians in New England, relocation to a western Canadian farm would have been a rare choice.
In the 1890s, when western settlement was on an upswing, the French Canadians moving to the United States had personal characteristics quite unlike those of the few French Canadians we find in the west. About 30 percent of French Canadian men in the northeastern United States in 1900 who had moved there since 1890 did not speak English, and only two-thirds could read and write. The Immigration Commission data from 1908 paint a similar picture. Only 45 percent of the men in the United States for less than five years spoke English.52
Immigration Commission sample of employees, born in Canada, of French Canadian race. Information for all males over 14 (Vol. 2, p. 1435).
The earnings evidence in
Table 7 suggests that working in the United States was a good option for francophones with weak English and literacy skills. We have seen in Tables 6 and 7 that knowing how to speak English was a key determinant of earnings for men working in the Canadian west, and most nonanglophones reported that they could speak English. We strongly suspect that francophones who moved to the Canadian west normally spoke some English at the time of their move.
A key difference between Canadians in the United States and settlers in the Canadian west is that the former were much more often married. Migrants to the northeastern states—both French and Other Canadians— routinely married as young adults.53
In 1900 just over half of French and Other Canadian men aged 25 to 29 in the northeastern United States were married. In eastern Canada, the proportions were 58 and 37 percent, and in western Canada, 35 and 30 percent, but 73 percent for Eastern European men.
Once married, a move to the west, where there were few job prospects for young women, and where the best-paid jobs for blue-collar men were often in remote locations unsuitable for most families, became both more costly and less appealing.
Looking forward from 1900, were francophone Canadians in the United States or eastern Canada as likely to move to western Canada as other Canadians? If men aged 16–29 in 1900/01 would be the core migrant group of the new decade, there were about six francophone Canadian men in the United States for every ten nonfrancophones. However, if illiterates, unilingual francophones, and the married would not move, there were only about four potentially mobile francophones in the United States for every ten nonfrancophones. For the Canadian-born living in eastern Canada, there were about five francophone young men for every ten nonfrancophones, but only about two and a half literate, English-speaking, single men.54
Assuming that men who did not report literacy and English-language ability were illiterate and unable to speak English.
We can only speculate on the possible impact of changing Canadian or U.S. immigration policy on population distributions in Canada. Even a radical change in U.S. policy would not likely have resulted in a much more even distribution of francophones and anglophones across Canada. If moving to the United States had been as difficult for Canadians in the 1880s and 1890s as it was in the 1930s (when it was nearly impossible), more francophone Quebecers would probably have moved to Ontario, but few would have gone further west. Anglophones in the United States were more like anglophones in the Canadian west: if the open door had slammed shut, a good many would likely have located in the west instead.55
A more plausible counter-factual is an earlier U.S. imposition of literacy tests. From 1917 French Canadians were much more often barred from entering the United States because of illiteracy (Ramirez, Crossing the 49th Parallel, p. 135). Lew and Cater, “Impact,” consider the possible impact on migration to Canada by Europeans of the introduction of U.S. quotas in the 1920s.
Could the Dominion government have created a substantial flow of French Canadians to the west in the 1890s? By 1914 it would almost certainly have been too late, as the other groups had by then established strong chains, and most of the good farmland had been settled. With substantial cash subsidies for poor French Canadian homesteaders, we think that, by the early 1900s, there could have been a substantial number of flourishing French Canadian communities, offering job opportunities even to the illiterate and initially unilingual. As with Eastern European migration, once an adequate base was established, a flow would probably have continued.
How big a subsidy might have been required? Establishing a farm cost $1,000 or more.56
Ankli and Litt, “Growth of Prairie Agriculture,” p. 55.
$400 per adult male was greater than annual unskilled earnings in Quebec—with two or three adult men in a family, even those with virtually no capital could have established a farm. If a total expenditure of $20 million from 1890 to 1900 had increased the French Canadian adult male population of the west by 40,000 in 1901 (and left all other population flows unchanged), about 20 percent of the working (and voting) age men in the west would have been francophone—enough for a substantial political presence.
57 If 50,000 francophone men had moved west in the 1890s, perhaps 40,000 would have remained in 1901.
Such a policy would have raised total federal budgetary expenditure by about 4 percent, and annual expenditure on immigration and settlement by a factor of at least four.
58 Urquhart and Buckley, Historical Statistics, series G42. Actual annual expenditures by the Department of the Interior on immigration in the late 1890s were less than $500,000 (Report of the Auditor General, 1896–97 H-2, 1897-98 H-2, 1898-99 H-2). Mercer, Railroads, p. 92, estimated the 1881 present value (in 1900 $) of the subsidy to the Canadian Pacific Railway at approximately $53 million.
The suggested grant of $400 per man is probably a generous estimate of what was required to get a flow going, but this is largely irrelevant. Quite apart from opposition to dramatically increased expenditure levels, such a proposal was not politically feasible. How could a subsidy be offered only to French Canadians?
CONCLUSIONS
Few French Canadians had an incentive to settle in the Canadian West. For the many illiterate or unilingual francophones of eastern Canada, labor market opportunities in the west could be seen to be worse than at home. Like the European-born, the French Canadian men working in the Canadian west were highly concentrated in agriculture, where limited knowledge of English was likely less of a handicap than in other sectors.
Although the out-of-pocket travel costs per person to western Canada were similar from all parts of eastern Canada, given the earlier age of marriage and greater number of children in French Canadian families, francophone men in their twenties and thirties had more dependents. Francophones in eastern Canada had lower employment earnings than anglophones, and Quebec farms were less productive than Ontario farms. Financing a move to the west, and the costs of setting up a farm, were a greater burden for francophones. Only a small subset of Eastern European migrants chose the Canadian West before 1900: by the standards of the stream of emigrants from Eastern Europe, these were often reasonably prosperous families.
The low average age of marriage for French Canadians survived the move to New England. By contrast, the living and working conditions of many occupations in western Canada made it hard for families to live together. Given the surplus of men, bachelors who moved west were reducing their prospects for marriage.
Perceptions that the Canadian West was a relatively hostile political and social environment for French Canadians and Roman Catholics may have been correct. Without controversies over language and religion, and with encouragement from the political and religious elite of Quebec, a few more French Canadians might have moved westward. However, given the very large economic disincentives, without substantial cash transfers to make up for lack of assets, it is doubtful that many French Canadians would ever have sought out the “last, best, West.”
We thank Eric Sager for providing us with the CFP data, and Gordon Darroch for providing us with the Darroch/Ornstein sample of the 1871 Census of Canada. We have received helpful comments from the editors and referees, from participants at the Dublin Economics Workshop, the UCLA Economic History Seminar, the Société Canadienne de Science Économique conference, the Canadian Economics Association conference, the EHA conference, and from Jennifer Hunt, Frank Lewis, and Bill Sundstrom. Financial support for this project has come from the SSHRC and the IIIS (Trinity College, Dublin).