I. INTRODUCTION
Industrial activity generates large quantities of aqueous effluents that contain high levels of toxic heavy metals, resulting in the discharge of industrial wastewater. It is well known that the heavy metals have accumulating characteristics in nature and cannot be biodegraded, leading to be hazardous for living organisms. Therefore, treatment of water contaminated by heavy metals is a critical environmental issue. Many researches have indicated that Ni2+ was frequently detected in industrial wastewater (e.g., effluents discharged from mines drainage, plating plants, paint and ink formulation units, and porcelain enameling). It is obvious that the occurrence of nickel in industrial effluents beyond permissible limits will bring serious environmental pollution, threatening human health and ecosystem.Reference Amini, Younesi and Bahramifar1 As we know, lung damage, nose and bone cancer, and headache can be caused by the presence of excessive nickel in the aqueous solution.Reference Parker2 Consequently, industrial effluents containing high levels of nickel must be purified before being released into the environment.
The conventional methods used for removing heavy metals from wastewater are precipitation, ion exchange, adsorption, coagulation, electrocoagulation, reduction, membrane processes, etc.Reference Pérez-Quintanilla, Sánchez, del Hierro, Fajardo and Sierra3–Reference Kocaoba5 Among these methods, adsorption is effective and simple. Recently, many kinds of adsorbents such as activated carbon, natural sepiolite, and activated alumina have been used for nickel ions removal.Reference Hasar6–Reference Rajurkar, Gokarn and Dimya8 However, these adsorbents always suffer from low adsorption capacities and/or removal efficiencies. For example, the adsorption capacity of Ni2+ on modified activated carbon (MAC)-II is 4.89 mmg/g.Reference Hasar6 The removal efficiency of Ni2+ on activated aluminium powder (AAP) at pH 7 is about 25% using 0.5 g AAP and 25 mL 0.1 M Ni2+ as adsorbent and adsorbate, respectively.Reference Rajurkar, Gokarn and Dimya8 Adsorption with aminofunctionalized mesoporous silica (AFMS) would be more preferable because of their uniquely large surface area, high adsorption affinity due to an easy formation of coordination bonds between metal ions and aminogroups, and high regeneration characteristics.Reference Heidaria, Younesia and Mehraban9, Reference Zhao, Gao, Tang, Xu and Wu10 Generally, AFMS were synthesized by cocondensation and postgrafting methods.Reference Da’na and Sayari11, Reference Du and He12 However, certain defects are associated with both methods. For example, the postgrafting method typically results in an inhomogeneous surface coverage due to organic moieties congregating near the entries of the mesopores and the exterior surface,Reference Richer and Mercier13 whereas the functional groups are often embedded in the silica network and the terminal groups can destabilize the framework during the cocondensation process.Reference Tang and Landskron14 Using aminosilane or quaternized aminosilane as costructure-directing agent (CSDA), well-ordered AFMS can be produced by self-assembly of anionic surfactants and inorganic precursors, in which the aminogroups can be distributed uniformly due to the introduction of CDSA.Reference Che, Garcia-Bennett, Yokoi, Sakamoto, Kunieda, Terasaki and Tatsumi15, Reference Zheng, Gao and Che16 Furthermore, AFMS with high aminoloading can be obtained by optimizing the synthesis conditions through an anionic surfactant-templated method.Reference Hao, Zhong, Pepe and Zhu17 Predictably, high aminoloading will result in high removal capacity of heavy metal ions from wastewater.
Up to now, various aminofunctionalized materials were used as adsorbents for removing nickel ions. For example, Tan et al.Reference Tan, Hu and Su18 studied the adsorption of Ni2+ on the amine-modified mycelium. Mesoporous silica (developed by Mobil), MCM-41, after aminofunctionalization (NH2-MCM-41) synthesized by postgrafting was applied to remove Ni(II) ions from aqueous solution.Reference Heidaria, Younesia and Mehraban9 Recently, mesoporous silica SBA-15 (developed by University of California, Santa Barbara) functionalized by ethylenediamine was prepared and used as an adsorbent for removing Ni2+.Reference Zhao, Gao, Tang, Xu and Wu10 However, these adsorbents often suffered from relatively low aminoloading and/or low adsorption rate. To the best of our knowledge, very few studies have been undertaken so far, to investigate the adsorption properties of Ni2+ on the AFMS templated by anion surfactant, especially on those with high aminoloading and large pore size.
In the present study, AFMS with high aminoloading, high surface area, and large pore size was synthesized by an anion surfactant route and was applied to adsorb Ni2+ in the aqueous solution. The effect of solution pH on the adsorption capacity of AFMS was studied. Sips, Langmuir and Freundlich isotherms were applied to analyze the experimental equilibrium data. Based on the analysis, a hypothesis concerning possible mechanism governing the adsorption of Ni2+ by the extracted sample has been postulated.
II. EXPERIMENTAL
A. Materials
N-Lauroylsarcosine sodium (Sar-Na) was purchased from Merck (Frankfurt, Germany), and tetraethyl orthosilicate (TEOS) and 3-aminopropyltrimethoxysilane (APTMS) were from Acros (NJ) and Aldrich (Brussels, Belgium), respectively. Ni(NO3)2·6H2O, ethanol, ethanol amine, sodium ethylenediaminetetraacetic acid (EDTA), sodium hydroxide (NaOH), and 37% fuming hydrochloric acid (HCl) were purchased from Sinopharm Chemical Reagent Co., Ltd. (Shanghai, China). All aqueous solutions were prepared using deionized water at room temperature. 5 mM Ni2+ solution prepared from the chemical Ni(NO3)2·6H2O was used as atomic absorption spectrometry standard and stock solution. The solutions containing Ni2+ for the adsorption experiments were then prepared from the dilution of the stock solutions when used. The pH values of all the solutions containing Ni2+ used for the adsorption experiments were adjusted to the desired ones using 0.1 M HCl or 0.1 M NaOH solution.
B. Synthesis and characterization
AFMS were prepared according to the method developed in our previous work.Reference Hao, Zhong, Pepe and Zhu17 Typically, 2.3472 g Sar-Na was completely dissolved in 70 mL deionized water under stirring at room temperature. Afterward, 25 mL of 0.1 mol/L HCl solution was added to the Sar-Na solution under vigorous stirring for 1 h, and then a mixture of 3.0 mL TEOS and 1.4 mL APTMS was added to the above prepared solution under vigorous stirring for 10 min. The resulting mixture was aged at room temperature for 2 h and the synthesis was then carried out hydrothermally without agitation in a closed 100 mL reaction kettle placed in an oven at 80 °C for 20–48 h. The products were filtered and the solids were washed with deionized water. The washed solids were then dried for 10 h at 80 °C prior to a further analysis or use. The surfactant in the dried sample was removed by an ion-exchange method.Reference Zheng, Gao and Che16 Typically, 1.0 g of the dried solid was dispersed in a mixture solution of 80 mL of ethanol and 20 mL of ethanol amine at room temperature by agitation and then the mixture was refluxed at 90 °C for 12 h. The solid was recovered by filtration, washed with ethanol, and dried. The above extraction procedure was repeated twice.
The synthesized samples were characterized by Fourier transform infrared (FTIR) spectra, scanning electron microscopy (SEM), transmission electron microscopy (TEM), N2 adsorption-desorption, and elemental analysis techniques. The detailed description of the instruments and experimental procedures is reported in our previous work.Reference Hao, Zhong, Pepe and Zhu17
C. Effect of initial solution pH
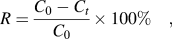
A quantity of 0.1 g of the AFMS adsorbent was suspended in 100 mL of 1.0 mM solution containing Ni2+ at different pH values ranging from 3.0 to 9.5. The mixture was stirred for 180 min, then centrifuged at 8000 rpm for 10 min, and finally separated into liquid and solid phases. The collected solution was analyzed by the atomic absorption spectroscopy to determine the concentration of Ni2+. The removal efficiency, R, of Ni2+ by the adsorbent was calculated by the following equation:
 $$R = {{C_0 - C_t } \over {C_0 }} \times 100\% \quad,$$
where C 0 is the initial concentration of the metal ions (mM) and C t is the concentration of the metal ions (mM) at time t (min).
D. Adsorption kinetics
A quantity of 0.1 g of the adsorbent was suspended in 100 mL of 1.0 mM Ni(NO3)2 solution with the optimized pH value confirmed by Sec. II. C, under vigorous stirring at 25 °C for different periods ranging from 2 to 180 min. The mixture was then quickly filtered to remove the adsorbent solid and the solution was analyzed by the atomic absorption spectroscopy.
E. Adsorption isotherm experiments
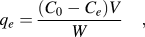
For Ni2+-AFMS systems, the initial Ni2+ concentration was varied from 0.5 to 5 mM. In all cases, the initial pH of the solution was maintained at 8.5 because this pH was found to be the optimum one on the basis of batch tests conducted. The adsorption isotherm data were calculated by the following equation:
 $$q_e = {{(C_0 - C_e )V} \over W}\quad,$$
where q e is the adsorbed amount of Ni2+ on the adsorbent in mmol metal ions/g adsorbent, C 0 is the initial concentration of the metal ions (mM), C e is the equilibrium concentration of the metal ions (mM), V is the volume of the used solution containing the metal ions (L), and W is the weight of the used adsorbent (g).
F. Adsorbent regeneration
The regeneration of the used adsorbent was carried out based on the method developed by Da’na and Sayari.Reference Da’na and Sayari11 Typically, 0.05 g of the Ni2+ adsorbed AFMS was treated with 10 mL of 0.1 M EDTA solution under vigorous stirring at 40 °C for 1 h, followed by washing with deionized water several times and drying at 80 °C for 2 h. The regenerated AFMS adsorbent was then used for the next adsorption. Ten successive adsorption-regeneration cycles were performed to check the reusability of the developed AFMS adsorbent for capturing Ni2+.
III. RESULTS AND DISCUSSION
A. Textural and physicochemical properties
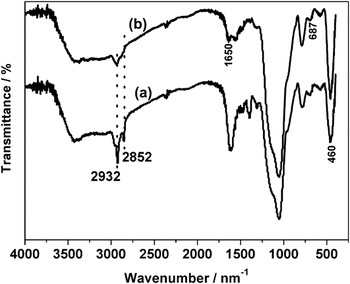
Figure 1 shows the FTIR spectra of the as-synthesized sample and the extracted sample. For the as-synthesized sample, the absorbance peaks corresponding to the symmetrical and asymmetrical stretching vibrations of the methylene groups of the surfactant and the CSDA appear around 2852 and 2932 cm−1, respectively.Reference Zheng, Gao and Che16 From Fig. 1, it is easy to find that the intensity of typical methylene bands in the extracted sample is dramatically lower than that of the as-synthesized sample and the band of 2852 cm−1 in the extracted sample disappears, whereas the remaining weak peak at 2932 cm−1 could be associated with the methylene groups in the CSDA, which reveals that the surfactant has been removed from the as-synthesized sample. For the extracted sample, the vibrations of Si–O–Si can be seen at around 1095 cm−1 (asymmetric stretching) and 460 cm−1 (bending).Reference Umamaheswari, Palanichamy and Murugesan19 The presence of –N–H bending vibration around 687 and 1650 cm−1 confirms the existence of aminogroups, and the broad absorption band in the region 3700–3000 cm−1 can be attributed to the stretching of the framework Si–OH groups and physically adsorbed water molecules.Reference Heidaria, Younesia and Mehraban9
FTIR spectra of the (a) as-synthesized sample and (b) the extracted sample.

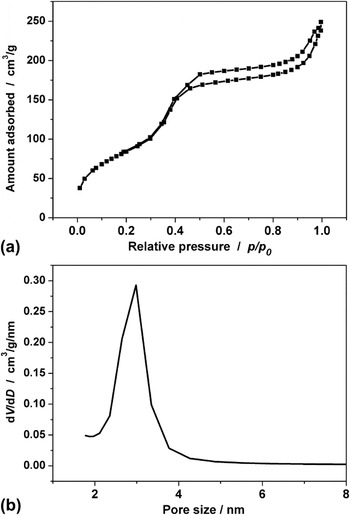
The adsorption-desorption isotherms of N2 on the extracted sample at −196 °C and its corresponding Barrett-Joyner-Halenda (BJH) pore size distribution (PSD) plot are presented in Fig. 2. From Fig. 2, it can be seen that the adsorption isotherm of N2 on the synthesized sample displays a type IV isotherm with H1 hysteresis and has a steep increase in the adsorbed amount in a relative pressure range of 0.30–0.50, implying that the extracted sample could be of mesoporous material. Compared with that at the P/P 0 = 0.30–0.50, the adsorbed amount of N2 on the synthesized sample at the P/P 0 = 0.5–1.0 increased slightly with pressure due to the diffusion resistance of smaller pore size after N2 adsorption. It can be seen from Fig. 2(b) that the PSD is centered at about 3.0 nm for the extracted sample. The estimated Brunauer-Emmett-Teller (BET) surface area and the total pore volume of the synthesized sample are 316 m2/g and 0.39 cm3/g, respectively.
(a) Adsorption-desorption isotherms of N2 on the extracted sample at −196 °C and (b) the corresponding BJH pore size distribution (PSD) plot from the adsorption branch.

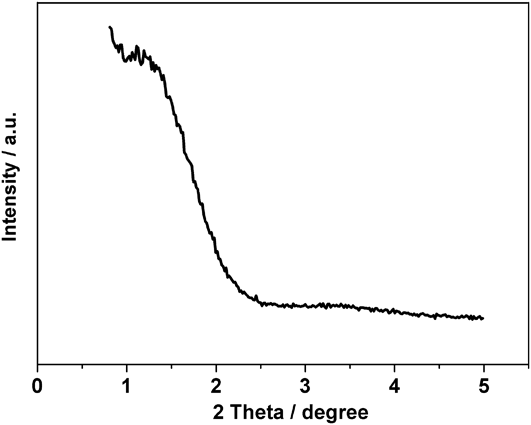
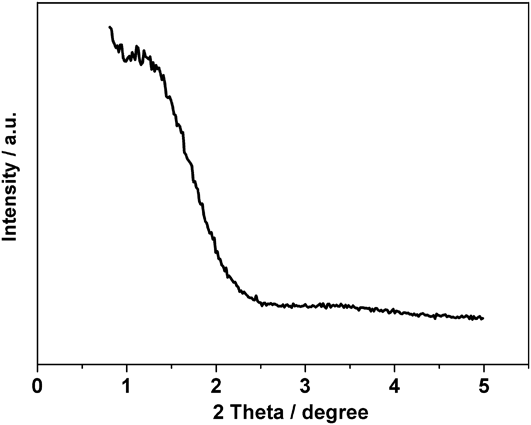
The x-ray diffraction (XRD) pattern of the extracted sample (shown in Fig. 3) display a small diffraction peak in the region of 2θ = 1–2.5° and a broad and short diffraction peak in the region of 2θ = 3–4°, indicating that the synthesized sample is disordered mesostructured silica materials, lacking a long-range structural order.
XRD pattern of the extracted sample.
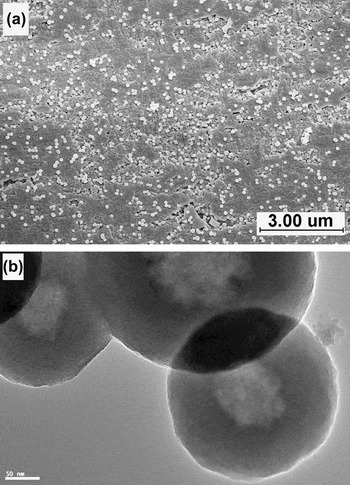
The SEM image of the extracted sample is shown in Fig. 4(a). It is easy to find that the extracted sample is composed of silica spheres and all the spheres are segregated. To further identify the mesostructure, especially the mesopore arrangement of the synthesized sample, the TEM observation was performed, and the image is shown in Fig. 4(b), from which the dim spheres can be clearly observed, indicating a disordered mesostructure was formed in the silica materials, identical to the result of XRD. From Fig. 4(b), it can be seen that the particle size of the extracted sample is about 250 nm.
(a) SEM and (b) TEM images of the extracted sample.

B. Adsorption
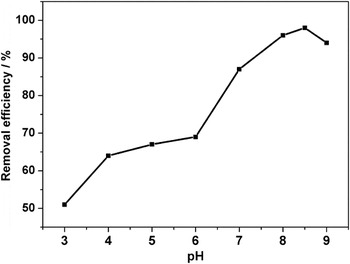
It is well known that the pH of the solution plays an important role in the adsorption of heavy metal ions from their solutions when using AFMS as adsorbent because the pH of the solution may affect the surface charge of the AFMS adsorbent through the protonation of the functional groupsReference Hao, Chang, Xiao, Zhong and Zhu20 and of the free surface hydroxyl groupsReference Dimos, Stathi, Karakassides and Deligiannakis21 as well as the degree of ionization and hydrolysis of the species present in the solution. The effect of the solution pH on the adsorption of Ni2+ by the extracted sample is shown in Fig. 5. It is obvious that the adsorption efficiency increased with increase in the solution pH from 3.0 to 8.5, then decreased after pH 8.5, indicating that the adsorption of Ni2+ depends on the solution pH greatly. The reason is that the concentration of protonated amine groups is increased with decreasing pH values, resulting in a reduction in the availability of number of binding sites for Ni2+ uptake and consequently the adsorbed amount of Ni2+ is lower. On the other hand, aminogroups are deprotonated and the adsorption sites for Ni2+ are increased with increasing pH, which will lead to a higher adsorption amount of Ni2+ on the AFMS adsorbent. When pH values are higher than 8.5, Ni2+ will be precipitated out because of the high concentration of hydroxyl ions in the aqueous solution. Moreover, the pH 8.5 is very close to that of 8.6, the pH value of the solution corresponding to a net surface charge of zero (shown in Fig. 9),Reference Da’na and Sayari11 which is of great benefit to the adsorption of metal ions. Therefore, the pH value of 8.5 was chosen to be the optimum one for removing Ni2+ in this study.
Removal efficiency of Ni2+ on the extracted sample at 25 °C as a function of the initial pH value in 1.0 mM Ni(NO3)2 solution.

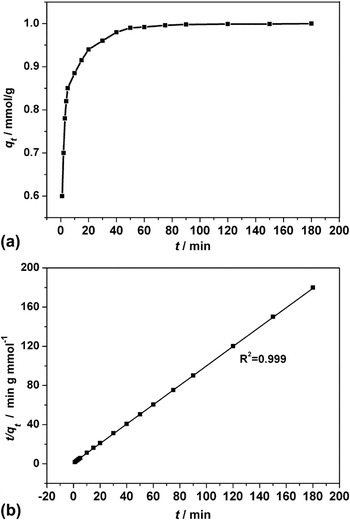
Because kinetics of the adsorption process can provide essential information on the reaction pathways and the solute uptake rate, it is vital to investigate the adsorption kinetics in heavy metal ions removal from wastewater. The uptake of Ni2+ in the extracted sample at 25 °C and an initial pH value of 8.5 in 1.0 mM Ni(NO3)2 solution is presented in Fig. 6(a). It is obvious from Fig. 6(a) that the adsorption rate of Ni2+ on the extracted sample is much faster because the removal efficiency can reach 88% at 10 min and uptake can reach the equilibrium within 60 min, which are much faster than that in the adsorbent synthesized by the postgrafting method reported in the literature.Reference An, Gao, Dai, Wang and Wang22 The reason may be that the adsorbent synthesized by the anionic surfactant-templated method possesses a large and uniform pore size distribution due to the introduction of CSDA,Reference Che, Garcia-Bennett, Yokoi, Sakamoto, Kunieda, Terasaki and Tatsumi15 resulting in a less diffusion resistance to Ni2+. Moreover, high aminoloading on the surface of adsorbent will also improve the adsorption rate of Ni2+. From the result of elemental analysis, the content of N is 4.26 mmol/g, much higher than 1.77 mmol/g in the APTS-SBA-15-AB,Reference Da’na and Sayari11 2.16 mmol/g in the SBA-12/MAP,Reference Zelenak, Halamova, Gaberova, Bloch and Llewellyn23 and 2.34 mmol/g in the GC1.5N.Reference Manu, Haresh and Hari24
Uptake of Ni2+ in the extracted sample at 25 °C and an initial pH value of 8.5 in (a) 1.0 mM Ni(NO3)2 solution and (b) pseudo-second-order plot for the adsorption of Ni2+, symbols representing the experimental data and lines representing the pseudo-second-order model [Eq. (4)] correlations.

Two common semiempirical kinetic models, the pseudo-first-order [Eq. (3)] and pseudo-second-order equations [Eq. (4)],Reference Aguado, Arsuaga, Arencibia, Lindo and Gascόn25 have been used to analyze the adsorption rate of Ni2+.
 $$\ln (q_e - q_t ) = \ln q_e - k_1 t\quad,$$
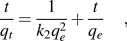 $${t \over {q_t }} = {1 \over {k_2 q_e^2 }} + {t \over {q_e }}\quad,$$
where q e and q t are, respectively, the adsorbed amounts of metal at equilibrium and time t, expressed as mmol/g; k 1 is the pseudo-first-order kinetic constant, expressed as min−1, and k 2 is the pseudo-second-order kinetic constant, expressed as g/(mmol min). From the results of analysis, it can be found that the pseudo-first-order model was not suitable for describing the kinetic profile as it did not show apparent linear behavior (not shown), whereas the rate of aqueous Ni2+ adsorption over the extracted sample was accurately described by the pseudo-second-order equation because the experimental t/q t and t data are provided along with linear correlation [shown in Fig. 6(b)].
The analysis of equilibrium data is essential for developing an equation to compare different adsorbents. To examine the relationship between adsorption and aqueous concentration at equilibrium, a three-parameter model (Sips isotherms) and two two-parameter models (Langmuir and Freundlich isotherms) were used to describe the equilibrium between the Ni2+ and aminofunctionalized mesoporous silica in aqueous Ni2+ solution. Sips isotherm
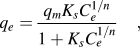 $$q_e = {{q_m K_s C_e^{1/n} } \over {1 + K_s C_e^{1/n} }}\quad,$$
where q m is the quantity adsorbed at saturation or monolayer capacity, expressed as mmol/g; C e is the equilibrium concentration of metal ions, expressed as mmol/L, and K S is the Sips constant, expressed as (mmol/L)−1/n. Langmuir isotherm
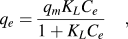 $$q_e = {{q_m K_L C_e } \over {1 + K_L C_e }}\quad,$$
where q m is the quantity of Ni2+ adsorbed at saturation or monolayer capacity, expressed as mmol/g; C e is the equilibrium concentration of Ni2+, expressed as mmol/L, and K L is the Langmuir constant, expressed asl/mmol.
Freundlich isotherm
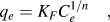 $$q_e = K_F C_e^{1/n} \quad,$$
where K F is the Freundlich constant, C e is the equilibrium concentration of metal ions, expressed as mmol/L, and n is the Freundlich exponent (dimensionless).
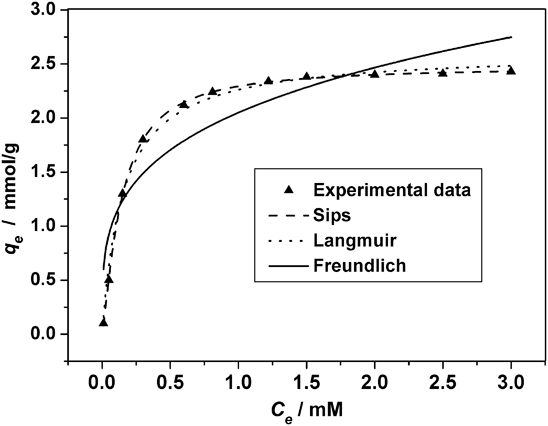
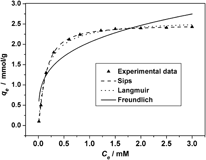
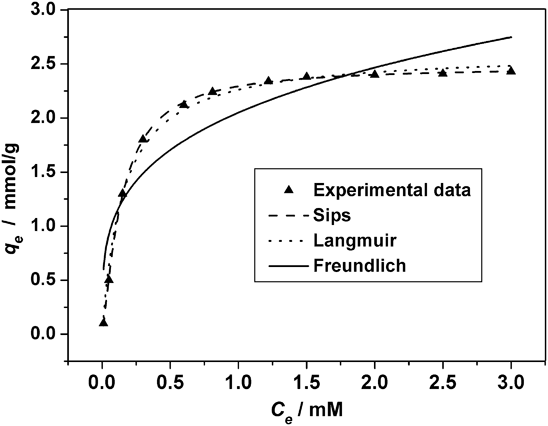
The adsorption and respective model (Sips, Langmuir, and Freundlich) isotherm of Ni2+ on the extracted sample at 25 °C are shown in Fig. 7. The obtained parameters for all the models are listed in Table I. Figure 7 shows that all the isotherms have a sharp slope at low concentration, indicating that the removal efficiency of Ni2+ on the extracted sample is greatly high in this region. However, the adsorption rate falls gradually at higher concentration. The reason may be that there are lots of adsorption sites for removing Ni2+ at lower concentration, whereas more binding sites are occupied at higher concentration. Furthermore, the repulsive forces among heavy metal ions become stronger at high concentration than that of at low concentration. From Fig. 7, it can be seen that the three-parameter model (Sips) plots a much better mathematical fit for isotherms than those of two-parameter models (Langmuir and Freundlich), and hence, the monolayer capacity q m for the isotherms was calculated using the Sips model, considered to be the nearest to the real values of monolayer adsorption capacity. From Table I, it is found that the monolayer adsorption capacity for Ni2+ is about 2.48 mmol/g, much higher than 0.72 mmol/g on single-walled carbon nanotubes,Reference Lu, Liu and Rao26 0.082 mmol/g on rice husk ash,Reference Srivastava, Mall and Mishra27 0.21 mmol/g on NH2-MCM-41,Reference Heidaria, Younesia and Mehraban9 and 0.66 mmol/g on aminofunctionalized silica nano hollow sphere (NH2-SNHS).Reference Najafi, Yousefi and Rafati28
Adsorption isotherms of Ni2+ on the extracted sample at 25 °C and an initial pH value of 8.5 in Ni(NO3)2 solutions. Symbols are the experimental data and lines are the Sips, Langmuir and Freundlich model correlations.
Model parameters for adsorption of Ni2+ on the extracted sample.

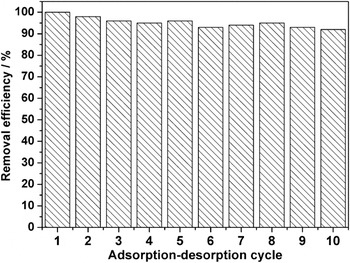
In addition to excellent adsorption capacity, highly repeated use is very important in the assessment of an adsorbent. The adsorption reversibility of Ni2+ on the extracted sample was studied using EDTA as an eluent, and the results were presented in Fig. 8. It is clear from Fig. 8 that the removal efficiency is still above 92% after 10 adsorption-regeneration cycles, indicating EDTA is an effective desorption effluent. Moreover, the mesostructure of the sample after 10 adsorption-regeneration cycles is almost identical to that of the initial sample, proved by N2 adsorption-desorption and TEM techniques (not shown).
Adsorption-desorption cycles of Ni2+ on the extracted sample.

Schematic representation of possible mechanism for adsorption of Ni2+ by the extracted sample.

According to the value of N and q m, it is easy to find that the ratio of ligand (amine) to Ni2+ is 1.72:1 (4.26/2.48), much lower than 4:1 of [Ni(NH3)4]2+, implying that there may exist other ligands to capture Ni2+ from aqueous solution. From the experimental data, it can be found that the adsorbent in this study was synthesized by an extraction method, which can be helpful for preserving more silanol groups on the surface of mesoporous pores,Reference Wang and Yang29 thus the hydroxyl on the surface of AFMS plays an important role during the adsorption of Ni2+ from solution. The possible mechanism for the adsorption of Ni2+ by the extracted sample is illustrated in Fig. 9.
IV. CONCLUSIONS
Aminofunctionalized mesoporous silica with high aminogroup loading, high surface area and large pore size was optimally synthesized by an anionic surfactant-templated route. The synthesized mesoporous material was used for removing Ni2+ from aqueous solution. The results show that the adsorption capacity of the extracted sample is influenced by the solution pH greatly, and the optimum pH value for removing Ni2+ is 8.5. Sips model plots a better mathematical fit for Ni2+ adsorption isotherms on the extracted sample as compared with Langmuir and Freundlich models. The maximum adsorption capacity of Ni2+ on the extracted sample is 2.48 mmol/g, which is much higher than those reported in the literature so far. In addition, silanol groups on the surface of adsorbent play an important role for removing Ni2+ from aqueous solution.
ACKNOWLEDGMENTS
The financial supports provided by the Natural Science Foundation of Zhejiang Province (Grant No. Y4110289) is gratefully acknowledged.