Implications
Subacute ruminal acidosis (SARA) is mainly characterized by pH depression, but hitherto no universal rumen pH indicators have been established because of variability in animals and in pH measurement methods. In the present work we have implemented a mathematical method for processing rumen pH signals recorded by in situ rumen sensors, thus overcoming inter-animal variability and suppressing noise and drift of the sensor. The relative pH indicators obtained appeared more relevant than commonly used pH indicators for detection of long-term SARA syndrome in dairy cows.
Introduction
Intensive production systems have the common practice of feeding high-producing dairy cows with large quantities of starch associated with low fibre content to meet the energy requirements for milk production. Such unbalanced diets may negatively impact rumen function due to high acid production and reduced buffering capacity (Nagaraja and Titgemeyer, Reference Nagaraja and Titgemeyer2007). With a dairy cows prevalence of 15% in European countries (Kleen and Cannizzo, Reference Kleen and Cannizzo2012; Stefańska et al., Reference Stefańska, Nowak, Komisarek, Taciak, Barszcz and Skomiał2016), the main ruminal disorder is known to be SARA which hitherto has been characterized by intermittent and moderate periods of depressed rumen pH (Enemark et al., Reference Enemark, Jorgensen and Enemark2002).
Rumen pH is the parameter most monitored when making SARA diagnosis. Historically, depending on the severity of SARA, daily average pH thresholds of 5.50 to 6.25 have been proposed (Sauvant et al., Reference Sauvant, Meschy and Mertens1999). However, pH value is significantly impacted by the measurement technique (Duffield et al., Reference Duffield, Plaizier, Fairfield, Bagg, Vessie, Dick, Wilson, Aramini and McBride2004; Shen et al., Reference Shen, Chai, Song, Liu and Wu2012) and depends upon sampling location (Gasteiner et al., Reference Gasteiner, Fallast, Rosenkranz, Häusler, Schneider and Guggenberger2009), rumen contents and the frequency of pH measurement. The large variability of rumen conditions between animals also alters the robustness of absolute rumen pH indicators of SARA (Schwartzkopf-Genswein et al., Reference Schwartzkopf-Genswein, Beauchemin, Gibb, Crews, Hickman, Streeter and McAllister2003). Consequently there is still no scientific consensus regarding pH thresholds for detection of SARA.
The use of rumen sensors to monitor reticulo-rumen pH is growing fast. Such devices are considered to be relevant, non-invasive and affordable tools that can help prevent SARA in the field (Kleen et al., Reference Kleen, Hooijer, Rehage and Noordhuizen2003; Klevenhusen et al., Reference Klevenhusen, Pourazad, Wetzels, Qumar, Khol-Parisini and Zebeli2014; Castro-Costa et al., Reference Castro-Costa, Salama, Moll, Aguiló and Caja2015). In addition, rumen sensors allow high-resolution kinetics of rumen pH (up to 1 measurement/min with some systems) and provide the opportunity to explore other integrative daily indicators of pH (time spent below threshold, pH range, etc.), which may be more relevant than average pH alone (Sauvant et al., Reference Sauvant, Meschy and Mertens1999; Kolver and De Veth, Reference Kolver and De Veth2002). However, interpreting high-resolution pH kinetics is complex and requires guidelines to help researchers to obtain consensual data. The aim of this study was therefore to improve the accuracy of SARA syndrome detection in using relative pH indicators obtained from mathematically processed reticulo-rumen sensor data in dairy cows.
Material and methods
The trial was conducted at the dairy cow research facilities of the French National Institute for Agricultural Research in France (INRA, Theix) and was agreed by French ethics committee (approval no. C2E2A-02).
Animals, diets and experimental procedures
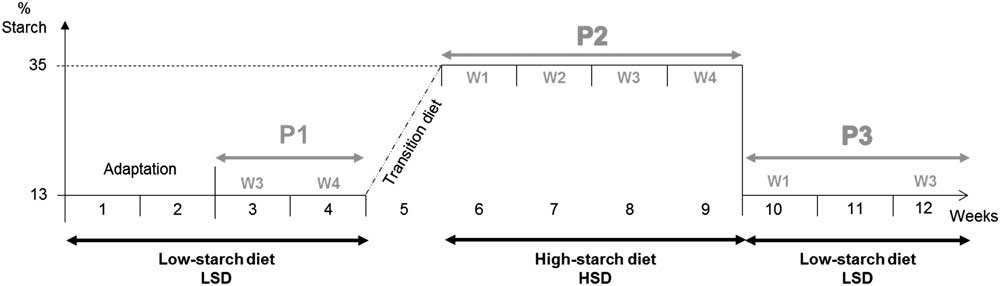
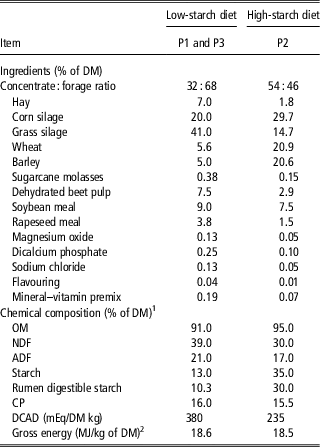
In total, 11 primiparous Holstein cows, including six rumen-fistulated animals, were tethered in individual stalls on concrete floors with rubber mats and had ad libitum access to water. At the start of the experiment, the average physiological status was as follows: a BW of 658±37 kg, 135±7 days in milk, a milk yield of 27.5±2.3 kg/day. Two different total mixed diets (TMD) (Table 1) were distributed over 12 weeks of the longitudinal experiment (Figure 1). Cows received a low-starch diet (LSD) as control containing 13% starch for 4 weeks (period 1; P1). The amount of starch was then increased gradually every 2 days, from 13% to 35% during a 6-day transition to induce SARA. A high-starch diet (HSD) containing 35% starch was distributed for 4 weeks in order to maintain a long-term SARA challenge (period 2; P2). Finally, cows were again fed the control diet (LSD), without transition for 3 weeks (period 3; P3). All the diets were formulated to cover 105% of the requirements of lactating dairy cows and to be equivalent in terms of CP and gross energy (Institut National de la Recherche Agronomique (INRA), 2010). Portions of 60% and 40% of the daily amount of the TMD were offered twice daily at 0900 and 1630 h, respectively. The desired quantity of TMD was obtained by daily adjustment of the amounts offered, depending on the refusals of the previous day.
Experimental design of subacute ruminal acidosis challenge. All lactating cows (n=11) were successively submitted to a low-starch diet (LSD; 32% concentrate+68% forage in period 1 (P1), a high-starch diet (HSD; 54% concentrate+46% forage) in period 2 (P2) and a LSD similar to P1 in period 3 (P3); 8-week measurements were performed: 2 weeks in P1: W3P1, W4P1; 4 weeks in P2: W1P2, W2P2, W3P2, W4P2; and 2 weeks in P3: W1P3, W3P3.

Ingredients and composition of experimental diets

DM=dry matter; OM=organic matter; DCAD=dietary cation–anion difference.
1 Average chemical composition of a pool of samples (n=2) collected in weeks 1 and 3 of each period 1, 2 and 3.
2 Calculation according to INRA (2010).
Measurements and analysis
Intake and feed
Feed intake was measured and recorded twice daily throughout the experiment by weighing the feed offered and subtracting refusal weight. During each period, a representative sample of TMD (800 g) was taken in weeks 1 and 3 and pooled by diet; 500 g of each pool was used to determine dry matter (DM) content (60°C for 48 h), and 300 g were stored at −20°C. After defrosting at 21°C, pools were ground (0.75 mm screen sieve; Retsch GmbH, Haan, Germany) and analysed for chemical composition by InVivo Labs (Chierry, France). Organic matter was determined by ashing at 550°C for 6 h (method 942.05; Association of Official Analytical Chemists (AOAC), 2005). Total azote was analysed by combustion according to the Dumas method (method 968.06; AOAC, 2005), and CP content was calculated as N×6.25. Fibre (NDF and ADF) was determined (Van Soest et al., Reference Van Soest, Robertson and Lewis1991) after pre-treatment with amylase and expressed as exclusive of residual ash. Starch was analysed using an enzymatic method (Faisant et al., Reference Faisant, Planchot, Kozlowski, Pacouret, Colonna and Champ1995).
Milk yield and composition
Throughout the experiment, cows were milked twice daily at 0700 and 1600 h. Milk samples were collected over 2 days (four consecutive milkings) of each measurement week. The samples were stored at 4°C for a maximum of 20 h with potassium dichromate (Merck Chimie SAS, Fontenay-sous-Bois, France) before analysis of fat and protein content and somatic cell count (SCC) by mid IR (AOAC, 1997) using a three-channel spectrophotometer (MilkoScan 4000; Foss Electric A/S, Hillerod, Denmark and Laiterie Interprofesisonnelle Auvergne Limousin, Theix, France). For each sample measurement, daily parameters were calculated based on the individual effective morning and evening milk production.
Kinetics of rumen pH
Rumen pH was monitored continuously throughout the experiment using a commercial sensor (eBolus; eCow, Exeter, UK). One sensor per cow was immersed in the reticulum through the oesophagus with the use of dedicated balling gun. The sensor was calibrated according to the manufacturer’s recommendations before use. Each sensor was set up to record mean pH over 15 min (96 data points/day) with an accuracy of±0.1. Data were downloaded every 15 days using eCow handset (smartphone+antenna) with eCow android application.
Rumen samples
Rumen samples were collected from the six fistulated cows for 2 weeks in P1 (weeks 3 and 4), 4 weeks in P2 (weeks 1 to 4) and 2 weeks in P3 (weeks 1 and 3). On day 3 of each measurement week, samples (500 g) of whole rumen content were collected through the rumen cannula 4 h after the morning feeding and subdivided:
(1) A first portion (~100 g) of rumen content was homogenized on ice (3×1 min cycles with 1-min intervals) using a polytron grinding mill (Fisher Scientific, Illkirch, France). One subsample of 0.5 g was stored (−80°C) in 2 ml Eppendorf tubes pending microbiota analyses by molecular biology, and another one (50 g) was transferred into a 50 ml sterile tube (−80°C) until analysis of free lipopolysaccharide (LPS) endotoxins. Deoxyribonucleic acid extraction was performed using the method of Yu and Morrison (Reference Yu and Morrison2004). Quantitative polymerase chain reaction analyses were performed using the Takara SYBR Premix Ex Taq kit (Lonza, France) on a Step One Plus apparatus (Applied Biosystems, Villebon sur Yvette, France) as described in Silberberg et al. (Reference Silberberg, Chaucheyras-Durand, Commun, Mialon, Monteils, Mosoni, Morgavi and Martin2013). Quantitative polymerase chain reaction conditions and primer sets targeting the rrs gene were those described previously by Denman and McSweeney (2006) for Fibrobacter succinogenes and Ruminococcus flavefaciens and by Stevenson and Weimer (2007) for Selenomonas ruminantium and Streptococcus bovis. For general bacteria quantification, primers 520f and 799r2 were used (Edwards et al., 2007). Lipopolysaccharide concentration were determined by a chromogenic Limulus amoebocyte lysate end-point assay (QCL-1000; Cambrex Bio Science, Walkersville, MD, USA), in 96-well microtitre plates using pyrogen-free materials (glassware heated at 180°C for 4 h) and reagents. All samples were treated as previously described by Silberberg et al. (Reference Silberberg, Chaucheyras-Durand, Commun, Mialon, Monteils, Mosoni, Morgavi and Martin2013).
(2) The remaining portion of rumen content was filtered (400 μm nylon cloth) to separate and collect rumen fluid. For analysis of volatile fatty acids (VFA), 800 μl of rumen fluid was added to 500 μl of 0.5 N HCl containing 2% (w/v) metaphosphoric acid and 0.4% (w/v) crotonic acid before storage at −20°C. For protozoa enumeration, 1 ml of rumen fluid was added to 1 ml of methyl green-formalin-saline (MFS) solution (3.5% formaldehyde, 0.14 M NaCl, 0.92 mM methyl green) and stored at room temperature in the dark. Rumen fluid/MFS solution was diluted in an equal volume and protozoa were enumerated under a microscope (400×) in a Neubauer chamber (Dutscher, Brumath, France).
Calculations and statistical analysis
Rumen sensor pH data
Collected data were summarized with Excel Software and a Visual Basic for Application program was developed to synchronize and process the raw reticulo-rumen pH kinetics from all sensors. Each raw sequence of pH measurements is a time series (Xt) which may be modelled by adding a trend and cyclical components of different time constants: Xt=Dt+Ct+Nt where Dt is the offset and long-term drift due, respectively, to initial calibration (±0.05 pH unit), measurement accuracy over time (±0.1 pH unit/30 days) and cow initial pH value; Ct the daily variation impacted by meal delivery frequency and diet composition; and Nt the high-frequency noise due to a matrix effect (rumen) and environmental conditions (temperature, pressure, electrical artefacts). A signal processing algorithm was developed in order to isolate the potentially more interesting components (Ct) from abnormal or random variation (Dt and Nt). To this end a decomposition of the signal was performed using different combinations of weighted moving averages (WMA), which were (1) centred to avoid phase shifting, (2) weighted with a Gaussian function to give more importance to the neighbouring points and (3) windowed with a period of time adapted to the time constant of the component of interest. Thus, the noise (Nt) was removed with a WMA of 180 min producing smoothed kinetics (XtS) and the offset and drift were modelled with a WMA of 8 weeks and subtracted from the smoothed kinetics (XtS) to produce filtered-normalized kinetics (XtN). Information carried by the raw signal (Xt) was summarized on a daily basis by calculating the following absolute pH indicators (strictly from the synchronized raw data):
-
∙ pH average;
-
∙ pH minimum;
-
∙ pH maximum;
-
∙ time pH<5.6, 5.8 and 6 (min/day).
After signal processing, the calculation of relative daily indicators was possible using the filtered and normalized kinetics (XtN):
-
∙ NpH range=NpHmax−NpHmin;
-
∙ NpH standard deviation;
-
∙ time NpH<−0.3 and NpH<−0.5 pH units (min/day): cumulative time when pH was below the relative pH threshold of 0.3 or 0.5 units lower than the individual NpH centred to 0.
-
∙ Area under curve (AUC) NpH<−0.3 and NpH<−0.5 relative pH units: AUC of the relative pH threshold of 0.3 or 0.5 units lower than individual NpH centred to 0, measured in pH×minutes.
Statistical analysis
All data were analysed using R3.2.3 software. For each variable, individual data collected daily (or several days a week) throughout the experiment were averaged per week. When necessary, data were log-transformed before analysis in order to create a normal distribution and to reach assumptions of the statistical models (LPS, total protozoa, pH indicators: time pH<5.6, 5.8, 6, time NpH<−0.3, <−0.5 and AUC NpH<−0.3, <−0.5). Three different data analysis methods were implemented successively:
(1) A linear mixed model to identify the variables significantly modified between the 8 weeks of the experiment (2 weeks in P1, 4 weeks in P2 and 2 weeks in P3):
Y ijk =µ+A i +B j +C k +ɛ ijk , where Y ijk is the dependant variable, µ the mean, A i the fixed effect of period, B j the fixed effect of week nested in period, C k the random animal effect and ɛ ijk the residual error term (denominator degrees of freedom (DDFM), Kenward-Roger). Week was considered as a repeated measure. Least square means with the standard error (SE) of the model were reported in tables of results. Differences were considered significant when P<0.05, and post hoc analyses were carried out using the Tukey test to establish pairwise differences between the 8 weeks of measurements and the three periods.
(2) A principal component analysis (PCA) was designed to illustrate mixed models and highlight the relationships between dairy cow performances and rumen parameters during SARA challenge. Principal component analysis was performed on variables averaged by week for P1 (2 weeks) and P2 (4 weeks); in P3, weeks 1 and 3 were kept individually in order to study the potential of each variable to recover normal values following a SARA challenge. To eliminate high inter-animal variability and also to discover useful information with the PCA, an individual normalization cow by cow was implemented. To deal with missing row values of non-fistulated cows, the imputation approach described in Josse and Husson (Reference Josse and Husson2012) was applied. Principal component analysis performed only with the results from the six fistulated cows showed similar scores and loading plots.
(3) A receiver operating characteristic (ROC) to evaluate the potential interest of absolute and relative rumen pH indicators as a prognostic test for SARA (Greiner et al., Reference Greiner, Pfeiffer and Smith2000). Sensitivity of the test was the probability of a positive test given that a cow would be in SARA challenge; specificity was the probability of a negative test given that a cow would not be in SARA challenge. Overall accuracy of the indicators in detecting SARA was represented by AUC with a 95% confidence interval. Best cut-off point was defined as the maximum sum of sensitivity and specificity. Receiver operating characteristic analyses were performed on all the subsequent rumen pH indicators from reticulo-rumen sensors in which weekly means of P1 (2 weeks) and P3 (2 weeks) (LSD) with weekly means of P2 (4 weeks) (HSD) were differentiated. All calculations were performed by using the statistical package of the pROC test in R3.2.3 software. To compare the accuracy of pH indicators in detecting SARA syndrome, DeLong’s test was performed for each individual ROC result compared with time pH<6 as reference. A P-value<0.05 was considered statistically significant.
Results
Cow performances, rumen microbiota and fermentative parameters
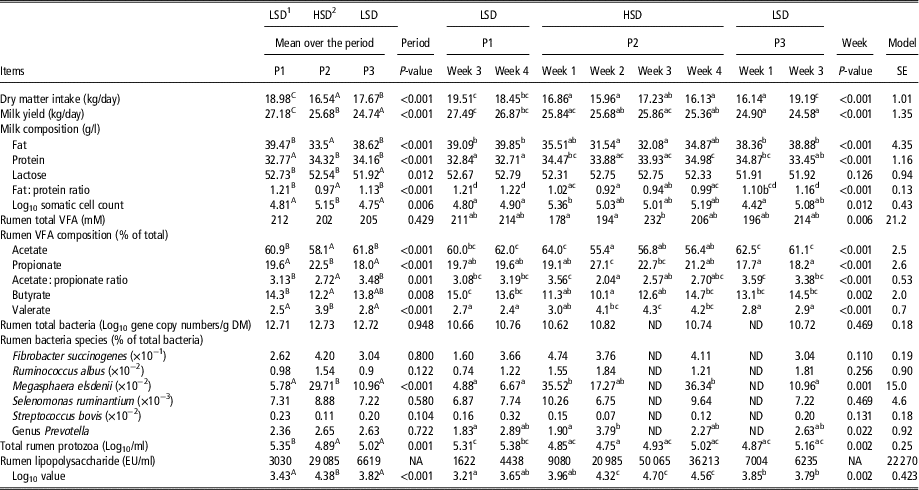
Cow performances and rumen parameters differed between periods (P<0.001; Table 2). A decrease in dry matter intake (DMI) was observed when cows were fed with HSD (P2) compared with LSD (P1 and P3); and on average DMI in P3 remained lower than in P1 (17.67 v. 18.98 kg/day). According to week effect, intake of the cows remained lower for each week of HSD and W1P3 in comparison with W3W4P1 except for W3P2 where intake was not different to W3P1. The lowest DMI was recorded at W2P2. Cows recovered initial W3W4P1 values of intake at W3P3.
Effect of high-starch diet on dairy cow performances and rumen parameters

NA=not applicable because the statistical analysis was conducted on natural Log10 data; ND=not determined; SE=standard error of the global model.
A,B,CWithin a parameter, values with different superscripts differed when the period effect was significant (P-value<0.05).
a,b,c,dWithin a parameter, values with different superscripts differed when the week effect was significant (P-value<0.05).
1 Low-starch diet (LSD): 32% concentrate+68% forage, containing 13% of starch.
2 High-starch diet (HSD): 54% concentrate+46% forage, containing 35% of starch; 8-week measurements were performed: 2 weeks in period 1 (P1): W3P1, W4P1; 4 weeks in period 2 (P2): W1P2, W2P2, W3P2, W4P2; and 2 weeks in period 3 (P3): W1P3, W3P3.
A continuous decrease of milk yield was observed during the three periods of the experiment (P<0.001). Milk fat : protein ratio was inverted (<1) when cows were fed with HSD (P<0.05) and significantly lower than cows were fed with LSD. According to the week effect, the lowest fat : protein ratio was recorded during W2P2. Somatic cell count concentration was higher when cows were fed with HSD compared with LSD and a maximum concentration was observed during W1P2.
High-starch diet did not affect the concentration of total VFA compared with LSD, but significant variations among weeks of HSD were observed (P<0.05). According to the week effect (P=0.006), VFA concentration of W3P2 was greater than W1W2P2. Acetate : propionate ratio was below 3 when cows were fed with HSD (P<0.001), and significantly higher with LSD. The lowest ratio was measured in W2P2 (2.04). An increase in valerate proportion was observed when HSD was distributed in comparison with LSD. The highest value of valerate was measured in W3P2. A decrease (P=0.008) in butyrate proportion was noted during HSD distribution compared with P1 (LSD) and initial values did not completely recover during P3. According to the week effect, the lowest value of this parameter was observed in W2P2.
No significant variations of F. succinogenes, Ruminococcus albus, S. ruminantium and S. bovis were observed according to week and period effects. HSD did not affect the proportion of the genus Prevotella compared with LSD, but significant variations among weeks of HSD were observed (P<0.05). The percentage of the genus Prevotella was significantly higher (3.79% of total bacteria) in W2P2 compared with W1P2 (1.90% of total bacteria) of HSD.
Higher Megasphaera elsdenii proportions were observed when cows were fed with HSD in comparison with LSD. For total protozoa, a decrease was observed in P2 compared with P1 and initial values did not recover during P3. According to the week effect, a lowest value of total protozoa was observed in W2P2 in comparison with W3W4P1.
Relationships between dairy cow performances and rumen parameters
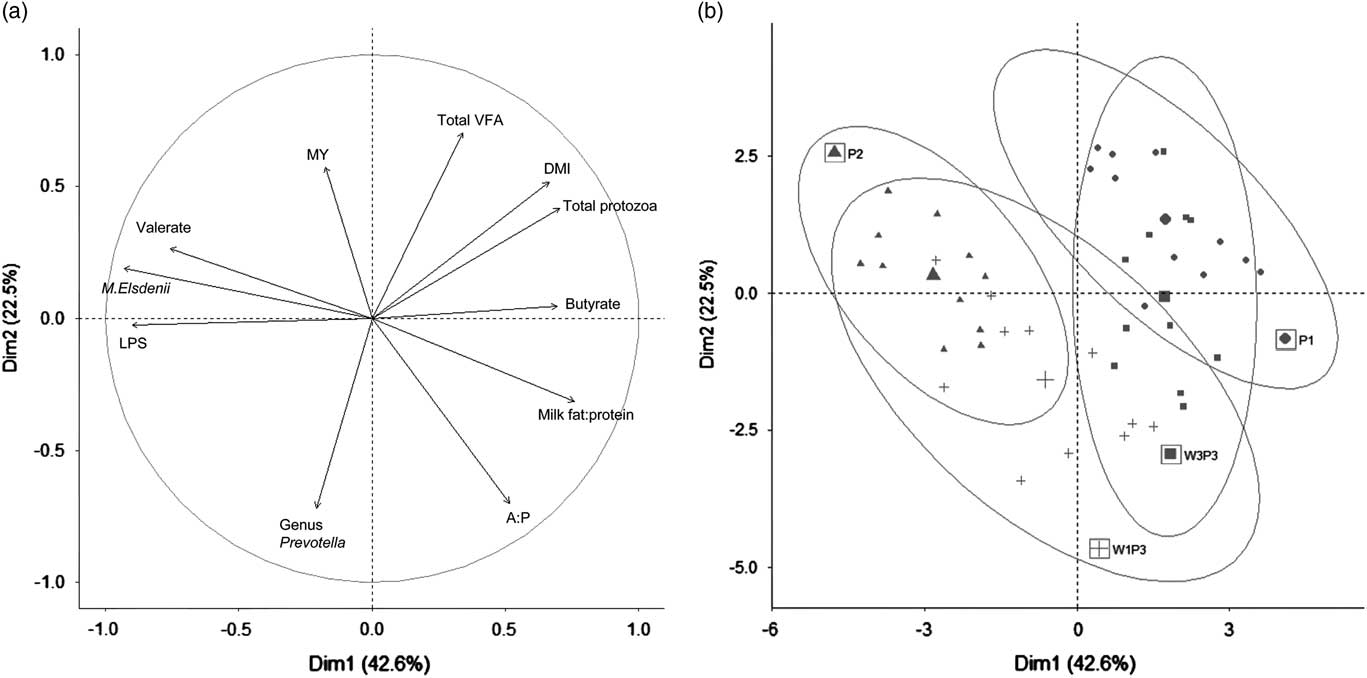
The first and second principal components (Dim1 and Dim2, respectively, 42.6% and 22.5%, Figure 2) of the PCA described 65.1% of the total variability in cow performances and rumen parameters observed throughout the experiment (P1 to P3). Observations of P1, P2 and W3P3 were mainly distributed along the Dim1 axis, with a negative correlation with Dim1 for P2, whereas P1 and W3P3 overlapped and clustered positively to Dim1. Lipopolysaccharide concentration and proportions of valerate and M. elsdenii were negatively correlated with Dim1, whereas DMI, milk fat : protein ratio, proportion of butyrate and concentration of total protozoa clustered positively to Dim1. A combination of variables was also able to describe clearly P1 and W3P3 v. P2: milk fat : protein, and A:P ratios, DMI, total protozoa, butyrate and valerate proportions. Butyrate proportion, milk fat : protein, and A : C ratios decreased during P2, whereas LPS concentration and valerate proportion increased. The W1P3 observations overlapped in P2 and P1.
Principal component analysis (PCA) of dairy cow performances and rumen parameters. Results of PCA presented as (a) loading plot of the different variables, (b) score plot mean of 11 dairy cows (mean of weeks 3 and 4 in two observations/cow for period 1 (P1), mean of 4 observations/cow for period 2 (P2) and individual observation/cow for week 1 of period 3 (W1P3) and week 3 of P3 (W3P3)). The PCA was designed to illustrate mixed model results, and missing values were regenerated as described in Josse and Husson (Reference Kaur, Garcia, Horadagoda and Fulkerson2012). MY=milk yield; DMI=dry matter intake; VFA=volatile fatty acid; LPS=lipopolysaccharide; A : P=acetate : propionate ratio.

Reticulo-rumen pH indicators
During P1, the signal of one reticulo-rumen pH sensor was irrecoverable in one non-fistulated cow, therefore, for all rumen pH variables, 10 cows were taken into account.
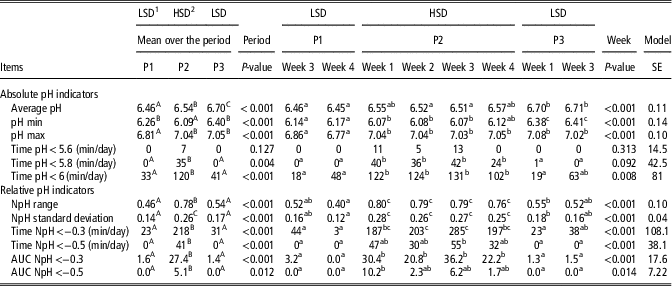
A high inter-animal variability and/or calibration inaccuracy was observed in individual daily pH average in P1, starting from 6.1 to 6.7 among dairy cows. Average pH increased in the three periods (6.46, 6.54 and 6.70 for P1, P2 and P3, respectively, P<0.001; Table 3). Minimum pH was lower when cows received HSD (6.09) compared with LSD in P1 (6.26) and in P3 (6.40). A pH sensor drift was observed during the experiment (0.025 pH units/week). This drift was modelled using an 8-week moving average and then removed from the raw kinetics, thus producing normalized kinetics. Some high-frequency noise was observed as random negative peaks of pH. Normalized kinetics were smoothed using a 180-min moving average, thus producing filtered-normalized kinetics.
Effect of high-starch diet on reticulo-rumen pH subacute ruminal acidosis indicators

SE=standard error of the model; AUC=area under the curve.
A,B,CWithin a parameter, values with different superscripts differed when the period effect was significant (P-value<0.05).
a,b,cWithin a parameter, values with different superscripts differed when the week effect was significant (P-value<0.05).
1 Low-starch diet (LSD): 32% concentrate+68% forage, containing 13% of starch.
2 High-starch diet (HSD): 54% concentrate+46% forage, containing 35% of starch; 8-week measurements were performed: 2 weeks in period 1 (P1): W3P1, W4P1; 4 weeks in period 2 (P2): W1P2, W2P2, W3P2, W4P2; and 2 weeks in period 3 (P3): W1P3, W3P3.
SARA indicators from raw kinetics: during P2, more time spent pH<5.8 was observed (35 min/day) in comparison with P1 and P3 (0 min/day) (P=0.004). The same result was observed for pH 6 threshold with more time spent pH<6 in P2 (120 min/day) in comparison with P1 (33 min/day) and P3 (41 min/day) (P<0.001). The values of these indicators peaked during W3P2.
SARA indicators from filtered-normalized kinetics: NpH range, standard deviation, time and AUC under relative thresholds of NpH−0.3 and −0.5 were increased significantly (P<0.001) when cows were fed with HSD compared with LSD. The highest values of the NpH range (0.80) and NpH standard deviation (0.28) were noted in W1P2. More time spent under NpH thresholds of −0.3 (285 min/day) and −0.5 (55 min/day) were observed in W3P2. The highest values of the AUC under NpH thresholds of −0.3 (36.2) and −0.5 (6.2) were also observed in W3P2.
Receiver operating characteristic
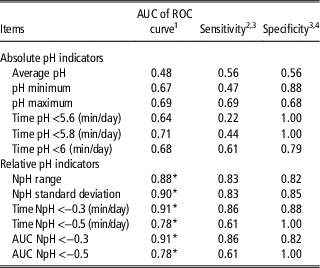
For all absolute pH indicators (Table 4), the AUC of ROC curves were lower than 0.71. Time pH<6 indicator had an AUC of 0.68 and 61% (sensitivity) of the results when cows were fed with LSD were classified as non-SARA, whereas 79% (specificity) of the results when cows were fed with HSD were classified as SARA. For average pH, the ROC AUC was lower than 0.5, demonstrating that the test cannot distinguish between animals fed HSD and animals fed LSD.
Receiver operating characteristic test on both absolute and relative reticulo-rumen pH subacute ruminal acidosis indicators

AUC=area under the curve; ROC=receiver operating characteristic.
ROC test performed on mean indicator pH results for W3P1, W4P1, W1P3 and W3P3 as health status, as opposed to W1P2, W2P2, W3P2, W4P2 as subacute ruminal acidosis (SARA) disease.
1 Area under the curve of the ROC.
2 The probability of a positive test given that the cow is in SARA conditions.
3 According to the best cut-off point defined as the maximum sum of sensitivity and specificity.
4 The probability of a negative test given that the cow is not in SARA conditions.
*AUC significantly different from time pH<6 (P<0.05, DeLong’s test for two correlated ROC curves).
For relative pH indicators, the highest AUC of ROC curves (0.91) was found for time NpH<−0.3 and for its AUC. Both sensitivities were 86% and specificity values were above 82%. DeLong’s test indicated higher AUC of ROC curves for relative pH indicators compared with time spent under pH 6 (P<0.05).
Discussion
We have investigated the extent to which relative pH indicators can help to improve the diagnosis of SARA in dairy cows. Since SARA has historically been characterized by rumen pH depression, the measurement of this indicator is still considered as the ‘gold’ standard in diagnosing this nutritional disease (AlZahal et al., Reference AlZahal, Kebreab, France and McBride2007). Single-point measurements of rumen pH were most commonly used until the rumen sensor was commercialized, and it has been clearly demonstrated that rumen pH kinetics carry more relevant information on rumen conditions because of large daily pH variability (Krause et al., Reference Krause, Garrett and Oetzel2006). Therefore, monitoring rumen pH in real time is by far the most reliable technique to evaluate the risk of SARA (Penner et al., Reference Penner, Beauchemin and Mutsvangwa2007). In our study the absolute daily average pH did not decrease during SARA. Even if animals spent longer time under pH 5.8 and 6 during SARA, the lengths of time are clearly low compared with previous studies. For instance, Zebeli et al. (2008) reported an average of more than 320 min/day to define SARA, whereas in our study animals spent only 35 min/day under pH 5.8. Based only on daily average and pH thresholds established by previous studies to diagnose SARA, one may conclude that in our experiment cows did not experience SARA when they were fed HSD (P2). Nevertheless, cow performances and rumen parameters during the experiment clearly showed that the animals had other commonly described signs of SARA.
The high level of non-fibre carbohydrate in the HSD induced an increase in the rumen rate of carbohydrate fermentation and triggered rumen disorders confirmed by changes in performance data and rumen fermentative parameters. For instance, reduced DMI, altered milk production, decreased fat : protein ratio and increased SCC demonstrated that HSD had a consistent negative impact on cow performance in comparison with LSD as previously described (Plaizier et al., Reference Plaizier, Krause, Gozho and McBride2008; Kleen and Cannizzo, Reference Kleen and Cannizzo2012). Nevertheless, it is well known that not all of these parameters are specific to SARA and the variation of each parameter can appear at different time during SARA syndrome. Therefore, a combination of several parameters would be more appropriate and reliable in confirming acidotic conditions for cows fed HSD. Principal component analysis of all cow performance variables and rumen fermentative parameters clearly demonstrates the separation between P1 and W3P3 v. P2 and distinguishes the two contrasted conditions highlighting SARA syndrome in P2. These results confirm that absolute pH indicators have several limitations for SARA detection.
In a harsh environment like reticulum where rumen fluid could slowly diffuse into the sensor and poison the reference electrode, drift (Dt) and noise (Nt) are frequently observed (Kaur et al., Reference Kaur, Garcia, Horadagoda and Fulkerson2010). In our experiment, both Dt and Nt were detected from the data of 10 sensors. This long-term drift started at day 29 and lasted until the end of the study. In addition, we observed large initial between-animal variability in daily average rumen pH, starting at 6.1 to 6.7, with a standard deviation of 0.25 pH units in P1. Consequently, absolute rumen pH changes in SARA syndrome also appear to vary greatly, as reported in several studies (Schwartzkopf-Genswein et al., Reference Schwartzkopf-Genswein, Beauchemin, Gibb, Crews, Hickman, Streeter and McAllister2003; Penner et al., Reference Penner, Beauchemin and Mutsvangwa2007; Mohammed et al., Reference Mohammed, Stevenson, Weimer, Penner and Beauchemin2012). It is also well known that reticulo-rumen pH is higher than rumen pH, consequently it appears necessary to adapt SARA detection thresholds in respect to localization and pH measurement techniques (Sato et al., Reference Sato, Ikeda, Tsuchiya, Ikuta, Murayama, Kanehira, Okada and Mizuguchi2012). Moreover reticulo-rumen sensors provides high-resolution pH kinetics that needs to be analysed in a standardized manner to obtained accurate and comparable SARA thresholds.
In the present study we aimed to propose a standardization of pH monitoring and signal processing from rumen pH sensors. Our first action was to use weighted reticulo-rumen sensors so they may always be located within the reticulum in order to avoid pH variations due to localization. Therefore, we do not advise the use of floating rumen pH sensors. At the end of the experiment the six sensors inserted in fistulated cows were recovered as expected in the reticulum. We also made the choice to apply a mathematical correction of the raw pH kinetics in order to establish more consensual SARA pH indicators. Taken together, the pH drift and noise associated with inter-animal variability clearly explained why the absolute average pH was not altered by SARA and why animals spent little time below thresholds of pH 5.8 or 6, compared with previous studies. Our approach using relative pH seems to be relevant and would allow more confident comparisons between studies, farms or animals in determining SARA syndrome. This approach would then allow the definition of relative pH thresholds and other accurate indicators such as range and standard deviation of daily rumen NpH during HSD.
A classification of both relative and absolute pH indicators was performed with a ROC test to establish their ability to detect SARA induced in our experimental conditions. The ROC AUC of absolute daily average pH (0.48) represents 0 discrimination, so using this indicator to detect SARA was non-informative. Numerous authors have reported that averaged pH values are not affected by large dietary changes. For example, Kennelly et al. (Reference Kennelly, Robinson and Khorasani1999) did not observe a significant drop in rumen pH when concentrate was increased from 50% to 75% in the diet. The ROC test also showed that other absolute pH indicators have good specificity but low sensitivity. In such a case, a false prediction of SARA would rarely be made (low proportion of false positives), but many of the cows that actually have SARA would be missed (high proportion of false negatives). The relative pH indicators that we calculated appear to have greater ROC AUC values (P<0.05) compared with absolute parameters. According to the ROC AUC classification established by Gardner and Altman (Reference Gardner and Altman1989), NpH range (AUC=0.88) and NpH standard deviation (AUC=0.90) were good (0.81 to 0.90) at diagnosing SARA syndrome in our experimental conditions, whereas time and AUC NpH<−0.3 (AUC=0.91) were classified as excellent (0.91 to 1.0). Those indicators expressed in relative thresholds gave more true positives and fewer false positives and consequently are able to improve diagnosis of SARA in dairy cows.
Conclusion
During experimental SARA, we demonstrated that common absolute pH indicators do not allow detection of SARA because of their strong limitations (sensor drift, noise and animal variability). A new approach to signal processing of rumen pH kinetics was proposed in order to highlight relative changes in pH values instead of dealing with absolute pH values. Relative pH indicators overcoming drift, noise and inter-animal variability were then proposed and evaluated. We show that time or AUC of NpH<−0.3 were the most relevant pH indicators in detection of SARA. This demonstrates that rumen pH sensors provide high-resolution pH kinetics, which are of great interest in detecting SARA if rumen pH is analysed properly. This approach needs to be confirmed by further studies with other acidotic diets and more animals in order to determine precisely threshold of each relative pH indicator. Moreover, the individual initial rumen pH pattern should be taken into consideration to create SARA thresholds adapted to each animal. This kind of rumen pH analysis could be of great value in enhancing precision livestock farming.
Acknowledgements
The present research (PhD) of Clothilde Villot was financially supported by Valorex, Terrena and Lallemand. The authors thank the personnel of the INRA experimental unit (Herbipôle) for cow welfare, feeding and sampling. The authors particularly thank Lucette Genestoux, Clothilde Dos Santos and Aurélie Ameilbonne (Lallemand) for skilled technical assistance and Diego Morgavi for reviewing this paper thoroughly.