I. INTRODUCTION
Owing to its ability to rapidly form or remove oxygen vacancies,Reference Campbell and Peden1 ceria has many applications, including acting as a catalyst on its own. When used as a support for precious metal catalysts such as platinum, this ability protects the metal surfaces from CO poisoning.Reference Gorte and Zhao2 In addition, a strong metal–support interaction (SMSI) effect is present when ceria is used as a support.Reference Tauster, Fung and Garten3 It has been well known that noble metal-/ceria-based systems demonstrate increased activities for hydrogenation reactions,Reference Sepúlveda-Escribano, Coloma and Rodríguez-Reinoso4 water–gas shift reactions,Reference Gorte and Zhao2, Reference Fu, Saltsburg and Flytzani-Stephanopoulos5, Reference Yeung, Yu, Fu, Thompsett, Petch and Tsang6 CO oxidation, hydrocarbon oxidation,Reference Murray, Tsai and Barnett7 and other industrially important reactions.
Apart from the synergistic effects of SMSI mentioned above, the major role of a metal oxide support is to disperse nanoparticles of noble metal catalysts. This is the most common motivation in heterogeneous catalyst where surface area in contact with reagents is maximized. By introduction of mesopores in the oxide support and dispersing the noble metal nanoparticles in the mesopores, the mesoscopic confinement limits the growth of nanoparticles and gives rise to unusual thermal stabilityReference Hornebecq, Antonietti, Cardinal and Treguer-Delapierre8, Reference Sun, Ma, Zhang, Liu, Han, Bao, Weinberg, Pfänder and Su9 and selectivity.Reference Niederer, Arnold, Hölderich, Spliethof, Tesche, Reetz and Bönnemann10 The synthesis of ordered mesoporous ceria or doped ceria by soft template method, however, is restricted to low temperature. High temperature environment leads to collapse of the pore structure. Hard template methods can take place at high temperature and allow formation of crystalline mesostructure that leads to better thermal stability. If the metal loading in the mesoporous support increases, the metal nanoparticles would gradually percolate and form an electron-conducting pathway. This would be useful in applications such as composite electrodes for solid oxide fuel cells (SOFC).
The hard-templating or nanocasting strategy has become popular in the last decade.Reference Yang, Shi, Tian, Lu, Gao, Xie, Fan, Yu, Tu and Zhao11–Reference Guo, Yang, Liu, Cheng and Chao22 In these methods, a mesoporous silica network was first synthesized using surfactantsReference Zhao, Yang, Melosh, Feng, Chmelka and Stucky23, Reference Kim, Kleitz, Paul and Ryoo24 and then used as templates to synthesize highly crystalline ordered mesoporous materials with nanometer pore size and wall thickness.Reference Yang, Shi, Tian, Lu, Gao, Xie, Fan, Yu, Tu and Zhao11, Reference Jiao, Zhang, Yue, Ren, Liu, Yan, Dickinson, Zhou and He14–Reference Rossinyol, Pellicer, Prim, Estradé, Arbiol, Peiró, Cornet and Morante21, Reference Rossinyol, Arbiol, Peir, Cornet, Morante, Tian, Bo and Zhao25–Reference Shi, Guo, Corr, Shi, Hu, Heier, Chen, Seshadri and Stucky28 These mesoporous metal oxides are strong enough to be self-supportive and usually have specific surface area comparable to nanoparticles whose size is similar to their wall thicknesses. One common feature of these templated metal oxides is that they are highly textured or single-crystal-like.Reference Dickinson, Zhou, Hodgkins, Shi, Zhao and He15 In this study, we demonstrate a novel synthesis route for a composite synthesized by impregnating Pt nanoparticles into ordered mesoporous gadolinium-doped ceria (GDC)—(OMG)—which is template synthesized from KIT-6 silica. Both OMG and Pt–OMG composite demonstrate good thermal stability.
II. EXPERIMENTAL
A. Synthesis of KIT-6 silica templates
The KIT-6 synthesis procedure is adopted from the literature.Reference Kim, Kleitz, Paul and Ryoo24 In a typical synthesis, 8.4 g of Pluronic P123 (P123) and 15.3 g of 37% HCl were mixed in 289.5 g of 18.2 MΩ deionized water by stirring at 35 °C for 3 days, allowing P123 to self-assemble. 10.8 g of n-butanol (BuOH) was then added under continuous stirring at 35 °C for 3 h before 27.6 g of tetraethyl orthosilicate (TEOS) was added. Three different BuOH:TEOS ratios were used. The mixtures were stirred for 24 h at 35 °C and then transferred to Teflon-lined stainless steel vessels for hydrothermal treatment. The sealed vessel was heated for 24 h at different temperatures of 40, 60, 80, and 100 °C. The hydrothermal synthesis products were filtered and dried in air at 60 °C for 24 h before calcination at 550 °C for 6 h in a vented top hat furnace to burn off all surfactants. The end products were white powders, which wet spontaneously upon contact with water.
B. Synthesis of OMG
Stoichiometric amount of cerium nitrate hexahydrate [Ce(NO3)3·6H2O] and gadolinium nitrate hexahydrate [Gd(NO3)3·6H2O] was dissolved in 18.2 MΩ deionized water forming a saturated solution, with a target composition of Ce0.8Gd0.2O2−δ. Since water of crystallization in the starting salt was uncertain, the actual amount of water was determined by thermogravimetric analysis and the ratio of starting materials was adjusted accordingly. The bisolvent method was usedReference Jiao, Zhang, Yue, Ren, Liu, Yan, Dickinson, Zhou and He14 to fill the precursor solution into a mesoporous silica template. For a typical synthesis, 6 g of KIT-6 silica powder was dispersed in octane. The suspension was stirred for 3 h before 4.08 mL of saturated precursor solution was added according to the predetermined pore volume of the KIT-6 template. Once all the precursor solution entered the mesopores, the template particles sank to the bottom of the beaker. The mixture was retrieved and dried at 60 °C in an air oven for 1 h. The dried powder was calcined in a vented top hat furnace at 550 °C for 6 h to decompose the precursor to an oxide. Up to five multiple impregnations have been carried out to increase the GDC loading and the change in pore size distribution was monitored. Before each impregnation, the amount of precursor solution needed was calculated according to the previous pore volume and added product weight. After impregnated with GDC, the silica template was removed by multiple washes with a large amount of hot 2 M NaOH solution, followed by 10 washes of deionized water–ethanol mixture, and dried in oven overnight.
To study the thermal stabilities of these ordered mesoporous GDC (OMG), selected powder was annealed at various temperatures. Annealed samples were characterized by N2 sorption and high-resolution transmission electron microscopy (HRTEM) measurements.
C. Impregnation with platinum
The OMG was mixed with (1,5-Cyclooctadiene)dimethylplatinum(II) denoted by (COD)Me2Pt(II), 99% purity, from Strem Chemicals Inc. (Newburyport, MA) at 1:1 weight ratio in an agate mortar. The mixture was then transferred to an alumina crucible boat placed in a tube furnace. The heating ramped from room temperature to 240 °C at 5 °C/min in a flow of ammonia at 200 mL/min and held for 2 h before switching to hydrogen gas and raising the temperature to 390 °C at the same ramp rate. After 2-h dwelling, the setup was cooled down in hydrogen. The process was repeated to increase the platinum loading. Weighing and wide-angle XRD patterns were used to estimate the loading. A separate sample was prepared with the Pt precursor placed upstream of OMG showing impregnation via vapor phase.
D. Material characterization
N2 sorption measurements with Brunauer-Emmett-Teller (BET) surface area calculations were carried out on a Micromeritics ASAP 2020 instrument (Norcross, GA). Wide-angle powder x-ray diffraction (PXRD) and small-angle x-ray scattering (SAXS) x-ray diffraction (XRD) patterns were obtained with a Bruker D8 powder diffractometer (BRUKER AXS, Inc., Madison, WI). HRTEM was performed with a FEI Tecnai G2 20 S-TWIN (North America NanoPort, Hillsboro, OR) and JEOL 2010F (JEOL Ltd., Tokyo, Japan), which has field emission gun (FEG). Field emission scanning electron microscopy (FESEM) was performed with a Hitachi S-4800 (Hitachi High Technologies America, Inc., Dallas, TX) to image the morphology of the OMG particles. Since both OMG and imbedded Pt are polycrystalline with similar cubic lattice structures, cross sections were needed to reveal the distribution of Pt. They were prepared by first mounting the sample powder with epoxy between two pieces of Si wafer. The assembly was then mechanically polished, followed by low-angle ion beam milling using a Fischione Model 1010 (E.A. Fischione Instruments, Inc., Export, PA).
III. DISCUSSION
In the past 15 years, there have been reports of successful synthesis of ordered mesoporous metal oxides and mixed oxides. It is widely accepted that the rigid support of silica allows crystallization of metal oxides without a collapse of the ordered structure. By using hard templates of different geometries, the mesopore size of the support can be tailored easily. KIT-6 was chosen as template because its structure is isotropic with a larger pore size that would offer better thermal stability with a thicker templated structure.
A. Synthesis of OMG
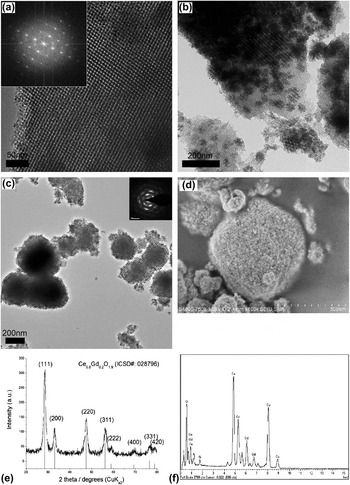
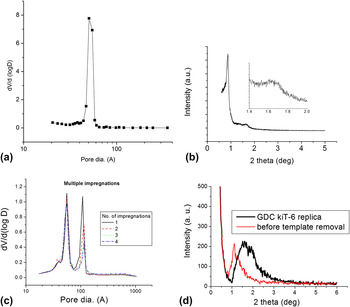
The KIT-6 silica has two identical sets of intertwining channels which are offset in space by half a unit cell. The channels are separated by a silica wall that follows exactly the gyroid surface (G surface), which is an infinite periodic minimal surface.Reference Schoen29Figure 1(a) shows a transmission electron microscope (TEM) micrograph of the KIT-6 silica template with corresponding Fast Fourier transform (FFT) in the inset. One can observe a cubic pattern that corresponds to the (100) plane of the gyroid structure. The pore sizes of KIT-6 silica samples were determined by N2 sorption and their distribution is shown as an example in Fig. 2(a) and summarized in Table I.
HRTEM of (a) a typical KIT-6 silica template with FFT shown in the inset, (b) a partly filled template with GDC, and (c) OMG with bimodal pore size distribution after 2 M NaOH washes with selected area electron diffraction in the inset. FESEM image of OMG with electron deceleration down to 1 kV is shown in (d). PXRD and EDX of OMG are shown (e) and (f), respectively.

Pore size distribution of a typical KIT-6 silica template (a) and OMG after various number of impregnations (c) determined from N2 sorption. Their corresponding SAXS are shown in (b) and (d), respectively.

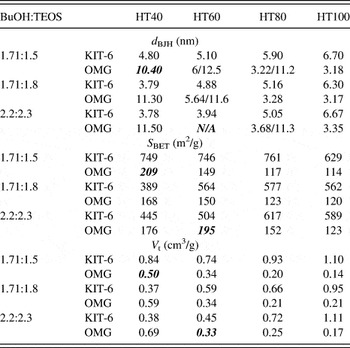
N2 sorption result summary of KIT-6 and their corresponding OMG for three BuOH:TEOS ratios and fixed ratio of 0.017 P123:1.83 HCl:195 H2O. d BJH is the modal pore diameter calculated from BJH desorption, S BET is the calculated BET specific surface area, and V t is the pore volume at relative pressure of 0.95. The quantities in bold italics refer to samples with collapsed structures.

After a maximum of five impregnations of GDC, significant filling of 33–38 vol% was achieved, as determined by weight changes. Figure 1(b) shows that there was still plenty of unfilled space even after five impregnations. The as-synthesized OMG had particle size between 100 and 500 nm, as shown by TEM in Fig. 1(c) and FESEM in Fig. 1(d). No large GDC particles were found in HRTEM images, which suggest that the bisolvent method of impregnation was effective in forcing precursor into mesopores. Figure 1(e) shows the XRD pattern of the OMG with a good match of polycrystalline Ce0.8Gd0.2O2−x (ICSD Card No. 028796) with a lattice parameter of 5.42 Å. In attempt to control the ordered structures of the OMG, a total of 12 sets of samples from three different recipes and four hydrothermal treatments with varying temperature were used. The results are summarized in Table I. The trend in the changes of structures is identical to that reported by Kim and Solovyov.Reference Kim and Solovyov26 Compared to the hydrothermal temperature, the BuOH:TEOS ratio had a small effect over surface area and pore geometry. The OMG had a pore volume varying between 0.14 and 0.69 cm3/g, where their corresponding specific surface area varied between 114 and 176 m2/g. An interesting bimodal distribution of pore sizes was observed, as shown in Table I. This is also shown in TEM of Fig. 1(c) and N2 sorption pore size distribution of Fig. 2(c). The ordered mesostructure of OMG did not show significant peaks in SAXS [Fig. 2(d)] due to smaller particle sizes compared to that of KIT-6 silica, which were in the micrometer range. Similar observations were reported by Kim and SolovyovReference Kim and Solovyov26 for carbon and Jiao et al.Reference Jiao, Hill, Harrison, Berko, Chadwick and Bruce18 for nickel oxide. Jiao et al. hypothesized that the bimodal distribution was caused by a lack of micropores connecting the two intertwined channels. When precursor could access both adjacent channels, i.e., via the connecting micropores, templated GDC would have a wall thickness equivalent to the pore size of the template and a pore size equivalent to the wall thickness of the KIT-6 template. On the other hand, when precursor could not access both channels, one of the channels would be filled. The product would still have a wall thickness equivalent to the pore size of the template, but the pore size would be equivalent to the size of an unfilled channel plus two wall thicknesses of the template.
To verify the hypothesis, a separate batch of sample was prepared with an identical procedure. The OMG obtained after one to four impregnations were characterized by N2 sorption. The Barret-Joyner-Halenda (BJH) desorption pore size distributions were summarized in Fig. 2(c). When a hydrothermal temperature of 60 °C was used during the synthesis of KIT-6, few micropores were created. Additional impregnation increased the filling of adjacent channels. This explains the stepwise decrease in the volume of the larger set of pores.
B. Silica residue
The biggest disadvantage of the hard-templating route is in the extra step of template removal. Silica residue may be a minor issue for the materials to be used as catalyst. It must, however, be considered for applications such as SOFC. The adversary effects of silica residue on ionic conductivity were well reported, and its presence was a major cause of ionic conductivity drop in solid electrolytes such as GDC.Reference Zhang, Ma, Chan, Hing and Kilner30 Despite the claim of complete removal of silica using NaOH in a similar study of silica-templated GDC,Reference Rossinyol, Pellicer, Prim, Estradé, Arbiol, Peiró, Cornet and Morante21 silica could not be fully removed in this study by hot NaOH after 10 washes. Attempts of other etching methods, e.g., HF, also failed to completely remove silica without damaging the GDC. Typical energy-dispersive x-ray spectroscopy (EDX) of the OMG [Fig. 1(f)] showed significant amount of 8–10 at.% could be present.
C. Platinum impregnation
Impregnation or infiltration via vapor phase was first performed for filling much larger pores in carbon.Reference Bickerdike, Brown, Hughes and Ranson31, Reference Besmann, Sheldon, Lowden and Stinton32 In recent years, due to industrial scale production of high purity organometallic compounds, organometallic chemical vapor deposition (CVD) of noble metals became possible. Vapor phase impregnation of mesoporous material such as SBA-15 has been demonstrated.Reference Lee, Lee and Cheon33, Reference Zhang, Lam, Hu, Yan and Sheng34
(COD)Me2Pt(II) was expected to melt at 103–105 °C, and the molten precursor would vaporize to fill adjacent space. The cyclooctadiene ligand was expected to dissociate below 200 °C, and the lone pair of the remaining fragment would attach to the GDC surface and decompose to form Pt metal. The molten precursor was also expected to fill the pore channels by capillary force if contacted with the porous substrate. This provided a second route for impregnation.
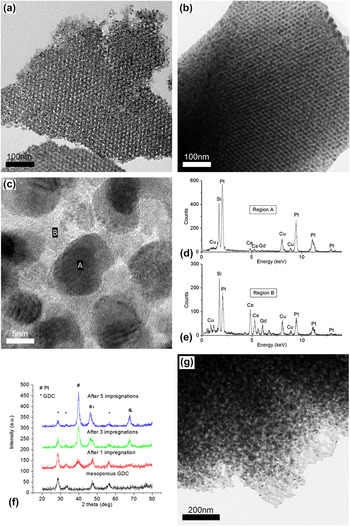
It can be seen from Figs. 3(a) and 3(b) that Pt loading increased with increasing number of impregnations. After five impregnations, the mesopores of OMG filled 38% of the total pore volume, V t, as estimated from weight change equivalent to GDC:Pt mass ratio of 1:3. The incremental increase of Pt filling with number of impregnations was supported by EDX analysis performed during FEG HRTEM [Figs. 3(c)–3(e)]. It was also supported by increasing relative intensity of Pt peaks in the XRD patterns of Fig. 3(f). As shown in Fig. 2(g), a much lower degree of filling was observed for OMG impregnated strictly in the vapor phase. Only a GDC:Pt mass ratio of 1:1 was achieved, equivalent to 19 vol% filling of the OMG after eight impregnations. This implied that liquid phase was the major mode of impregnation and contributed more than half of the total amount of Pt impregnated. However, in a fully automated CVD system operating under cyclic mode, Pt loading through vapor phase deposition would be convenient and easier to scale up.
FEG HRTEM images showing the cross section of Pt–OMG after (a) one and (b) five impregnations with higher magnification of (b) shown in (c); EDX performed on selected region of A and B shown in (d) and (e). PXRD of Pt–OMG after one, three, and five Pt impregnations in (f) showing increased intensity of Pt peaks and (g) HRTEM image showing sample cross section after eight Pt impregnations by vapor phase deposition alone.

Owing to the specific geometry of OMG, the distribution of Pt was estimated by HRTEM imaging of the sample cross sections [Figs. 3(a)–3(c) and 3(g)]. The seemingly bicontinuous structure in Fig. 3(b) was very difficult to confirm due to the complexity of the gyroid geometry. Percolation of the Pt nanoparticles depends on their shape and sizes. Further electrical measurements will be needed to determine the continuity of the Pt network.
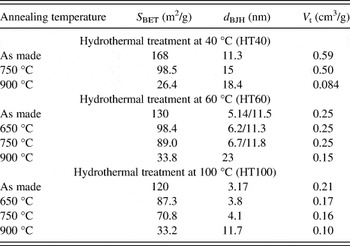
D. Thermal stability
There are major concerns regarding the use of nanoparticles and nanostructures at high temperature as they tend to agglomerate and sinter. To study the thermal stability of the as-synthesized structure, selected OMG and Pt–OMG samples were annealed at various temperatures in air. Table II summarizes the changes in OMG’s morphology after annealing. The trend of decreasing surface area with increasing annealing temperature was expected since surface tension is a driving force in sintering. For the three samples tested, the total pore volume did not change appreciably until 900 °C. There was no correlation between specific surface area, modal pore diameter distribution, and the total pore volume. Contrary to our expectation, mesopores did not collapse at 900 °C when sintering of OMG completed.
Summary of N2 sorption results for selected OMG synthesized from KIT-6 with different hydrothermal treatment temperatures before and after annealing. d BJH is the modal pore diameters calculated from BJH desorption, S BET is the BET specific surface area, and V t is the pore volume at relative pressure of 0.95.
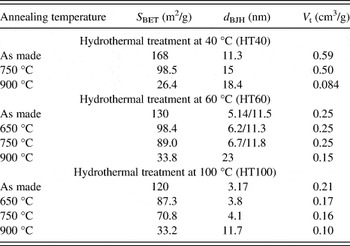
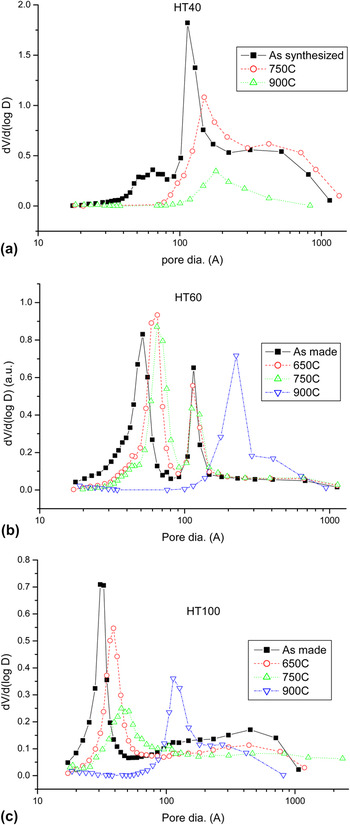
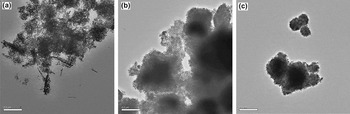
The annealed OMGs were synthesized from KIT-6 using BuOH:TEOS ratio of 1.71:1.8. They were denoted by the corresponding KIT-6 hydrothermal treatment temperatures at 40, 60, and 100 °C as HT40, HT60, and HT100, respectively. The HT40 sample had a larger set of pores as shown in Fig. 4(a). Without heat treatment, the HT40 curve had a shoulder beyond 30 nm suggesting that its structure was not as self-supportive as the other samples. At least, part of the mesoporous structure was lost after template removal. Further structural lost was observed after thermal treatments as there is a decrease in dV/d(log D). This was evidenced by the TEM images before [Fig. 1(c)] and after [Fig. 5(a)] thermal treatment.
BJH desorption calculated pore size distribution of OMGs synthesized from KIT-6 using BuOH:TEOS ratio of 1.71:1.8 with hydrothermal treatment temperatures of (a) 40 °C (HT40), (b) 60 °C (HT60), and (c) 100 °C (HT100) before and after thermal treatment at various temperatures for 6 h.

HRTEM images of (a) HT40, (b) HT60, and (c) HT100 annealed at 750 °C for 6 h.

HT100 had both sets of channels templated, and only the smaller set of pores was observed in Fig. 4(c). For the structure with this pore size distribution, there must be numerous connections between the two intertwined GDC networks. As explained above, the lack of side channels was responsible for the development of bimodal pore size distributions. On the other hand, the presence of side channels allows the inverse gyroid to be retained leading to a single pore size. These connections were too small to be seen in TEM and would have very high specific surface area. They could disappear during sintering and caused the increase in modal pore size. Sample HT60 lied somewhere in between the two scenarios described above, as shown in Fig. 4(b). It had some side channels but insufficient to cover the entire structure. The larger set of pores with 11.5 nm diameter did not change at all during thermal treatments up to 900 °C. The smaller set increased moderately until 900 °C at which point both sets of pores collapsed. Both sets of pores retained initial geometry at least until 750 °C as shown in Figs. 5(b) and 5(c).
Among the KIT-6 templates, templates of HT100 had the largest pore size, followed by those of HT60 and HT40. Hence, corresponding OMG samples had wall thicknesses followed the same trend as the template pore size. Hence, the HT100 structure should have resisted sintering better due to its smaller specific surface area. However, the fact that V t was higher in HT60 than in HT100 and changed less suggests a larger effect of increase in number of small connections compared to the increased wall thickness. Therefore, the choice of KIT-6 recipe that changes OMG wall thicknesses would have less effect over their thermal stabilities compared to that of hydrothermal temperature.
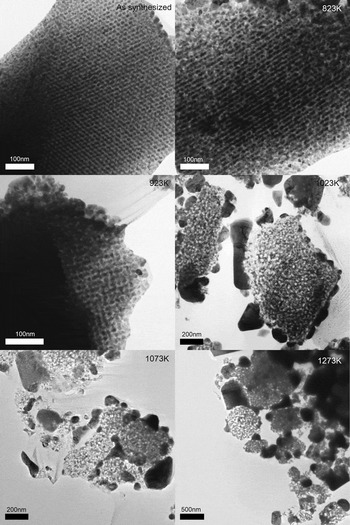
The OMG structure may not have higher surface area compared to an assembly of nanoparticles with diameter equal to the OMG’s wall thickness. The advantage of using OMG is that it maintains a stable geometry to provide a support for the Pt nanoparticles. Thermal stability of Pt–OMG composite was checked by TEM imaging of sample cross sections. The FEG HRTEM images of samples annealed at various temperatures are shown in Fig. 6. Since the OMG structure is ordered, changes in the Pt phase were well contrasted and status of Pt migration can be observed. It can be seen that the structure remained unchanged after thermal treatment at 650 °C. With heat treatment at 750 °C, Pt migrated out of the mesopores of OMG whose structure was still intact. OMG started to deform at 800 °C and lost the ordered geometry at 1000 °C.
FEG HRTEM images of Pt–OMG composite cross sections after being annealed at various temperatures for 6 h.

The SMSI between Pt and ceria should have a positive effect on catalytic activity. However, the observation above suggested that the Pt–OMG interface is thermodynamically unfavorable at temperature above 650–750 °C. This temperature threshold is close to the Tammann temperature of platinumReference Golunski35 at 750 °C but within the accuracy of the furnace temperature (±5 °C). If the observed migration temperature was actually lower, one possible explanation is the presence of impurities, which can play a role in Pt migration. It is known that for heavily doped GDC, Gd tends to concentrate on surfaces and domain boundaries. Similarly, silica residues left by the template synthesis may have also played a role at Pt migration. Therefore, the observation might not be interpreted as the Pt–ceria SMSI but a shortcoming of the synthesis technique. We cannot conclude whether the OMG support aid or prevent the mobilization of Pt nanoparticles. If the observed Pt migration near 750 °C was due to dewetting, this would be the first observation within an ordered GDC structure. The Pt migration is not an issue for applications in catalysis. But in high temperature applications such as SOFC, Pt nanoparticles would reconfigure itself to minimize contact with GDC surface and lead to performance degradation.
Loading a noble metal catalyst onto supports usually involve mixing metal precursors, followed by their decomposition. This offers little control over morphology and composition. The pore network geometry was torturous, and both the OMG and Pt phases were crystalline. It was therefore difficult to obtain a reasonable estimate of the shape and size of the Pt nanoparticles from TEM images. However, considering the Pt deposited to be confined by the OMG mesopores, it is reasonable to assume that Pt nanoparticles have sizes approximately equal to that of the OMG pore size. This is supported by the observation of Pt nanoparticles deposited in amorphous mesoporous silica. Furthermore, it can be seen from Fig. 6 that while Pt migrated out of the OMG structure at about 750 °C, the OMG structure was retained. This implies that the OMG was holding the composite structure and restricting the growth of Pt nanoparticles below this temperature. The synthesis route demonstrated here offered excellent control of Pt size distribution and overall configuration of the composite. Other attractive features are that it allows high loading per impregnation and a potentially large-scale production through automated CVD.
Pt–OMG composite is not a practical choice of material to be used for SOFCs due to high costs of Pt. However, this strategy has the potential to be applied to other composite systems. The change of wetting property of Pt over GDC is common for noble metal on supports.Reference Yu, Song, Zhang and Yang36, Reference Simrick, Kilner and Atkinson37 Similar behavior has been reported and should be dealt with care during material selection for high temperature applications. Multicomponent mixed metal oxides are the usual candidates for SOFC cathode. However, it remains a challenge to achieve high phase purity at low fabrication temperatures using vapor phase infiltration. Precursor selection and process design would be vital to its success.
IV. CONCLUSIONS
Ordered mesoporous gadolinium ceria (OMG) with an ordered structure was successfully synthesized via templating of KIT-6 silica. The dimensions and pore size distribution of OMG can be modified by the hydrothermal temperature of the KIT-6 synthesis. Highest specific surface area of 176 m2/g was archived for OMG. The OMG structures are stable up to 750 °C. Pt–OMG composite was successfully synthesized by CVD. High Pt loading of 38 vol% fill was achieved after five impregnations. The Pt–OMG composite was stable up to 650 °C.
ACKNOWLEDGMENTS
This work was supported by the Hong Kong RGC (Grant No. GRF HKU 700209P) and the HKU Development Fund for the Initiative of Clean Energy and Environment. We thank Mr. F.Y.F. Chan, Electron Microscope Unit of University of Hong Kong, and T. K. Cheung of MCPF of HKUST for their professional assistance in electron microscopy.