


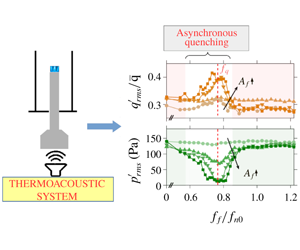
1 Introduction
Lean combustion systems are prone to high-amplitude pressure oscillations that are established due to positive feedback between the acoustic pressure fluctuations ( $p^{\prime }$) of the combustor and the heat release rate (HRR) fluctuations (
 $\dot{q}^{\prime }$) taking place inside it. The occurrence of such high-amplitude self-sustained pressure oscillations in combustors is known as thermoacoustic instability (Lieuwen & Yang Reference Lieuwen and Yang2005). The sustainability of thermoacoustic instability depends closely on the energy balance inside the combustor. The time-averaged acoustic power production is defined as
 $$\begin{eqnarray}\displaystyle {\mathcal{P}}=\frac{1}{NT}\int _{0}^{NT}p^{\prime }(t)\dot{q}^{\prime }(t)\,\text{d}t, & & \displaystyle\end{eqnarray}$$
where  $p^{\prime }$ and
 $\dot{q}^{\prime }$ are the pressure and HRR fluctuations about the mean, respectively, and
 $N$ represents the total number of cycles, each having a time period of
 $T$, with which we compute the average. The necessary conditions for the growth of acoustic energy inside a combustor are given by the modified Rayleigh criterion. It states that there is a growth in acoustic energy when: (1) the instantaneous phase difference between pressure and HRR fluctuations remains bounded such that
 $|\unicode[STIX]{x0394}\unicode[STIX]{x1D719}_{p^{\prime }\dot{q}^{\prime }}|<\unicode[STIX]{x03C0}/2$ and (2) the volume integral of acoustic power sources in the combustor is higher than the acoustic efflux (loss) across the control surface (Rayleigh Reference Rayleigh1878; Poinsot & Veynante Reference Poinsot and Veynante2005).
The problem is exacerbated by the fact that thermoacoustic systems are exceedingly complex, and are capable of exhibiting  $n$-periodic, quasiperiodic, chaotic and intermittent dynamics in addition to the comparatively well-studied limit-cycle oscillations (Juniper & Sujith Reference Juniper and Sujith2018). Thermoacoustic instability is a significant problem in gas turbine engines used for propulsion and power generation systems and can lead to critical operational failures. Thus, control strategies are crucial for extending the longevity of gas turbine engines.
1.1 Control strategies for suppressing thermoacoustic instability
Control strategies for mitigating thermoacoustic instability are classified into passive control and active control. Active control is further referred to as active closed-loop control if there is real-time feedback from the combustor to the actuator; otherwise, it is called active open-loop control.
Passive control strategies involve design changes of the combustor to either increase the net acoustic efflux or disrupt the phase relationship of the flame–acoustic interaction, or both (Richards, Straub & Robey Reference Richards, Straub and Robey2003; Noiray et al. Reference Noiray, Durox, Schuller and Candel2007). Usually, acoustic damping is increased by installing baffles, dampers and resonators. In some cases, extensive design changes may be necessary, as is exemplified by the 2000 full-scale tests that the F-1 engine had to go through before the right combination of injector–baffle configuration could be finalized (Oefelein & Yang Reference Oefelein and Yang1993). Passive control strategies are trial-and-error based, and the high cost incurred during the design and testing of passive control strategies in real-time propulsion systems proves to be a significant deterrent against this type of control strategy. However, in the absence of other viable control strategies, passive control is the most common way of dealing with thermoacoustic instability.
Active closed-loop control involves the control of thermoacoustic instability through the use of feedback mechanisms such as adaptive choker plates capable of altering upstream acoustic boundary conditions (Dowling et al. Reference Dowling, Hooper, Langhorne and Bloxsidge1988; Dowling & Morgans Reference Dowling and Morgans2005) or harmonic drivers to generate anti-phase sound, or anti-sound, at the frequency of thermoacoustic instability (Lang, Poinsot & Candel Reference Lang, Poinsot and Candel1987). Such methods have shown promise but are not used extensively in the field. Reviews on the state of the art of active control of thermoacoustic instability can be found in Docquier & Candel (Reference Docquier and Candel2002) and Zhao et al. (Reference Zhao, Lu, Zhao, Li, Wang and Liu2018).
In contrast, active open-loop control is achieved through external forcing of the thermoacoustic system and does not rely on real-time feedback from the combustor. Thus, open-loop control systems are much easier to design and are considerably cheaper. In open-loop control, high-amplitude limit-cycle oscillations are controlled by subjecting them to harmonic forcing at a frequency away from the natural frequency of oscillations. Open-loop control results in a significant decrease in the amplitude of thermoacoustic oscillations through a process known as asynchronous quenching (Guan et al. Reference Guan, Gupta, Kashinath and Li2019a; Mondal, Pawar & Sujith Reference Mondal, Pawar and Sujith2019). The term asynchronous indicates that quenching of oscillations takes place at a forcing frequency away from the frequency of limit-cycle oscillations. Although not referred to by this terminology, studies in the past (Lubarsky, Shcherbik & Zinn Reference Lubarsky, Shcherbik and Zinn2003; Bellows, Hreiz & Lieuwen Reference Bellows, Hreiz and Lieuwen2008) have shown this state in turbulent combustors. Quenching has been hypothesized to be due to the destruction of the feedback loop responsible for thermoacoustic instability (Lubarsky et al. Reference Lubarsky, Shcherbik and Zinn2003), which leads to very low time-averaged acoustic power production (Guan et al. Reference Guan, Gupta, Kashinath and Li2019a; Mondal et al. Reference Mondal, Pawar and Sujith2019). A number of studies have shown that quenching causes a significant decrease in the limit-cycle amplitude (greater than  $80\,\%$ decrease of the root mean square (r.m.s.) value and
 $90\,\%$ of spectral amplitude) across a variety of combustors such as electrically heated Rijke tubes (Mondal et al. Reference Mondal, Pawar and Sujith2019), laminar combustors (Guan et al. Reference Guan, Gupta, Kashinath and Li2019a) and turbulent combustors (Shcherbik et al. Reference Shcherbik, Lubarsky, Neumeier, Zinn, McManus, Fric and Srinivasan2003; Bellows et al. Reference Bellows, Hreiz and Lieuwen2008).
Despite such prospects, open-loop control, and active control in general, is constrained by the limited bandwidth of actuated fuel valves (Zhao & Morgans Reference Zhao and Morgans2009). Besides, there is inadequate knowledge about the physical mechanisms that lead to quenching. In addition, the range of forcing frequencies over which quenching takes place is still unclear. Some studies have shown that quenching is only observed when the forcing frequency is lower than the frequency of limit-cycle oscillations (Lubarsky et al. Reference Lubarsky, Shcherbik and Zinn2003; Bellows et al. Reference Bellows, Hreiz and Lieuwen2008; Mondal et al. Reference Mondal, Pawar and Sujith2019); whereas others have demonstrated that quenching is possible even if the forcing frequency is lower and higher than the frequency of limit-cycle oscillations (Balusamy et al. Reference Balusamy, Li, Han, Juniper and Hochgreb2015; Guan et al. Reference Guan, Gupta, Kashinath and Li2019a). However, no study has described the reason behind such a frequency dependence of asynchronous quenching in a given thermoacoustic system.
During open-loop control, the flame is perturbed simultaneously at the frequency of self-excited thermoacoustic instability and the frequency of external forcing. The presence of multiple frequencies makes it quite challenging to measure the response of the system. Nonlinear flame-describing functions, as proposed by Noiray et al. (Reference Noiray, Durox, Schuller and Candel2008) for measuring the nonlinear flame response at a single frequency, have been used to measure the flame response in the presence of incommensurate frequencies in the system (Orchini & Juniper Reference Orchini and Juniper2016). However, they also pointed out the high cost of computation associated with the prediction of the amplitude of quasiperiodic oscillations. Further, Balusamy et al. (Reference Balusamy, Li, Han and Hochgreb2017) pointed out that the determination of flame-describing functions can be quite a challenge as external forcing can trigger self-excited thermoacoustic oscillations, which can lead to unreliable approximations of the gain and phase of the flame response. Thus, alternative measurement tools are required to characterize the nonlinear flame response associated with the relatively high forcing amplitudes used for quenching of thermoacoustic oscillations.
Recent studies have attempted to quantify the nonlinear response of thermoacoustic instability to external forcing. As a result, several nonlinear phenomena such as frequency entrainment (Lieuwen & Neumeier Reference Lieuwen and Neumeier2002; Bellows et al. Reference Bellows, Hreiz and Lieuwen2008; Balusamy et al. Reference Balusamy, Li, Han, Juniper and Hochgreb2015), a shift in the natural acoustic response of the combustor (Lubarsky et al. Reference Lubarsky, Shcherbik and Zinn2003; Bellows et al. Reference Bellows, Hreiz and Lieuwen2008; Balusamy et al. Reference Balusamy, Li, Han, Juniper and Hochgreb2015) and frequency pulling/pushing (Balusamy et al. Reference Balusamy, Li, Han, Juniper and Hochgreb2015) have been identified. Guan et al. (Reference Guan, He, Murugesan, Li, Liu and Li2019b) showed that open-loop control through transient forcing could be used to achieve quenching of about 50 % of the amplitude of limit-cycle oscillations. In many of these recent studies, both numerical (Kashinath, Li & Juniper Reference Kashinath, Li and Juniper2018) and experimental (Balusamy et al. Reference Balusamy, Li, Han, Juniper and Hochgreb2015; Guan et al. Reference Guan, Gupta, Kashinath and Li2019a,Reference Guan, He, Murugesan, Li, Liu and Lib; Mondal et al. Reference Mondal, Pawar and Sujith2019), the nonlinear interaction between forcing and thermoacoustic instability is explained using concepts of synchronization theory (Balanov et al. Reference Balanov, Janson, Postnov and Sosnovtseva2008). In the present work, we also resort to the framework of synchronization theory. We discuss the relevant concepts next.
1.2 Forced synchronization
In the framework of forced synchronization, the harmonic forcing and the self-excited limit-cycle oscillations are idealized as two oscillators which are unidirectionally coupled, i.e. only forcing affects the limit-cycle oscillations, and not vice versa. Forced synchronization is achieved whenever the frequency of the limit-cycle oscillations locks with the frequency of external forcing ( $f_{n1}=f_{f}$), and the time evolution of the phase difference between them becomes bounded to a small interval
 $\unicode[STIX]{x1D707}$ (
 ${<}2\unicode[STIX]{x03C0}$) around some mean value
 $C$, i.e.
 $|\unicode[STIX]{x0394}\unicode[STIX]{x1D719}_{F,p^{\prime }}(t)-C|=|\unicode[STIX]{x1D719}_{F}-\unicode[STIX]{x1D719}_{p^{\prime }}-C|\leqslant \unicode[STIX]{x1D707}$ (Pikovsky & Maistrenko Reference Pikovsky and Maistrenko2012). We refer to the forcing as
 $F$, the forcing frequency as
 $f_{f}$, the unforced natural frequency of the limit-cycle oscillations in
 $p^{\prime }$ as
 $f_{n0}$ and the response frequency of the natural oscillations under forcing as
 $f_{n1}$, where
 $f_{n1}$ may or may not be the same as
 $f_{n0}$. In the above definition, the condition of
 $|\unicode[STIX]{x0394}\unicode[STIX]{x1D719}_{F,p^{\prime }}(t)-C|\leqslant \unicode[STIX]{x1D707}$ is referred to as phase locking, and the state of
 $f_{n1}=f_{f}$ is referred to as frequency entrainment of
 $f_{n1}$ by the external forcing at
 $f_{f}$.
In general, the forced synchronization of an oscillator is characterized in terms of locking and suppression (Balanov et al. Reference Balanov, Janson, Postnov and Sosnovtseva2008). For small frequency detuning,  $\unicode[STIX]{x0394}f=|f_{f}-f_{n1}|/f_{n0}\leqslant \unicode[STIX]{x1D716}$, where
 $\unicode[STIX]{x1D716}\ll 1$, the transition to synchronization is associated with the spectral peak at
 $f_{n1}$ moving towards the spectral peak at
 $f_{f}$, when the forcing amplitude is increased. The state of synchronization achieved in this manner is called locking. For larger frequency detuning,
 $\unicode[STIX]{x0394}f=|f_{f}-f_{n1}|/f_{n0}>\unicode[STIX]{x1D716}$, upon increasing the forcing amplitude, the spectral amplitude associated with
 $f_{n1}$ gradually diminishes, before vanishing completely. Synchronization attained in this manner is referred to as suppression. Thus, the states of locking and suppression are two different pathways to the same final state of forced synchronization. Each of these two pathways involves different types of bifurcations. The reader is referred to Balanov et al. (Reference Balanov, Janson, Postnov and Sosnovtseva2008) for a general treatment of this topic and to Kashinath et al. (Reference Kashinath, Li and Juniper2018) and Mondal et al. (Reference Mondal, Pawar and Sujith2019) for its implementation in thermoacoustics.
1.3 Forced synchronization in hydrodynamic and thermoacoustic systems
It is quite well established that thermoacoustic instability arises out of an interplay between the various subsystems inside a combustor – flow dynamics, combustion and acoustics. Thus, understanding the effect of forcing on each of these subsystems simultaneously becomes necessary. In the recent past, many studies have attempted to characterize the nonlinear effect of forcing on each of these individual subsystems and their combinations using synchronization theory.
For hydrodynamic systems, Juniper, Li & Nichols (Reference Juniper, Li and Nichols2009) reported frequency entrainment of reacting and non-reacting, globally unstable hydrodynamic jets. For a non-reacting low-density self-excited jet, the route to forced synchronization was illustrated by Li & Juniper (Reference Li and Juniper2013a,Reference Li and Juniperb,Reference Li and Juniperc). They observed that the system response was asymmetric about  $f_{n0}$ and forced synchronization was achieved only for
 $f_{f}<f_{n0}$. Later, Pawar et al. (Reference Pawar, Sujith, Emerson and Lieuwen2018) quantified the effect of forcing on a preheated bluff-body-stabilized flame. They found that synchronization characteristics of the top and bottom branch of the flame exhibit significant asymmetry depending upon the density ratio of the unburned reactants to products. These results indicate that the stability of the underlying flow field has a significant effect on its response to external forcing.
For a swirl-stabilized combustor exhibiting thermoacoustic instability, Bellows et al. (Reference Bellows, Hreiz and Lieuwen2008) were able to quench acoustic pressure oscillation to about  $90\,\%$ of the unforced spectral amplitude and
 ${\sim}65\,\%$ of the unforced r.m.s. value when
 $f_{f}<f_{n0}$. Although not discussed in their study, quenching was associated with the forced synchronization of thermoacoustic instability. In a similar system, Balusamy et al. (Reference Balusamy, Li, Han, Juniper and Hochgreb2015) observed forced synchronization of limit-cycle oscillations for both
 $f_{f}<f_{n0}$ and
 $f_{f}>f_{n0}$. However, they did not comment on the overall decrease in the amplitude of limit-cycle oscillations when forced synchronization was achieved. The locking and suppression route to forced synchronization of limit-cycle oscillation has been shown in a numerical study of a laminar burner (Kashinath et al. Reference Kashinath, Li and Juniper2018) and in an experimental study of a Rijke tube (Mondal et al. Reference Mondal, Pawar and Sujith2019). Kashinath et al. (Reference Kashinath, Li and Juniper2018) also demonstrated the forced synchronization of quasiperiodic and chaotic oscillations arising in a thermoacoustic system.
Recent systematic studies of Guan et al. (Reference Guan, Gupta, Kashinath and Li2019a) and Mondal et al. (Reference Mondal, Pawar and Sujith2019) have shed more light on asynchronous quenching. They observed that the asynchronous quenching of limit-cycle oscillation is achieved when the following conditions are satisfied: (i) limit-cycle oscillation is synchronized to the forcing and (ii) the forcing frequency is far away from the natural frequency. Asynchronous quenching has been observed in a variety of systems such as plasmas (Keen & Fletcher Reference Keen and Fletcher1970), control systems (Fjeld Reference Fjeld1974) and ionization waves (Ohe & Takeda Reference Ohe and Takeda1974). However, as mentioned before, the frequency at which asynchronous quenching is observed remains a confounding aspect in recent studies of open-loop control.
1.4 Contributions of the present study
In many of the previous studies of open-loop control (Lubarsky et al. Reference Lubarsky, Shcherbik and Zinn2003; Bellows et al. Reference Bellows, Hreiz and Lieuwen2008; Guan et al. Reference Guan, Gupta, Kashinath and Li2019a), the forced response of thermoacoustic systems is characterized in terms of the acoustic response alone. In other words, the acoustic response is considered to be representative of the thermoacoustic system under external forcing. However, as we show in our study, the response of the flame to forcing is considerably different from that of the acoustic field of the combustor and, therefore, measuring the acoustic response alone may not be enough to characterize the system behaviour completely. We consider the thermoacoustic system to be a system of two mutually coupled nonlinear oscillators: the acoustic pressure ( $p^{\prime }$) and the HRR (
 $\dot{q}^{\prime }$) oscillators. During stable combustor operation, both acoustic and HRR oscillators act like damped oscillators possessing different eigenmodes. During thermoacoustic instability, both of them oscillate at the frequency of limit-cycle oscillation, which develops close to the third acoustic eigenfrequency of the combustor.
Our objective is to simultaneously investigate the effect of harmonic forcing on the acoustic pressure and HRR oscillations developed during thermoacoustic instability. We characterize the forced synchronization of acoustic pressure and HRR oscillations and show that acoustic pressure and HRR oscillations have different forced synchronization characteristics at different conditions of forcing. Previous studies have reported quenching of limit-cycle oscillations either for  $f_{f}<f_{n0}$ alone (Lubarsky et al. Reference Lubarsky, Shcherbik and Zinn2003; Bellows et al. Reference Bellows, Hreiz and Lieuwen2008; Mondal et al. Reference Mondal, Pawar and Sujith2019) or for both
 $f_{f}<f_{n0}$ and
 $f_{f}>f_{n0}$ (Balusamy et al. Reference Balusamy, Li, Han, Juniper and Hochgreb2015; Guan et al. Reference Guan, Gupta, Kashinath and Li2019a). We find that asynchronous quenching of the limit-cycle oscillation is attained when the forcing frequency is in the vicinity of the preferred mode (
 $f_{q}$) of the flame, which is lower than
 $f_{n0}$ in our system. Thus, the inherent flame response plays a significant role in controlling the quenching characteristics of thermoacoustic instability in the system. Asynchronous quenching results in a
 $92\,\%$ drop in
 $p_{rms}^{\prime }$ and greater than
 $99\,\%$ drop in the spectral amplitude of acoustic pressure oscillations (
 $|\widehat{p}(f_{n1})|$). In addition, quenching can be achieved by forcing amplitudes which are just 10 % of the amplitude of limit-cycle oscillations.
We also present a systematic discourse on how the coupling between  $p^{\prime }$ and
 $\dot{q}^{\prime }$ is affected as forcing parameters are changed. We further quantify the same using the variation in phase-locking value (PLV), a measure that quantifies the synchronization behaviour of coupled oscillators (2.2), between
 $p^{\prime }$ and
 $\dot{q}^{\prime }$ as a function of the forcing frequency. We find that under some forcing conditions,
 $p^{\prime }$ and
 $\dot{q}^{\prime }$ undergo a transition to period-2 oscillations, somewhat similar to what had been predicted in a prior numerical study by Kashinath et al. (Reference Kashinath, Li and Juniper2018).
The rest of the paper is organized as follows. In § 2, we introduce the experimental set-up and the methodology. In § 2.3, we characterize the forced response of the combustor during stable operation, and the stable flame in unconfined and confined state. In § 3.1, we discuss the forced response of themoacosutic oscillations. In §§ 3.2 and 3.3, we focus exclusively on the forced synchronization of  $p^{\prime }$ and
 $\dot{q}^{\prime }$, respectively. In § 3.4, we consider the effect of forcing on the coupling between
 $p^{\prime }$ and
 $\dot{q}^{\prime }$. In § 3.5, we show the possibility of period-2 behaviour of
 $p^{\prime }$ and
 $\dot{q}^{\prime }$ arising due to forcing. Finally, we present the conclusions from the study in § 4.
Schematic of the laminar burner with which forcing experiments were conducted. Insets show the geometry of the burner exit where the flames are anchored and an actual flame image during stable operation. There are seven conical flames whose height during stable combustion is  $H_{f}\approx 6~\text{mm}$.

2 Methodology
2.1 Experimental set-up and measurements
The experiments were conducted using a laminar combustor capable of supporting multiple flames, as shown in figure 1. Such an arrangement was originally utilized by Matsui (Reference Matsui1981) for flame transfer function measurements, and used more recently by Kabiraj et al. (Reference Kabiraj, Saurabh, Wahi and Sujith2012a) for illustrating the different dynamical states possible in a thermoacoustic system. In this set-up, the burner tube is enclosed by a glass duct whose bottom end is acoustically closed, and the top end is acoustically open to the atmosphere. The glass tube and the burner tube are of equal length,  $L=800~\text{mm}$. The glass duct has an inner diameter of
 $50~\text{mm}$, while the burner tube has an inner diameter (
 $d_{b}$) of 16 mm. On the burner tube, a copper plate with seven holes is mounted. The height of the copper plate is 20 mm. The diameter (
 $d$) of each of these seven holes is 2 mm (upper inset of figure 1). Premixed conical flames are anchored on these holes (see lower inset of figure 1). A fine wire mesh is kept on the perforated copper plate to stabilize the flame.
The flame location ( $x_{f}$) inside the glass duct can be varied using a traverse mechanism, having a least count of 1 mm, attached to the glass tube. The height of the flame is around
 $H_{f}=6~\text{mm}$ (see figure 1). The flame is quite small in comparison to the duct length
 $H_{f}/L=6/800\sim O(10^{-3})$ and the acoustic wavelength
 $H_{f}/\unicode[STIX]{x1D706}=6/1067\sim O(10^{-3})$. Here,
 $\unicode[STIX]{x1D706}$ is the wavelength of the third acoustic eigenmode, which is
 $\unicode[STIX]{x1D706}=4L/3=1067~\text{mm}$. In other words, the flame is compact, and hence we use the burner surface location from the open end of the glass tube to be representative of the flame location
 $x_{f}$ throughout this study.
The burner tube is connected to a settling chamber with diameter  $D=223~\text{mm}$. As
 $D/d_{b}=13.94$ (or
 $A_{D}/A_{d_{b}}=194.25$, where
 $A$ is the cross-sectional area), the transmission coefficient (
 ${\mathcal{T}}$) of the acoustic waves to travel from the burner tube to the settling chamber can be calculated as
 ${\mathcal{T}}=4A_{D}A_{d_{b}}/(A_{D}+A_{d_{b}})^{2}\sim 0.02$ (equation 10.10.8 from Kinsler et al. (Reference Kinsler, Frey, Coppens and Sanders1999)). Thus, the transmission coefficient is quite low. Further, the air and liquefied petroleum gas (40 % propane and 60 % butane by volume) are mixed in a premixing chamber which is connected to the settling chamber through a braided hose of diameter
 $2~\text{mm}$. The transmission coefficient of the connection from the settling chamber to the inlets of air and fuel supply line is also quite low. Thus, we can be reasonably assured that the settling chamber prevents acoustic waves from travelling upstream of the combustion chamber to the fuel and air supply connections and causing fluctuations in the equivalence ratio.
Air and liquefied petroleum gas flow rates were maintained constant at  ${\dot{m}}_{a}=5.8~\text{slpm}$ and
 ${\dot{m}}_{f}=0.2~\text{slpm}$ using Alicat MCR 100 slpm and Alicat MCR 10 slpm mass flow controllers throughout the experiments, respectively. The uncertainty levels are
 $\pm 0.8\,\%$ of the controlled reading and
 $\pm 0.2\,\%$ of the full-scale flow measurements. The equivalence ratio (
 $\unicode[STIX]{x1D719}$) for this flow condition is 0.53. The thermal power of the laminar combustor is approximately 290 W. The nominal velocity at the exit of the burner tube is
 $\bar{U}=4.55~\text{m}~\text{s}^{-1}$. The cold-flow Reynolds number based on the diameter of the perforations is
 $Re_{d}=583$. The maximum uncertainty in the indicated values of
 $\unicode[STIX]{x1D719}$ is
 $\pm 1.6\,\%$, and for
 $\bar{U}$ and
 $Re_{d}$ it is
 $\pm 0.8\,\%$.
Pressure measurements were acquired using two PCB 103B02 pressure transducers mounted at a distance of  $200~\text{mm}$ from the open end and
 $50~\text{mm}$ from the closed end of the glass duct, as indicated by P1 and P2, respectively, in figure 1. The sensitivity and resolution of the two pressure transducers are
 $217.5~\text{mV}~\text{kPa}^{-1}$ and 0.2 Pa, respectively. The uncertainty in pressure measurements is
 $\pm 0.15~\text{Pa}$. The HRR is measured using a Hamamatsu H5784 photomultiplier tube (PMT) equipped with a CH
 $^{\ast }$ filter. The CH
 $^{\ast }$ filter has a bandwidth of
 $10~\text{nm}$ and is centred around
 $431.4~\text{nm}$ to capture the photons emitted by CH
 $^{\ast }$ radicals in the flame. The PMT measures the global HRR of all seven flames anchored on top of the burner tube. The pressure transducer and PMT measurements were acquired using a 16-bit NI USB 6343 data acquisition system at a sampling frequency of 10 kHz. The acoustic pressure measurements presented in the paper are from the transducer located at P1 so that the simultaneous measurements of
 $p^{\prime }$ and
 $\dot{q}^{\prime }$ were acquired at the same location, and there is no artificially introduced phase delay between them. Flame images were acquired using a Phantom V12.1 camera at a framing rate of approximately ten times the frequency of the signal we wanted to measure.
The inlet flow is harmonically perturbed using four Ahuja AU-60 PA loudspeakers connected in parallel and mounted at the bottom of the settling chamber. All the speakers have an impedance of  $16~\unicode[STIX]{x03A9}$ and an operational frequency range of 160–7000 Hz. The speakers are connected in parallel to an Ahuja UBA-500M power amplifier and the gain is set at a value of 3 units for all the experiments. The harmonic forcing signal is generated using a Tektronix arbitrary waveform generator and input to the amplifier. With the waveform generator, we can control the amplitude (
 $A_{f}$, in mV) and the frequency (
 $f_{f}$, in Hz) of the sinusoid signal. Throughout the paper, whenever we mention the amplitude of forcing, we refer to the peak-to-peak amplitude of the sinusoidal waveform that is input to the amplifier. We force the system during the state of thermoacoustic instability at four different forcing amplitudes, 10, 30, 50 and 70 mV, in the frequency range
 $200\leqslant f_{f}\leqslant 400~\text{Hz}$. For
 $A_{f}\geqslant 30~\text{mV}$, frequency sweeping is performed in steps of 5 Hz (or
 $\unicode[STIX]{x0394}f/f_{n0}\approx 0.014$) in the region of quenching, i.e.
 $0.65<f_{f}/f_{n0}<0.87$ (or
 $240<f_{f}<320~\text{Hz}$), and in steps of 10 Hz otherwise. Thus, we capture every transition in the system dynamics with sufficiently high certainty.
The damping in the system was measured during cold-flow experiments using an acoustic pulse. The exponential decay rate of the acoustic waves in the combustor was found to be  $30.8~\text{s}^{-1}$. For all experiments, we ensured that the decay remains within
 $\pm 10\,\%$ of the indicated value to ensure repeatability in the experiments. Also, before every experiment, the air column inside the glass duct was heated by keeping the flame at a distance of 51 cm from the open end where the combustor exhibits stable operation. We found that a heating time of approximately 15 minutes was enough for the wall temperature to saturate. The wall temperature, measured using a thermocouple attached to the glass tube at 10 cm from the open end, saturated to
 $T_{sat}\approx 160\pm 5\,^{\circ }\text{C}$.
During each experiment involving external forcing, the forcing signal was switched off, and the system was allowed to regain its original state of limit-cycle oscillations before embarking on the next forcing cycle at a different condition of forcing. Such caution is necessary to ensure that the system does not retain any memory of the previous forcing conditions.
The repeatability of the experiments was ensured for over 10 realizations of the experiment. Even though the parametric points where the synchronization states were achieved had some variability, the trend of the results remained the same during all trials. In other words, for a given  $A_{f}$, the range of
 $f_{f}/f_{n0}$ over which different states of forced synchronization (such as phase locking, intermittent phase locking and phase drifting) were achieved had small variations.
2.2 Nonlinear time series analysis
2.2.1 Measuring frequency response
The frequency contents of the acoustic pressure ( $p^{\prime }$) or the HRR (
 $\dot{q}^{\prime }$) signals are evaluated using the fast Fourier transform algorithm. The datasets are sampled at a frequency of 10 kHz to resolve the limit-cycle signal of 368 Hz and prevent any spectral leakage. The sampling frequency is about 27 times that of the unforced limit-cycle oscillations. We acquired about 50 000 data points or about 1840 cycles of the oscillations at any given forcing condition. The fast Fourier transform algorithm was implemented using a frequency resolution of 0.153 Hz per bin for a total of 32 768 bins.
2.2.2 Phase-space reconstruction
The transition to forced synchronization is characterized by reconstructing the phase space on which the dynamics of the forced system evolves. For any arbitrary initial condition, the asymptotic state of a nonlinear system evolves in the phase space to a set of numerical values which make up the attractor of the system. Thus, the topological features of the attractor quantify the asymptotic dynamics of the system.
Phase space is reconstructed using Takens’ delay embedding theorem (Takens Reference Takens1981). The optimum time delay is obtained using average mutual information (Fraser & Swinney Reference Fraser and Swinney1986) and the embedding dimension on which the dynamics evolve is calculated through Cao’s method (Cao Reference Cao1997). The calculations of average mutual information and embedding dimension are detailed in appendix A.
The trajectories of a periodic system form a closed orbit known as a limit-cycle attractor. However, the presence of noise in the signal leads to a finite width of the limit-cycle attractor. When the system dynamics contains two or more dependent frequencies, for example, a signal containing superharmonics ( $f,2f,\ldots$) leads to a closed structure with multiple loops in phase space. The number of loops indicates the number of subharmonics that are present in the signal. In the case of a quasiperiodic signal, i.e. a signal with at least two incommensurate frequencies (
 $f_{1}/f_{2}\in \mathbb{I}$, where
 $\mathbb{I}$ is the set of irrational numbers), the trajectory evolves on a
 $\mathbb{T}^{2}$-torus. A
 $\mathbb{T}^{2}$-torus is defined as the product of two circles,
 $\mathbb{T}^{2}=S_{1}\times S_{2}$, where the trajectory rotates around each of the two circles (
 $S_{1}$,
 $S_{2}$) with the two incommensurate frequencies present in the system (Nayfeh & Balachandran Reference Nayfeh and Balachandran2008). Thus, in the case of quasiperiodic signals, the phase-space trajectory comes arbitrarily close to its origin without actually closing on itself. The forcing frequency (
 $f_{f}$) reported in our study is incommensurate with the frequency of the unforced limit-cycle oscillations (
 $f_{n0}$). Hence, we get quasiperiodic dynamics whenever the amplitude of forcing is not high enough to cause forced synchronization.
2.2.3 Instantaneous phase calculation
In order to examine the synchronization between any two given oscillators, determination of the instantaneous phase of each signal becomes important. All the signals that we consider here are periodic and narrowband in nature. Thus, the sufficient conditions are fulfilled for utilizing the concept of analytic signal introduced by Gabor (Reference Gabor1946). We construct a complex analytic signal  $\unicode[STIX]{x1D701}(t)$ from a scalar signal
 $x(t)$, such that
 $\unicode[STIX]{x1D701}(t)=x(t)+i{\mathcal{H}}[x(t)]=A(t)\text{e}^{\text{i}\unicode[STIX]{x1D719}(t)}$, where
 $\unicode[STIX]{x1D719}(t)$ is the instantaneous phase and
 $A(t)$ is the instantaneous amplitude of the analytic signal. Here
 ${\mathcal{H}}$ refers to the Hilbert transform, which is defined as
 $$\begin{eqnarray}\displaystyle {\mathcal{H}}[x(t)]=\text{PV}~\frac{1}{\unicode[STIX]{x03C0}}\int _{-\infty }^{\infty }\frac{x(\unicode[STIX]{x1D70F})}{t-\unicode[STIX]{x1D70F}}\,\text{d}\unicode[STIX]{x1D70F}. & & \displaystyle\end{eqnarray}$$
Here, the integral is evaluated for the Cauchy principal value (PV). The instantaneous phase difference between two signals,  $x_{1}(t)$ and
 $x_{2}(t)$, is then evaluated as
 $\unicode[STIX]{x0394}\unicode[STIX]{x1D719}_{x_{1},x_{2}}(t)=\unicode[STIX]{x1D719}_{x_{1}}(t)-\unicode[STIX]{x1D719}_{x_{2}}(t)$. Synchronization of
 $x_{1}$ with
 $x_{2}$ is achieved when the relative phase between them becomes bounded to a small interval
 $\unicode[STIX]{x1D707}$ (
 ${<}2\unicode[STIX]{x03C0}$) around some mean value
 $C$; i.e.
 $|\unicode[STIX]{x0394}\unicode[STIX]{x1D719}_{x_{1},x_{2}}(t)-C|\leqslant \unicode[STIX]{x1D707}$ (Pikovsky & Maistrenko Reference Pikovsky and Maistrenko2012). If the unwrapped relative phase between any two signals shows unbounded and monotonic increase/decrease in time, the signals are said to be desynchronized, and the trend of increasing/decreasing phase difference is termed as phase drifting.
Note that for calculating the relative phase of  $p^{\prime }$ or
 $\dot{q}^{\prime }$ with forcing, we use a reference sinusoidal signal of unit magnitude having the same frequency as that of the forcing
 $f_{f}$. Therefore, the temporal evolution of the relative phase of
 $p^{\prime }$ or
 $\dot{q}^{\prime }$ with forcing is meaningful, but the actual value is arbitrary. Accordingly, we make all our observations of forced synchronization of acoustic and HRR oscillations based on the trend that the time evolution of the relative phase follows.
2.2.4 Phase-locking value
We calculate the PLV in order to quantify the synchronization between two signals. The PLV is defined as the absolute value of the mean phase difference between two signals where the instantaneous phase differences ( $\unicode[STIX]{x0394}\unicode[STIX]{x1D719}$) are expressed as complex unit-length vectors, i.e.
 $\text{e}^{\text{i}\unicode[STIX]{x0394}\unicode[STIX]{x1D719}}$ (Lachaux et al. Reference Lachaux, Rodriguez, Martinerie and Varela1999; Mondal, Pawar & Sujith Reference Mondal, Pawar and Sujith2017). Mathematically, the PLV is defined as
 $$\begin{eqnarray}\displaystyle \text{PLV}=\frac{1}{N}\left|\mathop{\sum }_{j=1}^{N}\exp (\text{i}\unicode[STIX]{x0394}\unicode[STIX]{x1D719}_{x_{1},x_{2}}(t_{j}))\right|, & & \displaystyle\end{eqnarray}$$
where the phase difference at the instant  $t_{j}$ is
 $\unicode[STIX]{x0394}\unicode[STIX]{x1D719}_{x_{1},x_{2}}(t_{j})=\unicode[STIX]{x1D719}_{x_{1}}(t_{j})-\unicode[STIX]{x1D719}_{x_{2}}(t_{j})$. The PLV lies close to 0 for desynchronized signals and close to 1 for perfectly synchronized signals. For cases with partial synchronization such as intermittent phase locking, the PLV lies between 0 and 1.
2.3 Characterization of thermoacoustic subsystems
2.3.1 Forced acoustic response of the combustor during stable operation
The glass duct is acoustically open at the top (acoustic pressure  $p^{\prime }(x/L=0)\approx 0$) and closed at the bottom end (acoustic velocity
 $u^{\prime }(x/L=1)\approx 0$). In the absence of combustion (no flame), forcing the combustor leads to resonant amplification of the forcing signal at
 $f_{f}=109$, 326 and 543 Hz. The amplification corresponds to the frequency of the first three acoustic eigenmodes (
 $f_{n}=nc/4L$, where
 $n=1$, 3 and 5, and
 $c$ is the speed of sound at 300 K) of the closed–open glass duct (figure is not shown here).
We next measure the response of the acoustic pressure fluctuations to forcing during stable combustor operation (i.e. no thermoacoustic instability). When  $x_{f}$, the distance of the flame from the open end, is increased, the system dynamics undergoes a subcritical Hopf bifurcation from a steady state to limit-cycle oscillation at
 $x_{f}=187~\text{mm}$ (
 $x_{f}/L=0.23$). Upon decreasing
 $x_{f}$, we notice that the transition from limit-cycle oscillation to steady state happens at
 $x_{f}=150~\text{mm}$ (
 $x_{f}/L=0.19$) through the fold point. Hence, we measure the acoustic response of the system by keeping
 $x_{f}=140~\text{mm}$ (
 $x_{f}/L=0.18$), as this location is outside the bistable zone and forcing cannot trigger the system dynamics to the state of thermoacoustic instability. So,
 $x_{f}=140~\text{mm}$ corresponds to stable combustor operation. At this
 $x_{f}$, the acoustic response of the duct is measured in terms of the r.m.s. value of the pressure oscillations as a function of the forcing frequency
 $f_{f}$ and amplitude
 $A_{f}$. In other words, we measure
 $p_{rms}^{\prime }(A_{f},f_{f})=\sqrt{\langle p^{\prime }(t)^{2}\rangle }$, where
 $p^{\prime }(t)$ is the mean subtracted signal measured after external forcing has been set at a fixed value of
 $f_{f}$ and
 $A_{f}$, and
 $\langle \cdot \rangle$ indicates time-averaged quantity.
In figure 2(a), we plot  $p_{rms}^{\prime }(A_{f},f_{f})$ as a function of
 $f_{f}$ at
 $A_{f}=50~\text{mV}$. The forcing frequency is normalized by the frequency of the unforced limit-cycle oscillations
 $f_{n0}=368~\text{Hz}$ obtained when
 $x_{f}$ is fixed at
 $200~\text{mm}$. The resonant amplification of forcing is visible for the first (
 $f_{1}=125~\text{Hz}$), third (
 $f_{3}=360~\text{Hz}$) and fifth (
 $f_{5}=580~\text{Hz}$) harmonics of the glass duct, which correspond to the first three acoustic eigenmodes of the stable combustor.
Illustration of the inherent response of different subsystems of the thermoacoustic system during stable operation. (a) Forced acoustic response of the long duct ( $L=800~\text{mm}$) as a function of
 $f_{f}$ measured at the flame location
 $x_{f}=140~\text{mm}$. (b) Forced response of HRR fluctuations in the flame as a function of
 $f_{f}$ measured without confinement (▾), in a short tube (♦) (
 $L=400~\text{mm}$ and
 $x_{f}=200~\text{mm}$) and in a long duct (▪) (
 $L=800~\text{mm}$ and
 $x_{f}=140~\text{mm}$). The amplitude of forcing is fixed at
 $A_{f}=50~\text{mV}$ for both (a) and (b). The right-hand axis in (b) corresponds to a larger HRR response for the case with longer duct.

2.3.2 Forced HRR response of the stable flame
We ascertain the stability of the flame by subjecting it to forcing in unconfined and confined conditions. The premixed flame remains linearly stable to low-amplitude perturbations for all lean operating conditions. Forcing the flame at higher amplitudes ( $A_{f}>50~\text{mV}$) does not trigger the flame to self-excited oscillations, indicating its nonlinear stability (Huerre & Monkewitz Reference Huerre and Monkewitz1990). Consequently, we do not consider the flame to be a self-sustained oscillator but a damped harmonic oscillator.
Next, we measure the inherent flame response to forcing in unconfined and confined conditions. We use two different glass ducts to measure the flame response in the confined condition. We use a short duct and a long duct of length  $L=400~\text{mm}$ and
 $L=800~\text{mm}$, respectively. For the longer tube, we measure the flame response during stable operation with the flame location from the open end at
 $x_{f}=140~\text{mm}$, as discussed previously. We repeat the same experiment by keeping
 $x_{f}=200~\text{mm}$ for a short duct of
 $L=400~\text{mm}$ to verify the response measured for the unconfined flame and the confined flame inside the long duct. We use the short duct because its harmonics are present at sufficiently high frequencies and forcing in the range of amplitudes and frequencies used in this study cannot trigger self-excited limit-cycle oscillations. Thus, in either of the two cases with confinement, we ensure that forcing does not trigger self-excited limit-cycle oscillations, and the measured flame response is unaffected by self-excited limit-cycle oscillations.
Keeping the location of the flame from the open end of the short duct ( $x_{f}=200~\text{mm}$) and long duct (
 $x_{f}=140~\text{mm}$) constant, we perform frequency sweeping at fixed
 $A_{f}=50~\text{mV}$. We measure
 $\dot{q}_{rms}^{\prime }(A_{f},f_{f})=\sqrt{\langle \dot{q}^{\prime }(t)^{2}\rangle }$ for a given
 $A_{f}$ and
 $f_{f}$. In figure 2(b), we plot the resulting flame response as a function of
 $f_{f}$ for
 $A_{f}=50~\text{mV}$, and normalize it with
 $\bar{q}$, which is the mean of the instantaneous HRR time series
 $\dot{q}(t)$.
We observe that the HRR response is similar for the unconfined and confined flame. We note that the HRR response is amplified for forcing frequencies close to 290 and 480 Hz (figure 2b). Unlike the acoustic response, the maxima in the flame response are attained at frequencies which are not integral multiples of each other, indicating the nonlinear nature of the flame. We observe that the amplification in HRR response takes place around the same frequencies for all three cases. The only difference is that the magnitude of  $\dot{q}_{rms}^{\prime }$ for the longer duct is about an order of magnitude greater than that for the other two cases (shown by the ordinate on the right-hand side in figure 2b). This difference in magnitude is possibly due to the relative location of the flame with respect to the acoustic velocity anti-node of the duct. We also notice that the increase in the amplitude of the response is not sharp but gradual, indicating that the flame is quite receptive to forcing over a broad frequency range. The flame responds well to the external forcing, showing a clear periodic response at each forcing frequency. Thus, we presume that the flame is analogous to a damped harmonic oscillator, which has preferred modes in the vicinity of
 $f_{f}=290~\text{Hz}$ and
 $f_{f}=480~\text{Hz}$. Of these two modes, we find that the mode at 290 Hz plays a vital role in determining the frequency at which quenching of thermoacoustic instability occurs (explained further in § 3). We refer to this as the preferred mode of the flame with frequency
 $f_{q}=290~\text{Hz}$ (subscript
 $q$ is used as the flame response is quantified through HRR fluctuations
 $\dot{q}^{\prime }$). Finally, comparing the forced acoustic and HRR responses (figures 2a and 2b), we notice that the response of the stable flame is quite different from the acoustic response during stable combustor operation. Specifically, the frequencies at which the two subsystems show resonant response to forcing do not match each other.
Figure 3 depicts the variation in the flame structure of the stable flame confined inside the long duct ( $L=800~\text{mm}$) for
 $x_{f}=140~\text{mm}$, and subjected to forcing at the frequency of preferred mode of the flame at
 $f_{f}=f_{q}=290~\text{Hz}$ and at the third harmonic of the duct at
 $f_{f}=f_{3}=360~\text{Hz}$. We contrast the flame dynamics at the frequency of the preferred mode, which is the parametric location of optimal quenching of thermoacoustic instability, and the frequency at which limit-cycle oscillations develop when
 $x_{f}$ is changed. We plot the time series of the height of the flame (
 $H_{f}$) in figure 3(a–c). We consider the height of the flamelet at the centre to be representative of the height of the flamelets (indicated in figure 3d). The mean height of the flame for
 $f_{f}=290~\text{Hz}$ is
 $\bar{H}_{f}=8.8~\text{mm}$ and for
 $f_{f}=360~\text{Hz}$ is
 $\bar{H}_{f}=8.6~\text{mm}$ (figure 3a). The mean height of the flame is approximately the same for
 $f_{f}=290$ and 360 Hz. However, the fluctuations in the flame height are much more pronounced for
 $f_{f}=290~\text{Hz}$. These fluctuations in the flame height are visible quite clearly from the instantaneous flame images over a cycle of forcing as shown in figure 3(d). In contrast, the fluctuations are not readily apparent when the flame is forced at
 $f_{f}=360~\text{Hz}$, as shown in figure 3(e). The large fluctuations in flame height or, equivalently, flame area when
 $f_{f}=f_{q}$ manifest in the amplification of the HRR response observed in figure 2(b) for
 $f_{f}$ in the vicinity of
 $f_{q}$. This fact further corroborates that the preferred mode of the flame indeed exists at
 $f_{f}=f_{q}\approx 290~\text{Hz}$ and is disparate from the acoustic frequencies of the combustor.
Dynamics of the stable flame when subjected to forcing at different forcing frequencies measured for the long duct ( $L=800~\text{mm}$ and
 $x_{f}=140~\text{mm}$). (a–c) Time series of the height of the central flame (
 $H_{f}$) when subjected to forcing at
 $f_{f}=f_{q}=290~\text{Hz}$ and
 $f_{f}=f_{3}=360~\text{Hz}$ at constant
 $A_{f}=50~\text{mV}$. Enlarged portion of the
 $H_{f}$ time series for (b)
 $f_{f}=290~\text{Hz}$ and (c)
 $f_{f}=360~\text{Hz}$. (d,e) Instantaneous flame images corresponding to the points marked in the time series in (b,c).

2.3.3 Characteristics of self-excited limit-cycle oscillations
The self-excited response of the laminar combustor used in the present study due to a variation in the flame location ( $x_{f}$) has been characterized thoroughly by Kabiraj et al. (Reference Kabiraj, Saurabh, Wahi and Sujith2012a) and Kabiraj, Sujith & Wahi (Reference Kabiraj, Sujith and Wahi2012b). This system is capable of displaying a variety of dynamical states such as limit-cycle, period-
 $k$, quasiperiodic and chaotic oscillations when the location of the flame is systematically varied in the system (Kabiraj et al. Reference Kabiraj, Saurabh, Wahi and Sujith2012a,Reference Kabiraj, Sujith and Wahib). However, in the present study, we consider only the control of limit-cycle oscillation on account of it being the most commonly occurring dynamical state of unstable combustor operation. Accordingly, we set the equivalence ratio (
 $\unicode[STIX]{x1D719}=0.53$) and mass flow rates (
 ${\dot{m}}={\dot{m}}_{a}+{\dot{m}}_{f}=6~\text{slpm}$) for which we obtain constant-amplitude limit-cycle oscillations.
As discussed previously, the system undergoes a subcritical Hopf bifurcation at  $x_{f}=187~\text{mm}$ (
 $x_{f}/L=0.23$) and transitions to a state of limit-cycle oscillations. Since we obtain limit-cycle oscillations for
 $x_{f}>187~\text{mm}$, we fix the position of the flame as
 $x_{f}=200~\text{mm}$ (
 $x_{f}/L=0.25$) for all the experiments with open-loop forcing. The frequency of limit-cycle oscillation at
 $x_{f}=200~\text{mm}$ is
 $f_{n0}=368\pm 5~\text{Hz}$. The associated spectral amplitude of the pressure oscillations is
 $|\hat{p}(f_{n0})|=105~\text{Pa}$ (or 134 dB), and the r.m.s. value is
 $p_{rms}^{\prime }\sim 140~\text{Pa}$. During thermoacoustic instability, both the acoustic pressure and HRR oscillate at
 $f_{n0}$. The frequency of the limit-cycle oscillations corresponds to the third harmonic of the closed–open duct. The small increase in the eigenfrequency of the system from 360 Hz when
 $x_{f}=140~\text{mm}$ (see figure 2a) to 368 Hz at
 $x_{f}=200~\text{mm}$ is expected as a larger portion of the glass duct is heated along with very large fluctuations in the HRR due to thermoacoustic instability. As a result, there is an increase in the speed of sound inside the duct, which leads to an increase in the frequency of the eigenmodes of the combustor (Sujith, Waldherr & Zinn Reference Sujith, Waldherr and Zinn1995).
3 Results and discussion
As mentioned earlier, we measure the forced response of thermoacoustic oscillations by keeping the flame location fixed at  $x_{f}=200~\text{mm}$ (
 $x_{f}/L=0.25$), where there are strong self-excited limit-cycle oscillations with frequency
 $f_{n0}=368\pm 5~\text{Hz}$ and
 $p_{rms}^{\prime }\sim 140~\text{Pa}$. Once the limit-cycle oscillations are stabilized, the forcing parameters (amplitude,
 $A_{f}$, and frequency,
 $f_{f}$) are systematically altered, leaving all the other control parameters (such as flame location,
 $x_{f}$, and equivalence ratio,
 $\unicode[STIX]{x1D719}$) unchanged.
3.1 Forced response of thermoacoustic oscillations
Figure 4 shows the response of thermoacoustic instability to external forcing as a function of  $f_{f}$ and
 $A_{f}$. As before, the response is measured in terms of the r.m.s. value as it is a measure of the energy content of the signal regardless of the specific frequency content. As external forcing induces additional frequencies in the signal, measuring the response at any given frequency would only provide an incomplete picture of the response.
Demonstration of open-loop control of thermoacoustic instability. Response of (a) acoustic pressure ( $p_{rms}^{\prime }$) and (b) normalized HRR fluctuations (
 $\dot{q}_{rms}^{\prime }/\bar{q}$) as a function of the normalized forcing frequency (
 $f_{f}/f_{n0}$). (c) The time-averaged acoustic power production,
 ${\mathcal{P}}$ (1.1), of the thermoacoustic system as a function of the normalized forcing frequency at the indicated amplitude of forcing (
 $A_{f}$). The shaded region indicates the region of asynchronous quenching for
 $A_{f}>30~\text{mV}$. The axis on the top indicates
 $f_{f}$. The error bars represent twice the standard deviation of the time series obtained for any given
 $f_{f}$ and
 $A_{f}$.

At a very low amplitude of forcing ( $A_{f}=10~\text{mV}$), the thermoacoustic system remains unaffected as indicated by the relative insensitivity of
 $p_{rms}^{\prime }$ and
 $\dot{q}_{rms}^{\prime }$ to a change in
 $f_{f}$ as shown in figures 4(a) and 4(b), respectively. On increasing the amplitude of forcing to
 $A_{f}=30~\text{mV}$, we notice a small decrease in
 $p_{rms}^{\prime }$ (figure 4a), while
 $\dot{q}_{rms}^{\prime }$ shows a corresponding increase in the frequency range
 $0.7<f_{f}/f_{n0}<0.82$. The decrease in
 $p_{rms}^{\prime }$ and the increase in
 $\dot{q}_{rms}^{\prime }$ for
 $0.7<f_{f}/f_{n0}<0.82$ become more pronounced as we increase the forcing amplitude first to 50 mV and then to 70 mV. At
 $A_{f}=70~\text{mV}$, we notice a maximum decrease in
 $p_{rms}^{\prime }$ at
 $f_{f}/f_{n0}=0.79$. Here, we achieve about
 $92\,\%$ decrease in
 $p_{rms}^{\prime }$ from an initial unforced value of
 $p_{rms}^{\prime }=140~\text{Pa}$ at
 $f_{f}/f_{n0}=0$ to
 $p_{rms}^{\prime }=11.8~\text{Pa}$ at
 $f_{f}/f_{n0}=0.79$. The decrease in the amplitude of limit-cycle oscillations due to forcing at a frequency away from the natural frequency is referred to as asynchronous quenching (Guan et al. Reference Guan, Gupta, Kashinath and Li2019a; Mondal et al. Reference Mondal, Pawar and Sujith2019). We notice that with increasing amplitude of forcing, there is a progressively greater quenching of
 $p_{rms}^{\prime }$ and a wider frequency range over which quenching is observed (shaded region in figure 4). In contrast,
 $\dot{q}_{rms}^{\prime }$ shows an amplification in the frequency range
 $0.7<f_{f}/f_{n0}<0.82$. For both
 $A_{f}=50$ and 70 mV, the increase in
 $\dot{q}_{rms}^{\prime }/\bar{q}$ observed in figure 4(b) is quite comparable to the amplification achieved when the stable flame is forced (see figure 2b). Clearly, this increase in
 $\dot{q}_{rms}^{\prime }/\bar{q}$ is analogous to the resonance observed at the frequency of the preferred mode of the stable flame in figure 2(b).
Figure 4(c) shows the dependence of time-averaged acoustic power production,  ${\mathcal{P}}$ (1.1), on the forcing frequency at different
 $A_{f}$. Notice that
 ${\mathcal{P}}$ follows a similar trend to
 $p_{rms}^{\prime }$. At low forcing amplitude, the time-averaged acoustic power production remains very high (figure 4c). Increase in forcing amplitude in the range
 $0.7<f_{f}/f_{n0}<0.82$ causes a progressively higher reduction in the magnitude of
 ${\mathcal{P}}$. So, even though there is an increase in
 $\dot{q}_{rms}^{\prime }/\bar{q}$ for
 $0.7<f_{f}/f_{n0}<0.82$ (figure 4b), the coupling of
 $p^{\prime }$ and
 $\dot{q}^{\prime }$ is such that the acoustic power production is very low and hence the system cannot sustain thermoacoustic instability. The maximum reduction in
 $p_{rms}^{\prime }$ is obtained at
 $f_{f}/f_{n0}=0.79$ at which point the acoustic power production is also at its lowest, i.e.
 ${\mathcal{P}}\sim 0.01~\text{a.u.}$ Thus, there is a negligible contribution of the flame to the acoustic energy in the combustor during the state of quenching of limit-cycle oscillations. At other forcing frequencies, the acoustic power production remains quite high, indicating the inefficacy of forcing to control thermoacoustic instability.
Of particular note here is that the flame significantly affects the frequency at which quenching is observed. We hypothesize that external forcing at the frequency of the preferred mode of the flame, which is disparate from the eigenfrequency of the combustor, is responsible for the asynchronous quenching of pressure oscillations in our system. One possible explanation is that as the forcing frequency is close to the preferred mode of the flame, HRR oscillations are amplified. In contrast, since the forcing frequency is far away from the frequency of acoustic eigenmode, a standing wave cannot be established inside the duct. As a result, the thermoacoustic feedback loop is disrupted, and the modified Rayleigh criterion (acoustic driving greater than damping) is not satisfied even though the amplitude of HRR oscillations are very large.
Depiction of forced synchronization of the acoustic pressure oscillations with increasing  $f_{f}$ at a fixed
 $A_{f}=70~\text{mV}$. (a) Time series, (b) amplitude spectrum and (c) the phase portrait of the pressure fluctuations. (d) The time evolution of phase difference between
 $p^{\prime }$ and forcing,
 $\unicode[STIX]{x0394}\unicode[STIX]{x1D719}_{p^{\prime },F_{f}}$. Dashed lines in (b) indicate the frequency of unforced limit cycle (
 $f_{n0}$) and preferred mode of the flame (
 $f_{q}$). Note that the ordinate is different for (a,b) where each division represents 10 Pa.

In the subsequent sections, we methodically describe the changes in the response of acoustic and HRR oscillations as the frequency or amplitude of forcing is varied systematically. We also quantify the changes in the dynamics of pressure and HRR oscillations relative to the forcing frequency by measuring the evolution of the relative phase, i.e.  $\unicode[STIX]{x0394}\unicode[STIX]{x1D719}_{p^{\prime },F}$ and
 $\unicode[STIX]{x0394}\unicode[STIX]{x1D719}_{\dot{q}^{\prime },F}$. The instantaneous phase is calculated using the method of Hilbert transform (2.1) as detailed in § 2.2.3.
3.2 Effect of forcing on the dynamics of acoustic pressure oscillations
3.2.1 Varying forcing frequency:  $f_{f}/f_{n0}=0\rightarrow 0.72$ at $A_{f}=70~\text{mV}$


Figure 5 depicts the forced synchronization of  $p^{\prime }$ as
 $f_{f}$ is varied at a fixed
 $A_{f}=70~\text{mV}$. When forcing is absent,
 $p^{\prime }$ is periodic with only one characteristic frequency,
 $f_{n0}$ (figure 5bi). Increase in
 $f_{f}/f_{n0}$ to 0.65 leads to increasingly modulated
 $p^{\prime }$ signal (figure 5aii), indicating the presence of two incommensurate frequencies (figure 5bii). Accordingly, the phase-space trajectory lies on a
 $\mathbb{T}^{2}$-torus. Such a quasiperiodic behaviour persists for
 $0.68<f_{f}/f_{n0}<0.71$. In this range of
 $f_{f}/f_{n0}$, the spectral amplitude of forcing is lower but comparable to the amplitude of limit-cycle oscillations at
 $f_{n1}$ (see figure 5biii,iv). Here,
 $f_{n1}$ is the response frequency of the limit-cycle oscillations to forcing. We notice that the spectral amplitude of limit-cycle oscillations at
 $f_{n1}$ continues to decrease (see the transition from figures 5biii to 5biv). For
 $f_{f}/f_{n0}<0.71$, the unwrapped relative phase between the acoustic pressure oscillations and forcing (
 $\unicode[STIX]{x0394}\unicode[STIX]{x1D719}_{p^{\prime },F_{f}}$) shows unbounded and monotonic variation in time (figures 5dii–5div), indicating desynchronized nature of the signals.
Demonstration of forced synchronization of acoustic pressure oscillations with increasing  $A_{f}$ at a constant
 $f_{f}/f_{n0}=0.71$ (or
 $f_{f}/f_{q}=0.9$). (a) Time series, (b) amplitude spectrum and (c) the phase portrait of
 $p^{\prime }$ for the indicated values of
 $A_{f}$ shown in the last column. Torus-birth and torus-death bifurcations take place when
 $A_{f}$ is increased from 10 to 30 mV and from 50 to 70 mV, respectively. Note that the ordinate is different for (a,b) where each division represents 10 Pa.

For  $f_{f}/f_{n0}=0.71$ and 0.72, the spectral amplitude of
 $p^{\prime }$ at
 $f_{n1}$ (figure 5bv,vi) decreases to
 ${\sim}99\,\%$ of the unforced spectral amplitude. This corresponds to
 ${\sim}80\,\%$ decrease in
 $p_{rms}^{\prime }$ from the unforced value, as can be observed from figure 4(a). We further observe a transition from a state of phase drifting (figure 5div) to phase locking (figure 5dv) in the relative phase plot between pressure and forcing signals. Recall from § 1.2 that forced synchronization is said to be achieved if the forcing frequency is the only characteristic frequency in the signal and the instantaneous relative phase between the response and forcing becomes bounded to
 $2\unicode[STIX]{x03C0}$. Thus, at
 $f_{f}/f_{n0}=0.71$, the acoustic pressure oscillations associated with limit-cycle oscillations have undergone forced synchronization.
3.2.2 Varying forcing amplitude: $A_{f}=0\rightarrow 70~\text{mV}$ at $f_{f}/f_{n0}=0.71$


Next, we characterize the forced synchronization of acoustic pressure oscillations as the forcing amplitude is increased at a fixed forcing frequency  $f_{f}/f_{n0}=0.71$. At
 $A_{f}=0$, we notice the characteristic frequency (
 $f_{n0}$) of limit-cycle oscillations in the amplitude spectrum (figure 6bi) and the associated single closed-loop attractor (figure 6ci). An increase in
 $A_{f}$ to 30 mV leads to a transition from limit-cycle to quasiperiodic dynamics (figure 6ciii). The acoustic response remains quasiperiodic with further increase in forcing amplitude (figures 6ciii,6civ). Finally, at
 $A_{f}=70~\text{mV}$, we notice that there is only one characteristic frequency (
 $f_{f}$) in the system (figure 6bv) and the relative phase becomes bounded (figure 5dv), indicating the forced synchronization of
 $p^{\prime }$.
Thus, in either of the two cases  $f_{f}/f_{n0}=0\rightarrow 0.72$ at
 $A_{f}=70~\text{mV}$ and
 $A_{f}=0\rightarrow 70~\text{mV}$ at
 $f_{f}/f_{n0}=0.71$, the dynamics of pressure oscillations transitions from limit cycle at
 $f_{n0}$ to quasiperiodicity with frequency
 $f_{n1}$ and
 $f_{f}$, and back to limit cycle at
 $f_{f}$. The associated bifurcations are: limit cycle to quasiperiodic through torus-birth bifurcation, and quasiperiodic to limit cycle through torus-death bifurcation (Balanov et al. Reference Balanov, Janson, Postnov and Sosnovtseva2008; Li & Juniper Reference Li and Juniper2013b; Kashinath et al. Reference Kashinath, Li and Juniper2018).
3.3 Effect of forcing on the dynamics of HRR oscillation
Now, we characterize the response of the HRR oscillations when subjected to forcing at constant  $A_{f}=70~\text{mV}$. Figure 7 shows the transition in the response of HRR as
 $f_{f}$ is increased. In the absence of forcing (
 $f_{f}/f_{n0}=0$), we observe that the dynamics of HRR has a narrowband peak at
 $f_{n0}$ (figure 7bi). However, the time series of this signal exhibits visible modulations (figure 7ai). Such modulations could be a result of the low flame intensity, making the signal highly susceptible to ambient noise. Consequently, the phase-space trajectory appears to be scattered about the limit-cycle attractor (figure 7ci).
Transition to forced synchronization of the HRR oscillations for increasing  $f_{f}$ at fixed
 $A_{f}=70~\text{mV}$. (a) Time series, (b) amplitude spectrum and (c) the phase portrait of the normalized HRR fluctuations measured for the indicated values of forcing frequency. (d) Time evolution of phase difference between
 $\dot{q}^{\prime }$ and the forcing,
 $\unicode[STIX]{x0394}\unicode[STIX]{x1D719}_{\dot{q}^{\prime },F_{f}}$.

At  $f_{f}/f_{n0}=0.65$, we observe that the spectral amplitude of HRR oscillations at
 $f_{f}$ is larger than but comparable to the spectral amplitude at
 $f_{n1}$ (i.e.
 $\hat{q}(f_{f})>\hat{q}(f_{n1})$; figure 7bii). The presence of these incommensurate frequencies in the spectrum results in the existence of a distinct
 $\mathbb{T}^{2}$-torus in the phase space, indicative of the quasiperiodic nature of HRR oscillations (figure 7cii). At this
 $f_{f}$, forcing also leads to phase locking of HRR signal with random phase slips interspersed in it (figure 7dii). Here, phase slips refer to jumps in the mean value of the phase difference between
 $\dot{q}^{\prime }$ and forcing in integer multiples of
 $2\unicode[STIX]{x03C0}~\text{radians}$, as indicated in figure 7(dii). This is referred to as intermittent phase locking of the forcing and HRR oscillations.
For  $f_{f}/f_{n0}=0.68$, the spectral amplitude of HRR oscillations at
 $f_{n1}$ is very low in comparison to the spectral amplitude of forcing at
 $f_{f}$ (figure 7biii). Figure 7(diii) shows that the HRR oscillations are phase-locked to forcing, indicating the occurrence of forced synchronization of HRR oscillations in the system. Increase in forcing frequency (
 $f_{f}/f_{n0}>0.68$) leads to a progressive decrease in the spectral amplitude of HRR fluctuations at
 $f_{n1}$ to the point where it completely disappears at
 $f_{f}/f_{n0}=0.71$ (figure 7bv).
The transition of HRR oscillations from the unforced limit cycle at  $f_{n0}$ to limit-cycle oscillations at
 $f_{f}$ during the process of forced synchronization follows a similar change to that undergone by the acoustic pressure oscillations (figure 5). However, the frequency range over which
 $\dot{q}^{\prime }$ is synchronized to forcing is larger than that for
 $p^{\prime }$. Similarly, the transition in the dynamics of HRR oscillations for an increase in
 $A_{f}$ at a given
 $f_{f}$ is similar to the acoustic response plotted in figure 6 but has not been shown here for brevity. The only difference is that for a given
 $f_{f}$,
 $\dot{q}^{\prime }$ undergoes forced synchronization at a lower
 $A_{f}$ than
 $p^{\prime }$ does. A possible explanation for such an occurrence might be the fact that the flame is more receptive to the external harmonic forcing whenever the forcing frequency is close to the frequency of the preferred mode of the flame.
Recently, in an electrically heated horizontal Rijke tube, Mondal et al. (Reference Mondal, Pawar and Sujith2019) showed that when pressure oscillations are forced at a frequency close to  $f_{n0}$, there is a quenching of the spectral amplitude of pressure oscillations at
 $f_{n1}$ due to synchronization, while the spectral amplitude at
 $f_{f}$ undergoes resonant amplification. As a result, they observed high amplification in the r.m.s. value of acoustic pressure oscillations, which they referred to as synchronance (synchronization–resonance). We observe similar behaviour in our system. The forced synchronization of HRR oscillations around
 $f_{q}$ (figure 7v,vi) is observed simultaneously with the enhancement in
 $\dot{q}_{rms}^{\prime }$ (figure 4b). Thus, we possibly observe synchronance in the HRR oscillations at
 $f_{f}=f_{q}$.
The combined forced synchronization of acoustic pressure and HRR oscillation is quite important. We observe only small reductions in the amplitude of  $p^{\prime }$ when only
 $\dot{q}^{\prime }$ is synchronized to forcing (for
 $f_{f}/f_{n0}<0.7$ in figure 4a). We notice a very high reduction in the amplitude of thermoacoustic instability when both
 $p^{\prime }$ and
 $\dot{q}^{\prime }$ undergo forced synchronization at
 $f_{f}/f_{n0}=0.72$ in figure 4(a). In some of the previous studies (Balusamy et al. Reference Balusamy, Li, Han, Juniper and Hochgreb2015; Kashinath et al. Reference Kashinath, Li and Juniper2018; Guan et al. Reference Guan, Gupta, Kashinath and Li2019a; Mondal et al. Reference Mondal, Pawar and Sujith2019), the forced synchronization of acoustic pressure is observed around the acoustic eigenfrequency of the combustor. In contrast, we find that the forced synchronization of the two oscillators takes place around the frequency of the preferred mode of the flame instead of the acoustic eigenfrequency. Thus, we conclude that the flame exerts significant control on the dynamics of asynchronous quenching and forced synchronization characteristics of the limit-cycle oscillations.
3.4 Effect of forcing on the coupling between the acoustic and HRR oscillations
Here, we assess and quantify the effect of forcing on the mutual coupling of the acoustic pressure and HRR oscillations. Figure 8 displays the time-averaged acoustic power production,  ${\mathcal{P}}$, as a function of the forcing frequency at fixed
 $A_{f}=70~\text{mV}$. The associated time evolutions of the phase difference (
 $\unicode[STIX]{x0394}\unicode[STIX]{x1D719}_{p^{\prime },\dot{q}^{\prime }}(t)$) between the acoustic pressure and HRR oscillations are also shown at different forcing frequencies. In thermoacoustic systems in general, the coupling between
 $p^{\prime }$ and
 $\dot{q}^{\prime }$ is asymmetric and nonlinear (Godavarthi et al. Reference Godavarthi, Pawar, Unni, Sujith, Marwan and Kurths2018). Thus, the quantification of the response of the coupling between
 $p^{\prime }$ and
 $\dot{q}^{\prime }$ to external forcing is of particular significance.
The effect of forcing on the system has been divided into seven regions depending upon the inter-relationship between the three oscillators:  $p^{\prime }$,
 $\dot{q}^{\prime }$ and
 $F$. In figure 8, we indicate the existence of some form of synchronization among each of the oscillators with ‘
 $\Leftrightarrow$’. These states of synchronization are either the state of forced synchronization or state exhibiting partial synchronization such as intermittent phase locking. The desynchronization between any two given oscillators is indicated with ‘
 $\not \Leftrightarrow$’. Thus, regions I and VII correspond to states where only
 $p^{\prime }$ and
 $\dot{q}^{\prime }$ are mutually synchronized. In regions II–VI,
 $\dot{q}^{\prime }$ and forcing remain synchronized, while
 $p^{\prime }$ is synchronized to forcing only in regions III and V. In regions III and V, all three oscillators are synchronized to each other.
Effect of forcing on the mutual coupling between acoustic pressure and HRR oscillations. The time-averaged acoustic power production ( ${\mathcal{P}}$) is plotted as a function of the normalized forcing frequency
 $f_{f}/f_{n0}$ at
 $A_{f}=70~\text{mV}$. The insets (a–g) indicate the time evolution of
 $\unicode[STIX]{x0394}\unicode[STIX]{x1D719}_{p^{\prime },\dot{q}^{\prime }}$ (in radians) at the indicated forcing frequencies. The inter-relationship among
 $p^{\prime }$,
 $\dot{q}^{\prime }$ and
 $F$ is indicated below the figure. The symbol ‘
 $\Leftrightarrow$’ indicates that a state of synchronization exists between any two given oscillators, while ‘
 $\not \Leftrightarrow$’ indicates that the two oscillators remain desynchronized.

In region I, the effect of forcing is negligible. Therefore, forcing cannot affect the coupling between  $p^{\prime }$ and
 $\dot{q}^{\prime }$, and the relative phase between
 $p^{\prime }$ and
 $\dot{q}^{\prime }$ oscillates around a mean (
 $\overline{\unicode[STIX]{x0394}\unicode[STIX]{x1D719}_{p^{\prime },\dot{q}^{\prime }}}$) of
 $-2.1^{\circ }$ and a standard deviation of
 $\pm 9.4^{\circ }$, which is equivalent to
 $p^{\prime }$ and
 $\dot{q}^{\prime }$ being nearly in phase with each other (figure 8a). Thus, there is a net positive acoustic driving in the system and the acoustic power production is quite high (
 ${\mathcal{P}}=1.49~\text{a.u.}$). For
 $f_{f}/f_{n0}<0.58$, forcing can only cause intermittent phase slips in the state of phase locking between
 $p^{\prime }$ and
 $\dot{q}^{\prime }$ (figure 8b). Each of the remaining pair of oscillators,
 $p^{\prime }$–forcing and
 $\dot{q}^{\prime }$–forcing, remain desynchronized.
For  $f_{f}/f_{n0}$ in the range 0.58–0.69 (region II), we notice that forcing causes disruption in the coupling between
 $p^{\prime }$ and
 $\dot{q}^{\prime }$, and
 $\unicode[STIX]{x0394}\unicode[STIX]{x1D719}_{p^{\prime },\dot{q}^{\prime }}$ shows unbounded and monotonic growth (figure 8c). In this region, forced synchronization of
 $\dot{q}^{\prime }$ is established (see figures 7dii–7div). However, the net forcing amplitude is still insufficient to cause forced synchronization of
 $p^{\prime }$, as can be seen from the phase drift in the relative phase plot in figures 5(dii)–5(div).
Regions III, IV and V together constitute the frequency range over which we observe a significant quenching of limit-cycle oscillations for  $A_{f}>30~\text{mV}$ (as shown in figure 4). In region III, both
 $p^{\prime }$ and
 $\dot{q}^{\prime }$ exhibit phase locking with forcing (figures 5dv and 6dv). Consequently, phase locking between
 $p^{\prime }$ and
 $\dot{q}^{\prime }$ (see figure 8d) is established. The relative phase between
 $p^{\prime }$ and
 $\dot{q}^{\prime }$ oscillates about
 $\overline{\unicode[STIX]{x0394}\unicode[STIX]{x1D719}_{p^{\prime },\dot{q}^{\prime }}}=81.5^{\circ }\pm 22.6^{\circ }$. Thus, the pressure and the HRR oscillations are nearly
 $\unicode[STIX]{x03C0}/2~\text{rad}$ out of phase with each other. As a result, there are alternate cycles of acoustic driving (when
 $\unicode[STIX]{x0394}\unicode[STIX]{x1D719}_{p^{\prime },\dot{q}^{\prime }}<\unicode[STIX]{x03C0}/2$) and damping (when
 $\unicode[STIX]{x0394}\unicode[STIX]{x1D719}_{p^{\prime },\dot{q}^{\prime }}>\unicode[STIX]{x03C0}/2$) in the system such that there is a positive but very low value of net acoustic power production,
 ${\mathcal{P}}=0.02~\text{a.u.}$
In region IV, only  $\dot{q}^{\prime }$ is synchronized with forcing. This is due to period-2 dynamics of the pressure oscillations. We elaborate on the period-2 dynamics in
 $p^{\prime }$ and
 $\dot{q}^{\prime }$ further in § 3.5. Region V is akin to region III and each of the three oscillators remain synchronized. At this point, the relative phase between
 $p^{\prime }$ and
 $\dot{q}^{\prime }$ is observed to oscillate about
 $\overline{\unicode[STIX]{x0394}\unicode[STIX]{x1D719}_{p^{\prime },\dot{q}^{\prime }}}=-277.1^{\circ }\pm 25^{\circ }\sim -3\unicode[STIX]{x03C0}/2\equiv \unicode[STIX]{x03C0}/2~\text{rad}$ (figure 8e). The time-averaged normalized power production is again very low with
 ${\mathcal{P}}=0.04~\text{a.u.}$
For  $0.82<f_{f}/f_{n0}<1$ (regions V, VI and VII), the impact of forcing on the dynamics of the acoustic pressure and HRR oscillations progressively decreases. In this range of
 $f_{f}$, we notice that the
 $\unicode[STIX]{x0394}\unicode[STIX]{x1D719}_{p^{\prime },\dot{q}^{\prime }}$ transitions from a state of phase locking at about
 ${\sim}\unicode[STIX]{x03C0}/2~\text{rad}$ (at
 $f_{f}/f_{n0}=0.82$ in figure 8e), to intermittent phase locking (at
 $f_{f}/f_{n0}=0.83$ in figure 8f), to phase drifting (at
 $f_{f}/f_{n0}=0.85$ in figure 8g), to intermittent phase locking (at
 $f_{f}/f_{n0}=0.93$ in figure 8h) and, finally, to in-phase locking (at
 $f_{f}/f_{n0}=1$ in figure 8i). At
 $f_{f}/f_{n0}=1$, the relative phase between
 $p^{\prime }$ and
 $\dot{q}^{\prime }$ oscillates about
 $\overline{\unicode[STIX]{x0394}\unicode[STIX]{x1D719}_{p^{\prime },\dot{q}^{\prime }}}=13^{\circ }\pm 18.8^{\circ }\sim 0$ (figure 8g). Thus,
 $p^{\prime }$ and
 $\dot{q}^{\prime }$ are in phase and result in maximum acoustic driving, leading to a very high acoustic power production,
 ${\mathcal{P}}=1.3~\text{a.u.}$
Quantifying the effect of forcing on the mutual coupling between acoustic and HRR oscillations. The PLV is plotted as a function of the normalized forcing frequency for  $A_{f}=70~\text{mV}$. Refer to figure 8 for the demarcation of regions I–VII.

Plot depicting the different dynamical states of the thermoacoustic system inside the region marked by III–VI in figure 8. (a,c) Amplitude spectrum and (b,d) phase portrait of the normalized  $p^{\prime }$ and
 $\dot{q}^{\prime }$, respectively. (e) The time evolution of the instantaneous relative phase plot between
 $p^{\prime }$ and
 $\dot{q}^{\prime }$, i.e.
 $\unicode[STIX]{x0394}\unicode[STIX]{x1D719}_{p^{\prime },\dot{q}^{\prime }}(t)$, for the indicated values of
 $f_{f}/f_{n0}$ (last column) at
 $A_{f}=70~\text{mV}$.

We next quantify the effect of forcing on the coupled behaviour of pressure and HRR oscillations. We use PLV to measure the extent of phase locking between the acoustic and HRR oscillations during forcing as defined in (2.2).
Figure 9 plots PLV between the pairs of signals  $p^{\prime }$–
 $\dot{q}^{\prime }$,
 $p^{\prime }$–
 $F$ and
 $\dot{q}^{\prime }$–
 $F$ as a function of the forcing frequency at
 $A_{f}=70~\text{mV}$. The PLV of
 $p^{\prime }$–
 $\dot{q}^{\prime }$ corresponds quite well with the phase-locking characteristics seen in figure 8. For
 $f_{f}/f_{n0}<0.68$, there is an almost monotonic drop in the PLV of
 $p^{\prime }$–
 $\dot{q}^{\prime }$. The decrease in PLV is a result of the presence of desynchronized quasiperiodic dynamics in both
 $p^{\prime }$ and
 $\dot{q}^{\prime }$. The PLV of
 $p^{\prime }$–
 $\dot{q}^{\prime }$ increases to a very high value for
 $0.72<f_{f}/f_{n0}<0.75$, indicating the relatively high synchronized behaviour between them (figure 8d). Following this, we observe a drop in the PLV of
 $p^{\prime }$–
 $\dot{q}^{\prime }$. The drop occurs due to the existence of different dynamics in both
 $p^{\prime }$ and
 $\dot{q}^{\prime }$, where
 $p^{\prime }$ has period-2 dynamics (figure 10biii) and
 $\dot{q}^{\prime }$ has limit-cycle dynamics (figure 10diii). This results in phase drifting in their relative phase (figure 10eiii), and, thus, the low value of PLV between them (discussed further in § 3.5). For
 $0.85<f_{f}/f_{n0}<1.2$, the PLV of
 $p^{\prime }$–
 $\dot{q}^{\prime }$ increases and reaches a value very close to 1 because the forcing becomes ineffective to disrupt the mutual coupling of
 $p^{\prime }$ and
 $\dot{q}^{\prime }$.
The PLV between  $p^{\prime }$ and
 $F$ is also consistent with our observations in § 3.2. It attains a very low value for frequencies where the forcing is insufficient to cause forced synchronization (
 $0<f_{f}/f_{n0}<0.72$ and
 $0.82<f_{f}/f_{n0}<1.2$). Further, its value is quite high whenever forced synchronization of the acoustic response is achieved. Meanwhile, the PLV of
 $\dot{q}^{\prime }$–
 $F$ depicts the large frequency range over which forced synchronization of HRR oscillations is attained (
 $0.59<f_{f}/f_{n0}<0.86$). The increase in PLV at
 $f_{f}/f_{n0}=1$ of
 $p^{\prime }$–
 $F$ and
 $p^{\prime }$–
 $\dot{q}^{\prime }$ is the trivial case when the forcing frequency is approximately the same as the frequency of limit-cycle oscillations, due to which we obtain phase locking between the indicated pair of oscillators.
3.5 Period-2 response of the system during forced synchronization
3.5.1 Varying forcing frequency: $f_{f}/f_{n0}=0.72\rightarrow 0.8$ at $A_{f}=70~\text{mV}$


Now, we consider the response of acoustic pressure and HRR oscillations for  $0.72<f_{f}/f_{n0}<0.8$, which spans regions III–V in figures 8 and 9. At
 $f_{f}/f_{n0}=0.72$ (in region III, figure 8d), there is a phase locking of
 $p^{\prime }$ and
 $\dot{q}^{\prime }$ with the forcing signal (refer to figures 5dvi and 7dvi). From figure 10(ei), we see that
 $p^{\prime }$ and
 $\dot{q}^{\prime }$ exhibit phase locking with each other. From the amplitude spectrum, we note that
 $|\hat{p}(2f_{f})|/|\hat{p}(f_{f})|\sim 10^{-1}$ (figure 10ai). The frequencies which are integer multiples of each other and are of comparable amplitudes manifest in the phase-space trajectory as an additional loop in the limit-cycle attractor of both
 $p^{\prime }$ (figure 10bi) and
 $\dot{q}^{\prime }$ (figure 10di). This is indicative of the period-2 nature of these signals. Other linear combinations of
 $f_{f}$,
 $2f_{f}$ and
 $f_{n1}$ (e.g. peak at
 $2f_{f}-f_{n1}$) are also visible in the spectrum. However, the magnitudes of these additional peaks are quite small and can be ignored. As forcing frequency is increased (
 $f_{f}/f_{n0}=0.72\rightarrow 0.79$), the phase-space trajectory of acoustic pressure oscillations indicates period-2 oscillations more clearly (see figure 10biii). The amplitude spectrum shows that the dominant frequency switches from
 $f_{f}$ at
 $f_{f}/f_{n0}=0.72$ to
 $2f_{f}$ at
 $f_{f}/f_{n0}=0.79$ all the while showing period-2 dynamics in pressure oscillations. In contrast, the dynamics of HRR oscillations loses period-2 oscillations and regains limit-cycle oscillations at
 $f_{f}/f_{n0}=0.79$ (figure 10diii).
Different dynamical states of  $p^{\prime }$ and
 $\dot{q}^{\prime }$ associated with variation in the values of
 $f_{f}$ in regions III to V of figure 8 at
 $A_{f}=70~\text{mV}$. The dynamical states of
 $p^{\prime }$ and
 $\dot{q}^{\prime }$ and the relative phase (
 $\unicode[STIX]{x0394}\unicode[STIX]{x1D719}$) are indicated for different forcing frequencies. The different dynamical states are abbreviated as: LC, limit cycle; QP, quasiperiodic; P2, period-2; PL, phase locking; IPL, intermittent phase locking; PD, phase drifting. The transition of any subsystem from one dynamical state to another with variation in forcing frequency is associated with the following bifurcations (Kuznetsov Reference Kuznetsov2013): LC (figures 5v and 7v)
 $\rightarrow$ P2 (figure 10i) – period doubling; P2 (figure 10iii)
 $\rightarrow$ LC (figure 10iv) – period-halving; and LC (figure 10iv)
 $\rightarrow$ QP – torus-birth (figure 10v).

The different dynamics of  $p^{\prime }$ and
 $\dot{q}^{\prime }$ also affects their mutual coupling, as is observed from figure 10(e). We notice that the instantaneous relative phase plot shows a state of phase locking when both pressure and HRR oscillations have period-2 behaviour (figure 10ei). The state of mutual synchronization between
 $p^{\prime }$ and
 $\dot{q}^{\prime }$ is lost as forcing frequency is increased. The state of phase locking transitions to intermittent phase locking (figure 10eii), and finally to phase drifting (figure 10eiii) when acoustic pressure undergoes period-2 oscillations and HRR undergoes period-1 limit-cycle oscillations. The phase drifting between pressure and HRR oscillations is also responsible for the lowest acoustic power production (
 ${\mathcal{P}}=0.01$) for
 $f_{f}/f_{n0}=0.79$ in region IV (figure 8).
We summarize the dynamics of the two subsystems taking place in regions III–V of figure 8 in table 1. The transition in the dynamics is also indicated in table 1. For example, for  $f_{f}/f_{n0}:0.71\rightarrow 0.72$, the state of
 $p^{\prime }$ changes from limit cycle (LC) to period-2 (P2). The bifurcation associated with this change is a period-doubling bifurcation.
The transition from limit-cycle oscillations to period-2 acoustic oscillations as a result of the increase in the amplitude of forcing. (a) The time trace of  $p^{\prime }$, (b) the amplitude spectra and (c) the phase portrait for
 $A_{f}$ shown in the last column for fixed
 $f_{f}/f_{n0}=0.79$ or equivalently at
 $f_{f}=f_{q}$. Torus-birth and period-doubling bifurcations take place when
 $A_{f}$ is increased from
 $10\rightarrow 30~\text{mV}$ and from
 $30\rightarrow 50~\text{mV}$, respectively.

3.5.2 Varying forcing amplitude: $A_{f}=0\rightarrow 70~\text{mV}$ at $f_{f}/f_{n0}=0.79$


Figure 11 shows the transition of forced response of acoustic pressure oscillations from limit-cycle to period-2 oscillations for increasing  $A_{f}$ at fixed
 $f_{f}/f_{n0}=0.79$ which is at the frequency of the preferred mode of the flame; i.e.
 $f_{f}=f_{q}$. At
 $A_{f}=10~\text{mV}$, the forcing amplitude is too low to effect any noticeable change in the limit-cycle dynamics (figure 11ii). At
 $A_{f}=30~\text{mV}$, the response shows quasiperiodic dynamics, as can be seen from the
 $\mathbb{T}^{2}$-torus in the phase space (figure 11ciii). For
 $A_{f}=50$ and 70 mV, we observe that the amplitude of limit-cycle oscillations at
 $f_{n1}$ undergoes quenching (figure 11biv,v), while the dynamics transitions to pronounced period-2 oscillations (figure 11civ,v).
We conjecture that the observed period-2 behaviour in  $p^{\prime }$ when
 $f_{f}\approx 290~\text{Hz}$ (
 $f_{f}/f_{n0}\approx 0.79$) is due to the forcing signal exciting the fifth harmonic of the glass duct. The fifth harmonic is related to the preferred mode of the flame through the linear relation
 $f_{5}\approx 2f_{q}$ (figure 2b). As a result, the high amplitude of forcing in the frequency range
 $280<f_{f}<300~\text{Hz}$ excites the fifth harmonic of the combustor, resulting in the period-2 behaviour. Similar period-2 behaviour in the acoustic response has been reported in a numerical study by Kashinath et al. (Reference Kashinath, Li and Juniper2018). They reported a period-doubling route to chaos with increasing amplitude of forcing at
 $f_{f}=f_{n0}$. In contrast, we observe period-2 oscillations at
 $f_{f}=f_{q}\neq f_{n0}$. Moreover, we did not observe the period-doubling route to chaos because a further increase in the amplitude of forcing led to a loss of flame stability and the flame undergoes blow-out.
4 Conclusion
In this paper, we study the mechanism through which open-loop control of thermoacoustic instability is attained in a laminar premixed combustor with the aid of synchronization theory. We achieve open-loop control by subjecting the system to external harmonic forcing. We consider the acoustic pressure and HRR fluctuations to be two different oscillators having a disparate response when they are subjected to external forcing.
We draw the following conclusions from our analysis:
(i) We find that the flame possesses a preferred mode whose frequency is disparate from the acoustic eigenfrequencies of the combustor. When the limit-cycle oscillations are forced at a frequency around the frequency of the preferred mode of the flame, there is an amplification in the response amplitude of the HRR oscillations. Concurrently, we observe a reduction of
$90\,\%$ and $99\,\%$ in the r.m.s. value and spectral amplitude of the pressure oscillations relative to the unforced values, respectively. This decrease in amplitude of thermoacoustic oscillations is a result of asynchronous quenching. We hypothesized that asynchronous quenching is observed only below $f_{n0}$ because the frequency of the preferred mode is lower than the frequency of limit-cycle oscillations. We further showed that increasing the amplitude of forcing widens the frequency range over which asynchronous quenching can be effected. In practical systems, the presence of such a large region of quenching would then allow for the effective design of controllers with the flexibility of operation at one of these frequencies.(ii) We show that the synchronization characteristics of the acoustic and HRR responses differ from each other significantly. In particular, we find that HRR oscillations are synchronized to forcing for a broader frequency range than the acoustic pressure oscillations. We also show that the maximum decrease in the amplitude of limit-cycle oscillations is attained only when both the acoustic and HRR oscillations synchronize with forcing.
(iii) We show that forcing causes asynchronous quenching when the forcing frequency is near the frequency of the preferred mode of the flame either (a) by causing the limit-cycle oscillations to be phase-locked with forcing or (b) by changing the dynamics of the acoustic response alone to period-2 oscillations. In the former case, the coupling is established at nearly
$\unicode[STIX]{x03C0}/2~\text{rad}$ out-of-phase, while in the latter case, there is phase drifting between acoustic and HRR oscillations due to differences in their dynamics. In either case, the time-averaged acoustic power production becomes very low, leading to the quenching of acoustic pressure oscillations.(iv) We also provide the experimental evidence of period-2 behaviour in acoustic pressure fluctuations attained during the asynchronous quenching of limit-cycle oscillations. The fifth acoustic mode of the duct is related to the preferred mode of the flame through the relationship
$f_{5}\approx 2f_{q}$. So, forcing near $f_{q}$ triggers the fifth harmonic ($f_{5}$) of the duct and leads to the period-2 oscillations. In this state, dynamics of acoustic pressure oscillations shows period-2 characteristics, while HRR oscillations retain period-1 limit-cycle oscillations.


As a final remark, we note that it may be possible to decouple the acoustic and the HRR response of a real-time combustor by introducing a forcing mechanism capable of perturbing the flame over a range of narrowband frequencies. The choice of forcing frequency depends on the parametric region for which we observe quenching of limit-cycle oscillations. A possible forcing mechanism, other than actuators, could be a strategically placed delta wing or bluff body capable of generating vortices at a particular frequency upstream of the principal flame holder, thus affecting the flame directly. However, the applicability of such an open-loop control in turbulent combustors and practical gas turbine systems through such targeted forcing remains to be explored.
Acknowledgements
A.R. gratefully acknowledges the Ministry of Human Resource Development (MHRD) for funding a PhD through Half-Time Research Assistantship (HTRA). S.M. acknowledges the Institute Post-Doctoral Fellowship, IIT Madras. The role of Mr S. Thilagaraj in fabricating different components of the experimental set-up is gratefully acknowledged. This work was supported by Office of Naval Research Global (contract monitor: Dr R. Kolar) grant no. N62909-18-1-2061. We are indebted to an anonymous reviewer who reviewed our work thoroughly and gave numerous valuable suggestions.
Appendix A. Phase-space reconstruction
We construct the phase space using the delay embedding theorem proposed by Takens (Reference Takens1981). The theorem lays down the conditions under which the phase space can be reconstructed from a sequence of scalar measurements of the system dynamics. The reconstructed manifold has a one-to-one mapping to the original manifold, thus preserving the topology of the manifold and its dynamical invariants such as Lyapunov’s exponent, correlation dimension, etc.
Here, we unfold the original attractor into an  $m$-dimensional Euclidean delay vector space, capturing different segments of history of a given variable
 $X$:
 $$\begin{eqnarray}\displaystyle \unicode[STIX]{x1D743}(t)=[X(t),X(t+\unicode[STIX]{x1D70F}),X(t+2\unicode[STIX]{x1D70F}),\ldots ,X(t+(m-1)\unicode[STIX]{x1D70F})],\quad \unicode[STIX]{x1D743}\in \mathbb{R}^{m}. & & \displaystyle\end{eqnarray}$$
Here,  $X$ represents the measured variables
 $\{p^{\prime },\dot{q}^{\prime }\}$.
For faithfully reconstructing the phase space, determination of the optimum time delay,  $\unicode[STIX]{x1D70F}$, and minimum embedding dimension,
 $m$, is crucial. If
 $\unicode[STIX]{x1D70F}$ is too low, the vectors would be very strongly correlated, while if it is too large, the vectors would be weakly correlated, prone to random noise and numerical inaccuracies. Optimum time lag will result in
 $m$ mutually independent vectors over which the attractor can be unfolded to the maximum possible extent.
The optimum time lag was calculated using average mutual information (Fraser & Swinney Reference Fraser and Swinney1986). The average mutual information indicates the average information about  $X(t+\unicode[STIX]{x1D70F})$ that can be predicted from the original vector
 $X(t)$, and is calculated as
 $$\begin{eqnarray}\displaystyle I(\unicode[STIX]{x1D70F})=\mathop{\sum }_{i=1}^{n}P[X(t_{i})\cap X(t_{i}+\unicode[STIX]{x1D70F})]\log _{2}\frac{P[X(t_{i})\cap X(t_{i}+\unicode[STIX]{x1D70F})]}{P[X(t_{i})]P[X(t_{i}+\unicode[STIX]{x1D70F})]}, & & \displaystyle\end{eqnarray}$$
where  $n$ is the number of samples and
 $P$ is the probability that
 $X(t)$ has a value of
 $X(t_{i})$, and
 $P[X(t_{i})\cap X(t_{i}+\unicode[STIX]{x1D70F})]$ indicates the joint probability. The time at which
 $I(\unicode[STIX]{x1D70F})$ attains its first local minima is considered to be the optimum time delay. For the unforced limit-cycle oscillations, the variations of the average mutual information as a function of the non-dimensional time delay (
 $\unicode[STIX]{x1D70F}f_{n0}$) for
 $p^{\prime }$ and
 $\dot{q}^{\prime }$ are plotted in figures 12(a) and 12(b), respectively.
The average mutual information as a function of the non-dimensional time lag for (a)  $p^{\prime }$ and (b)
 $\dot{q}^{\prime }$ signals during unforced limit-cycle oscillations. The corresponding value of optimum time lag is indicated at the location of the first minima of the average mutual information.

The embedding dimension,  $m$, is determined through Cao’s method (Cao Reference Cao1997). This is an optimized version of the false nearest-neighbour method. A false neighbour to a point in the phase space is that which moves away from its nearest neighbour with an increase in the embedding dimension. In Cao’s method, the number of false neighbours that each point has in the phase space is tracked as the embedding dimension is increased. Given the optimum delay, we can then construct the measure
 $a(i,m)$ as
 $$\begin{eqnarray}\displaystyle a(i,m)=\frac{\Vert X_{i}(m+1)-X_{n(i,m)}(m+1)\Vert }{\Vert X_{i}(m)-X_{n(i,m)}(m)\Vert }, & & \displaystyle\end{eqnarray}$$
where  $i=1,2,\ldots ,(N-m\unicode[STIX]{x1D70F})$ and
 $n(i,m)$ is the index of the point nearest to point
 $X_{i}$ in the phase space. Here
 $\Vert \cdot \Vert$ is the Euclidean norm between two points. We can average over the false neighbours to obtain a measure only dependent on the embedding dimension and the optimum time lag as
 $$\begin{eqnarray}\displaystyle E(m)=\frac{1}{N-m\unicode[STIX]{x1D70F}_{opt}}\mathop{\sum }_{i=1}^{N-m\unicode[STIX]{x1D70F}_{opt}}a(i,m). & & \displaystyle\end{eqnarray}$$
The increase in the measure with an increase in the embedding dimension can be determined by defining  $E_{1}(m)$ as
 $$\begin{eqnarray}\displaystyle E_{1}(m)=\frac{E(m+1)}{E(m)}. & & \displaystyle\end{eqnarray}$$
The minimum embedding dimension required for the input signal  $X(t)$ is determined as the dimension above which
 $E_{1}(m)$ saturates. Since all acoustic and HRR signals that we acquire are deterministic with well-defined periodicity during the state of thermoacoustic instability, the minimum embedding dimension calculated in this manner suffices for our objective (Nair Reference Nair2014). The measure
 $E_{1}$ as a function of the embedding dimension has been plotted in figure 13 for
 $p^{\prime }$ and
 $\dot{q}^{\prime }$ exhibiting limit-cycle oscillations and no external forcing. For unforced cases,
 $m=5$ is enough to reconstruct the limit-cycle attractors; however, for cases where the dynamics shows a quasiperiodic behaviour in the presence of forcing,
 $m=8$ is required. For visualizing the qualitative features of the attractor for all cases, we project the trajectories onto
 $m=3$, as shown in figures 5(c) and 7(c).
The variation of the measure  $E_{1}$ as a function of the dimension (
 $m$) for (a)
 $p^{\prime }$ and (b)
 $\dot{q}^{\prime }$ associated with unforced limit-cycle oscillations, determined from Cao’s method.



