I. INTRODUCTION
Magnesium alloys have found numerous applications such as in automotive, electronics and medical areas due to their extraordinarily high specific strength.Reference Avedesian and Baker1–Reference Luo4 More potential applications in many critical areas are yet to be identified in the short term. However, one of the stumbling blocks for the wider applications of Mg alloys is their low creep resistance. Also problematic are their relatively poor microstructural stability at elevated temperatures and the generally low corrosion resistance, as well as their usually poor tensile ductility due to the hexagonal close-packed (HCP) lattice structure.Reference Burke and Hibbard5–Reference Sheely and Nash8 The particular HCP lattice structure of Mg limits it to less than five independent slip systems, leading to undesirable brittle behavior of its polycrystalline form. It has long been recognized that basal slip dominates the dislocation activities at ambient temperature and under ordinary loading conditions, though sporadic evidence for prismatic slip and even pyramidal slip has been reported.Reference Burke and Hibbard5, Reference Agnew and Duygulu9–Reference Stohr and Poirier14 Twinning has also been exploredReference Barnett15–Reference Wu, Youssef, Koch, Mathaudhu, Kecskes and Zhu17 but the high stacking fault energy needs to be well addressed in the first place. Recent efforts show that severe plastic deformation such as equal channel angular extrusion can significantly enhance the tensile ductility of Mg alloys by activating the nonbasal slip systems.Reference Koike, Kobayashi, Mukai, Watanabe, Suzuki, Maruyama and Higashi11, Reference Chen, Lin, Zeng and Lu18–Reference Yamashita, Horita and Langdon28 However, the details of the underlying mechanisms still await clarification. Grain size effects on the strength and plasticity of Mg and its alloys have also been reported.Reference Chen, Lin, Zeng and Lu18, Reference Choi, Kim, Shin and Bae29–Reference Yang and Ghosh37 It turns out that below a critical grain size twinning is suppressed and grain boundary activities play the dominant role in accommodating plastic strain in Mg,Reference Choi, Kim, Shin and Bae29 in line with many other metals with extremely small grain sizes.Reference Dao, Lu, Asaro, de Hosson and Ma38, Reference Wei, Pan, Wu, Schuster, Kecskes and Valiev39 Recently, carbon nanotubes have been added as reinforcements to Mg alloys to improve their strength and ductility concurrently. Some positive results have been recorded.Reference Dieringa40–Reference Paramsothy, Hassan, Srikanth and Gupta42
To enhance the creep resistance of Mg alloys, considerations should be given to their relatively low melting points, which as such result in low-temperature creep. Researchers have primarily focused on using nanocrystalline ceramic particles as reinforcements in the Mg alloys. Incorporation of hard ceramic particles into Mg and Mg alloys also increases the absolute strength, and as a consequence it further increases the specific strength of Mg and Mg alloys. The pioneering work of Ferkel and Mordike,Reference Ferkel and Mordike43 e.g., shows increased creep resistance by adding SiC nanoparticles into Mg matrix to form a Mg-matrix composite with reinforcement, also termed as a Mg-based metal matrix nanocomposite (Mg-based MMNC). The composite is processed by milling Mg powders and SiC nanopowders together followed by warm consolidation. Microstructural analysis shows that the nanoparticles of SiC reside in the vicinity of the grain boundaries of the Mg matrix, which leads to two orders of magnitude increase in creep resistance vis-à-vis that of pure Mg, in addition to the significantly increased room-temperature strength. The work of Ferkel and Mordike has been followed by several publications using the concept of MMNCs to improve the mechanical properties of Mg alloys. Other reinforcement media have been explored, including alumina (Al2O3), yttria (Y2O3), SiC, titanium (to improve ductility) and so forth.Reference Habibi, Joshi and Gupta44–Reference Wu, Wu, Nie, Deng, Hu, Wang and Zheng58 Fabrication techniques used to this end include powder metallurgy, disintegrated melt deposition (DMD), ultrasonics-assisted casting, high-energy ball milling (mechanical alloying) and friction stir processing and so forth.Reference Jia, Liu, Gao, Zhang and Li51, Reference Rauber, Lohmueller, Opel and Singer55, Reference Wang, Wang, Zhao and Du57, Reference Liu, Gao, Zhang, Zhu and Li59 More recently, Dieringa has provided a comprehensive review on the brief history as well as the state-of-the-art of Mg-based MMNCs.Reference Dieringa40 Mg-based MMNCs have also been investigated by other groups for evaluating the effect of different reinforcements, of their size, shape and volume fractions, on the mechanical properties of the composites.Reference Jia, Liu, Gao, Zhang and Li51, Reference Nie, Wang, Hu, Xu, Wu and Zheng53–Reference Rauber, Lohmueller, Opel and Singer55, Reference Wang, Wang, Zhao and Du57, Reference Lloyd60–Reference Huard, Angers, Krishnadev, Tremblay and Dube64
In this work, we focus on processing of Mg-based MMNC with SiC nanoparticles as the reinforcement medium. We examine the detailed microstructure of the processed MMNC using transmission electron microscopy (TEM) and scanning electron microcopy (SEM) in terms of the particle size, size distribution, and the interparticle spacing. We look at the effect of different volume fractions of the nanoparticles on the mechanical properties of the MMNCs. The MMNC is processed by comilling of the starting Mg powders and the SiC powders followed by hot consolidation. As one of the most outstanding merits of Mg-based MMC/MMNC is its light weight, potential applications in body and vehicle armors have been expected. For such applications, as well as applications in aircraft industries, impact-loading conditions are frequently encountered. However, only limited efforts could be identified in the literature on the dynamic mechanical properties of Mg-based alloys in general, and of Mg-based MMNCs in particular.Reference Guo, Shim and Tan65, Reference Ulacia, Dudamell, Galvez, Yi, Perez-Prado and Hurtado66 In the light of this, we examined the high-strain rate (dynamic) mechanical properties of the processed MMCs/MMNCs by a split-Hopkinson pressure bar (SHPB, or Kolsky bar) system, which utilizes stress wave loading. The experimental results are discussed and future directions are suggested. We have paid special attention to the strengthening mechanisms in Mg-based MMNCs, and suggest that currently available models in the literature fail to provide a satisfactory explanation for the experimental results obtained in this work.
II. EXPERIMENTAL PROCEDURE
In this section, we will describe the details regarding materials processing, microstructural characterization and mechanical testing.
A. Materials processing
Commercially available magnesium powders of 99.8% purity with a mesh size of −325 from Alfa Aesar Corporation (Ward Hill, MA) and 20-nm β-phase silicon carbide (β-SiC) powders from MTI Corporation (Richmond, CA) were used in the present study. The starting (commercially) pure powders of Mg and β-SiC, in the desired volume fraction, were mixed in argon atmosphere inside a glove box to minimize any contamination resulting from powder handling in the atmosphere. These powders were milled together in a SPEX 8000M energetic miller (SPEX SamplePrep LLC, Metuchen, NJ) at room temperature using tungsten carbide grinding vials and zirconia balls. The vials were cooled by a fan, which maintained the temperature rise of the vial below 50 K. Zirconia balls of 10-mm diameter were used and the ratio of the balls to the powder was approximately 10:1 by weight. The powders and the balls were loaded into the vials inside an argon-filled glove box. To avoid any unwanted and excessive cold welding of powder particles amongst themselves, onto the internal surfaces of the vial, or to the surface of the grinding medium during milling, stearic acid of 98% purity from Alfa Aesar Corporation (Ward Hill, MA) amounting to about 3–5 wt% of the total powder charge was used as the process control agent. The pure Mg and mixed powders containing 0, 5, 10 and 15 vol% 20-nm β-SiC were milled for 20 h to form the nanocomposite powders. The mixed and comilled powders of Mg + SiC were transferred to a die for consolidation. All the milled powders were heated by using the sintering system of Dr. Sinter®(Model SPS-1030, SPS Syntex Inc., Kanagawa, Japan). A cylindrical graphite die of 20-mm inner diameter filled with milled powder was set in the equipment, and heated in vacuum (10 Pa or lower), under a compressive load of 50 MPa. The sintering temperature was kept at 575 °C, at a heating rate of 100 °C/min. The holding time at the target sintering temperature was 5 min, followed by a cooling process at a cooling rate of 60 °C/min, with the previously applied compressive load removed. The specimens were then cut into rectangular shapes and polished for mechanical testing.
B. Microstructural analysis
The detailed microstructure of the Mg-MMNC was examined with a transmission electron microscope (TEM; model No. JOEL 2010 JEM, Tokyo, Japan), operated at 200 kV, with a LaB6 filament. The TEM samples were prepared by mechanical thinning a disk to ∼80 μm, followed by dimpling via a Gatan dimple grinder. Electron transparency was obtained by ion mill on a Gatan precision ion polishing system (PIPS). We collected information such as the size and size distribution of the SiC nanoparticles, the interparticle spacing, and the volume fraction of the SiC nanoparticles. Energy-dispersive spectroscopy (EDS) was used to identify the chemistry of some particles.
We also used scanning electron microscopy (SEM; model No. JOEL JSM 6480, Tokyo, Japan) to evaluate the pretesting and postmortem specimens. The purpose of this is to obtain the supplemental microstructural information of the as-processed micro-/nanoparticle-reinforced Mg-based MMCs (MMC/MMNC). SEM analysis was performed on JOEL JSM 6480 operated at 20 KV.
C. Mechanical testing
Quasistatic (∼strain rate 10−3/s) and dynamic (high strain rate, ∼103/s) mechanical properties of the processed Mg-based MMC/MMNC have been evaluated, both under uniaxial compressive loading. We used the MTS 810 hydroservo system (MTS Systems Corporation, Eden Prairie, MN) to perform the quasistatic compression. The specimens were of rectangular shape with square loading faces. The dimensions of the quasistatic specimens were 2.50 × 2.50 × 5.00 mm (5.00 mm is for the gauge length). Both the loading faces and side faces were polished before mechanical loading. We applied lubricant between the loading faces and the compression platens to mitigate friction. The strain rate was controlled by the crosshead speed. The loading frame has a self-alignment feature. The strain was calculated based on the displacement of the crosshead and therefore we did not attempt to derive the elastic modulus from such quasistatic compression due to the machine compliance issue.
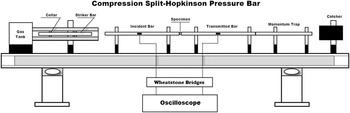
To evaluate the high-strain-rate mechanical properties of the processed Mg-based MMC/MMNC, we used a compressive Kolsky bar system, which uses stress waves to load the specimen. The dimensions of the dynamic specimens were 2.50 × 2.50 × 2.00 mm (2.00 mm is for the gauge length). Details of this system, including the working principle, data processing, system design as well as precautions can be found in a recently published monograph by Chen and Song.Reference Chen and Song67 Concise descriptions and discussions of this technique have been provided by FollansbeeReference Follansbee68 or Nemat-Nasser.Reference Nemat-Nasser, Kuhn and Medlin69Figure 1 is a schematic view of such a system. Briefly, in this experiment, the specimen is sandwiched between two elastic bars made of the same high-strength alloy steel (maraging steel) and of the same diameter, called the input (or incident) bar and the output (or transmitter) bar, respectively. When a projectile (or bullet, also made of the same material as the input/output bars and of the same diameter) is launched by releasing the pressurized gas from the gas tank, it impacts the input bar where a stress wave is generated. The stress wave then travels down the input bar. At the interface between the input bar and the specimen, part of the stress wave is transmitted to the specimen, and part of it is reflected back into the input bar. The stress wave within the specimen continues to travel back and forth within the specimen until equilibrium is reached. The specimen will be deformed plastically under proper conditions. Also a part of the stress wave is transmitted into the output bar. Strain gauges are attached both to the input and output bars to capture the stress wave signals which are recorded by a high-speed multichannel oscilloscope. Lubricant is applied between the bars and the specimen interfaces to alleviate friction. By processing the reflected and transmitted stress wave signals, dynamic stress strain curves can be obtained which provide faithful and valuable high-strain-rate mechanical properties of the specimens. Since its advent, Kolsky bar has been well articulated and has become a powerful tool for the evaluation of dynamic mechanical properties of various materials.Reference Chen and Song67 Whereas its most common use is to measure the dynamic response of specimens at ambient temperature and ∼103 s−1 strain rate, many variations have been developed for the examination at higher strain rateReference Jia and Ramesh70 and different temperatures.Reference Li, Guo, Hu and Wei71
Schematic of a desktop compression Kolsky bar system [or Split-Hopkinson Pressure bar (SHPB)], with the major components shown. The catcher is made of lead to absorb the momentum of the trap.

III. EXPERIMENTAL RESULTS
In what follows, we will first describe the microstructure of the Mg-based MMNC based on our TEM and SEM observations. We will then provide experimental results from quasistatic and high rate loading. This will be followed by post loading microstructural examinations.
A. Microstructure of the Mg-based MMNC
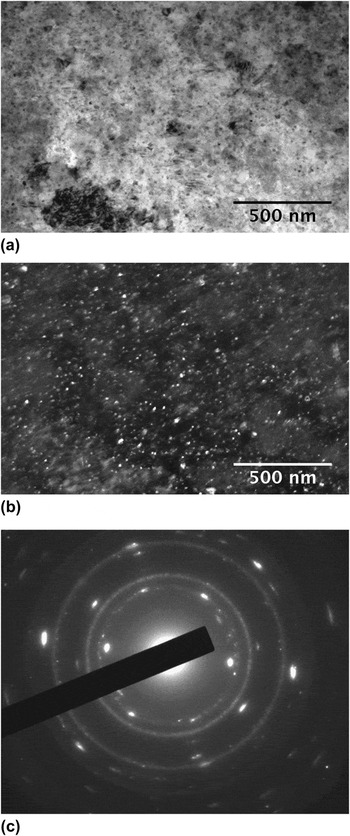
Figure 2(a) displays the bright-field TEM image of Mg-based MMNC with 5 vol% SiC nanoparticle. The inset is the selected area diffraction pattern (SADP). It shows that the SiC particles are very fine as suggested by the continuous rings in the SADP as well as the bright- and dark-field TEM micrographs. It also shows that the grain size of the Mg-matrix is very fine. Figure 2(b) is the corresponding dark-field TEM image taken using diffracted electrons from the SiC phase. Again it shows the nanometer-size SiC particles. Indexing of the SADP suggests that the SiC phase is of the cubic lattice structure. Both the bright-field and dark-field TEM micrographs suggest that the nanoparticles of SiC are uniformly distributed in the MMNC. Some large particles of Mg with a high density of defects (presumably dislocations) are present in this sample, indicating some agglomerations of the matrix phase during the comilling process even in the presence of the process control agent. Growth might have occurred during the warm consolidation process that led to the current observed particle size. No significant agglomeration of the SiC particles can be identified in this sample.
(a) Bright-field TEM image of 5 vol% SiC MMNC. The nanoparticles appear to be uniformly distributed within the matrix. Some large agglomerates of the Mg-matrix are present. (b) Dark-field TEM image corresponding to (a). The dark bright particles are the nanoparticles of the β-SiC phase. (c) SADP of the sample. This pattern can be indexed according to the cubic β-SiC phase and the hcp Mg matrix.

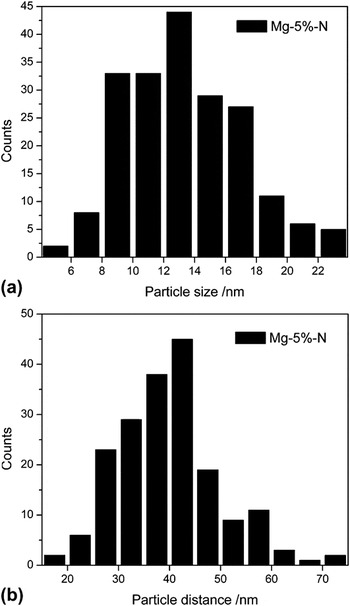
Figure 3(a) presents the SiC particle size distribution of the Mg-5 vol% SiC MMNC sample based on statistics of the TEM images. As we have mentioned in the Sec. II, the starting SiC particles have an average particle size of ∼20 nm. It follows from Fig. 3(a), then, that the SiC particles have been further refined during ball milling, as the majority of the particles in the MMNC have size smaller than 20 nm. Figure 3(b) shows the interparticle spacing distribution of the Mg-5 vol% SiC MMNC sample based on statistics of the TEM images. It suggests that the majority of the particles have interparticle distance smaller than 100 nm. This observation should be translated into an effective grain size of the Mg-based MMNC smaller than 100 nm. This is broadly in line with our x-ray diffraction line-broadening analysis results, which provide an average grain size for Mg matrix of the order of 57 nm.
(a) Particle size distribution in the Mg-5 vol% SiC MMNC. Most of the particles have been refined during the comilling process as the start SiC powder has an average particle size of ∼20 nm. (b) The distribution of the interparticle distance in the Mg-5 vol% SiC MMNC. It shows that the interparticle distance is mostly below 60 nm.

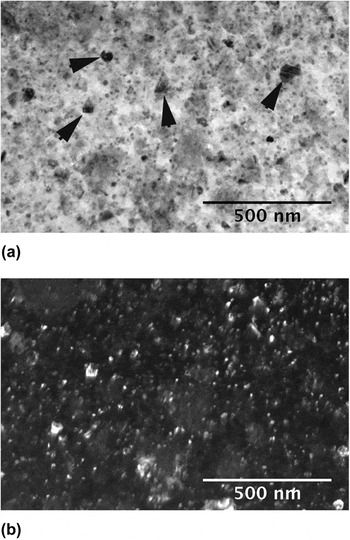
Figures 4(a) and 4(b) are the bright-field and the corresponding dark-field TEM micrographs of the Mg-10 vol% SiC MMNC sample. The SADP (not shown here) shows again continuous rings for the SiC phase with a cubic structure. The particle size distribution of this sample is quite similar to that of the Mg-5 vol% SiC MMNC sample, and is thus not included here. This is not surprising, as the particle size of the SiC phase should primarily depend on the milling time with other conditions kept the same. Comparing Figs. 3(a) and 4(a), we can see the latter have some ∼100 nm or smaller particles with irregular, faceted shapes (some of them are marked by arrows). That is to say, with increased volume fraction of the ceramic phase, agglomeration of the nanoparticles of SiC has occurred during the comilling process. It might also be possible that such particles were the preexisting particles in the starting ceramic powder, which somehow survived the comilling process without breaking up. As a matter of fact, this surmise is more reasonable as we will show later that such particles are single crystal particles, thus unlikely to be formed by agglomeration during the comilling process. A detailed TEM analysis will be presented on such large SiC particles when we describe the microstructures of the Mg-15 vol% SiC MMNCs sample. Less agglomeration of the Mg matrix phase has been observed in this sample. This is understandable as increased volume fraction of the SiC nanoparticles can both prevent agglomeration of the Mg phase and retard its further growth during subsequent growth, as the SiC nanoparticles can work as grain boundary pinning centers (Zenner pinning effect). The interparticle distance of this sample is smaller compared with the previous sample, with the interparticle distance in majority of the cases being smaller than 60 nm. Again this is consistent with our XRD line profile analysis results, which suggest that the volume average grain size of the Mg-matrix is about 43 nm.
(a) Bright-field TEM image of the Mg-10 vol% SiC MMNC. Again the nanoparticles of the β−SiC phase appear to be uniformly distributed. However, large particle are seen in this material, with some of the large particles marked by black arrows. (b) Dark-field TEM image corresponding to (a). The bright particles in the dark-field TEM image is the β-SiC phase.

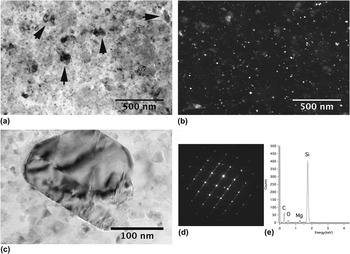
Figure 5(a) is the bright-field TEM image of the Mg-15 vol% SiC MMNC, with Fig. 5(b) being the corresponding dark-field image. Similar to the previous sample, some ∼100-nm SiC particles are observed in this sample. To confirm that such large, faceted particles are indeed the SiC phase, we have performed some detailed analytical TEM examinations on one such particle. Figure 5(c) is a bright-field TEM micrograph of such a particle. The particle is clearly faceted. Figure 5(d) is the diffraction pattern of this particle. This diffraction pattern is indexed to be from the [011] zone of the cubic SiC phase (zinc blende structure). It should be noted that this particle, as well as many other such particles of similar size, has single crystal structure. It is thus unlikely that they were formed by agglomeration during the comilling process. Further, Fig. 5(e) is the energy dispersive x-ray spectroscopy (EDS) result of this particle. It clearly shows that it is the SiC phase. Therefore, we believe that such relatively large SiC particles come from the starting ceramic powder and have survived the comilling process. The primary particle size distribution (not included here) is similar to that of the previous two samples, which can be explained in a similar manner. The interparticle spacing of the majority of the nanoparticles is smaller than 45 nm. This interparticle spacing result is consistent with the XRD peak broadening analysis result for this sample, which gives an average grain size of the Mg matrix of the order of 26 nm. It should be kept in mind that XRD analysis tends to underestimate the grain size of severely deformed samples as compared with TEM examination.Reference Zhang, Alexandrov, Valiev and Lu72
(a) Bright-field TEM image of the Mg-15 vol% MMNC sample. Again large particles with size around ∼100 nm are seen. Some of these large particles are marked by arrows. (b) Dark-field TEM image of (a), the bright particles being the β-SiC phase. (c) An enlarged view of one of the large particles in this material. It is faceted, with stacking faults or twinning in the particle. (d) SADP from the faceted particle of (c), which is from the [011] zone of the β-SiC cubic phase. This SAD pattern can be indexed to be from two twinned crystals. (e) Energy-dispersive spectroscopic result from the particle of (c). It shows clearly that the particle is the β-SiC cubic phase.

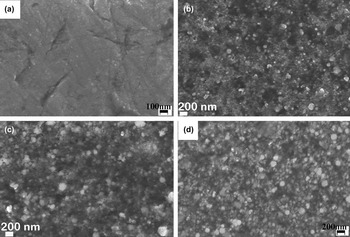
Finally, Fig. 6 presents the SEM micrographs of pure Mg consolidated from 20-h ball milled Mg powders (a), and Mg-based MMNC samples with 5 (b), 10 (c) and 15 (d) vol% SiC nanoparticles, respectively. Figure 6(a) just suggests single-phase Mg metal. The rest of the images included in this figure indicate that with increased volume fraction of the SiC nanoparticles, Mg-agglomerates decreased, and the size of large Mg particles is also decreased. This is qualitatively consistent with the TEM analysis. However, the nanoparticles of the SiC phase are beyond the resolving power of the SEM. It should be pointed out that neither TEM nor SEM reveals significant evidence for porosity in the processed MMNCs.
Scanning electron micrographs (back scattered images) of consolidated pure Mg (a), Mg-5 vol% SiC MMNC (b), Mg-10 vol% SiC MMNC (c) and Mg-15 vol% SiC MMNC, respectively. In (b–d), the lighter particles are the SiC particles due to charging effect (SiC is an insulator). Thus we can see that the as-processed MMNC samples have some large reinforcement particles. Notice the scale bar of (d) is different from other images.

In summary, our TEM and SEM examinations show that the size of the SiC reinforcements has been further reduced by comilling with the matrix phase. The final particle size seems not changed with the volume fraction of the SiC phase. The interparticle distance of the 5-vol% SiC MMNC is smaller than 100 nm, and the interparticle distance of the Mg-based MMNC decreases with increase in the volume fraction of the SiC nanoparticles. Agglomeration of the matrix phase has been observed primarily in the 5-vol% SiC MMNC, where TEM reveals Mg-particles of ∼100 nm or larger diameter. It appears that some large SiC particles, with average size greater than 100 nm, have survived the comilling process. This has been confirmed both by diffraction analysis and EDS results. The high processing temperature might have led to recrystallization of the Mg matrix,Reference Doherty, Hughes, Humphreys, Jonas, Jensen, Kassner, King, McNelley, McQueen and Rollett73 but dislocations might have been generated during cooling because of the mismatch of the coefficients of thermal expansion between Mg and the SiC particles.Reference Garces, Onorbe, Perez, Klaus, Genzel and Adeva74
B. Mechanical properties of the Mg-based MMNC
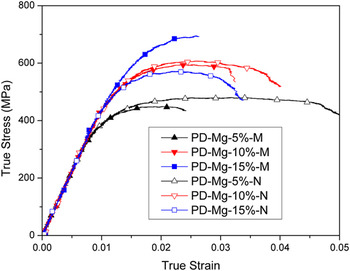
Figure 7 displays the representative quasistatic stress-strain curves of the Mg-based MMNC, along with the MMC control samples. In this plot, the last capital letter of the legend of each sample, M or N, means the sample is either the MMC (M) or MMNC (N). PD stands for “pressing direction,” indicating that the loading direction during mechanical testing is along the hot-pressing direction during materials processing. It can be observed that for the nanocomposites, the compressive plasticity, or malleability, of the samples decreases with increased volume fraction of the SiC nanoparticles. The MMNC sample with the lowest volume fraction of SiC (5%) exhibits the lowest strength. The 10 vol% SiC MMNC sample shows much higher strength that the 5 vol% SiC sample. However, on further increasing the SiC volume fraction, the strength of MMNCs appears to reach saturation level, as the strength of the Mg-15 vol% SiC MMNC sample is even lower than that of the Mg-10 vol% SiC MMNC sample. Similar results have been reported in an Al-based MMNC (the authors’ unpublished work). This is in sharp contrast with the conventional MMC as suggested by the stress strain curves in Fig. 7. With the increase of the volume fraction of the SiC particles, the strength of the conventional MMC keeps increasing, showing no sign of saturation. Overall, the malleability of the MMNC samples is improved in comparison with their conventional MMC counterparts of the same volume fraction of the reinforcement phase. Whereas the strength of the nanocomposites containing 5 and 10 vol% ceramic phase is slightly higher than that of the microcomposites with the same amount of microsized ceramic particles, the strength of the nanocomposites containing 15 vol% of ceramic nanoparticles is much lower than that of the microcomposite containing the same amount of ceramic microsized particles. However, all the samples exhibit quite poor malleability.
Quasistatic true stress versus true strain curves of the micro- and nanoparticle-reinforced Mg-based composites. The curves with solid symbols are for the conventional MMCs, whereas those with hollow symbols are for the nanoparticle-reinforced MMNCs. PD means the loading is in the hot pressing direction.

It should be noted that all the tested samples failed during quasistatic compressive loading.
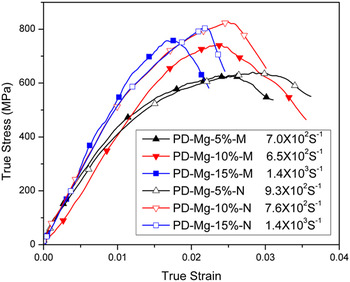
Figure 8 gives the representative high-strain-rate true stress-true strain curves of Mg-based MMNC samples along with those of the MMC controls. Again, the loading direction is in the hot-pressing direction. It shows that under dynamic loading, all the samples are quite brittle and show little or no observable plastic deformation. In the MMNC samples, the dependence of the peak stress on the volume fraction of the nanoparticle SiC exhibits trend similar to that of the quasistatic strength. That is to say, with increased volume fraction of SiC nanoparticles, the dynamic peak stress of the MMNC increases, but it saturates at high volume fraction, as the dynamic peak stress of the Mg-15 vol% SiC MMNC sample is slightly lower than that of the Mg-10 vol% SiC MMNC sample. Again, such behavior is in contrast with the conventional MMC samples. All dynamically loaded MMC and MMNC samples were pulverized.
High-strain-rate true stress-strain curves of the Mg-based composites. The solid symbols are for the conventional MMCs reinforced with microsized SiC particles (M in the legend), and the hollow symbols are for the nanoparticle-reinforced MMNCs (N). As the materials are very brittle, all samples pulverized upon high-strain rate loading. In these samples, only the peak stresses are used to indicate the dynamic strength of the samples.

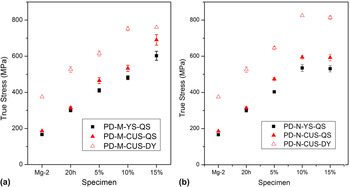
To facilitate comparison among the samples, we have collated the quasistatic yield strength (YS) and compressive ultimate strength (CUS), as well as the dynamic (DY) compressive ultimate strength (or peak stress). Figures 9(a) and 9(b) show the compressive quasistatic (QS) yield strength and CUS and the dynamic CUS as a function of the volume fraction of the β-SiC particles for the Mg-based MMC controls and the MMNC samples, respectively. All samples were loaded in the pressing direction. In these two plots, below the abscissa, Mg stands for the as received pure Mg; Mg-0%20 h designates the 20-h ball-milled pure Mg followed by consolidation; 5, 10, and 15% are the volume fractions of the SiC reinforcements. Figure 9(a) suggests that ball milling of the pure Mg-powder increases the quasistatic yield strength and maximum stress, as well as the dynamic peak stress. It also shows that the strength of the conventional Mg-based MMCs increases almost linearly with the volume fraction of the microsized SiC particles. The leveling off of the dynamic peak stress of the conventional MMC at higher SiC volume fraction might be due to early failure of the specimen under dynamic loading. On the other hand, for the nanoparticle-reinforced MMNCs, all strength values saturate at high SiC volume fractions. Figure 9(b) shows that the QS yield strength; the QS and dynamic CUS of the 15 vol% SiC MMNC samples are all lower than those of the 10 vol% SiC MMNC samples. It then means that strengthening effect of the SiC nanoparticles saturates beyond ∼10 vol%.
Yield strength (YS) and maximum stresses (compressive ultimate stress—CUS) of the conventional Mg-based MMC reinforced with microsized particles samples (a) and those Mg-based MMNC samples reinforced with nanoparticles of SiC (b). Mg-2 means pure, as received Mg. 20 h means pure Mg milled for 20 h followed by warm consolidation. DY means dynamic loading. All samples were loaded in the hot-pressing direction (PD). 5, 10 and 15% are the volume fraction of the reinforcement phase.

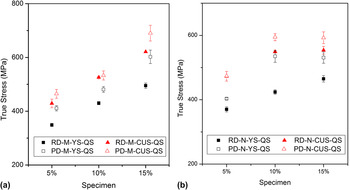
Due to the asymmetric stress distribution of the material during the hot-pressing consolidation process, density and microstructure of the product may be anisotropic, leading to anisotropic mechanical behavior. In view of this, we have also tested samples in the radial direction. Figure 10 displays the collection of quasistatic strength data in the pressing direction (PD) and radial direction (RD). Figure 10(a) indicates that for all the compositions, the conventional Mg-based MMC samples are stronger in the pressing direction than in the radial direction. The MMNC samples exhibit a similar trend.
Comparison of the strength of the conventional Mg-based MMC samples (a) and the nanoparticle-reinforced Mg-MMNC samples (b) between the pressing direction and radial direction. In either case, the PD samples are consistently stronger than their RD counterparts, indicating some anisotropy in the mechanical properties of the hot pressed materials.

It is interesting to notice from a comparison between Figs. 9(a) and 9(b) that, under uniaxial quasistatic compressive loading, the strengths of the MMNC samples with 5 vol% β-SiC nanoparticles are almost the same as those of MMCs with the same volume fraction of microparticle of SiC. However, at 10 vol% SiC, the strengths of the MMNCs surpass those of the MMCs (see Fig. 9). However, as the volume fraction of β-SiC phase is increased to 15 vol%, the strengths of the MMNC samples become lower than those of the MMCs. In other words, this indicates that the strengthening effect of the nanoparticle SiC reinforcement has reached its limit somewhere between 10 and 15 vol%, as we have mentioned previously. On the other hand, the high-rate strength or peak stress values of MMNC samples are higher than those of the MMC samples for all the volume fractions of the SiC phase. This observation suggests that the nanoparticles of SiC are more effective in strengthening the Mg matrix at dynamic loading rates. In other words, the MMNC samples show stronger rate dependence than the MMC samples.
C. Post loading SEM examinations of the Mg-based MMNC
For investigating the fracture process of the MMNC samples, we have performed detailed SEM analysis of the fracture surfaces of the MMNC samples with different volume fractions of the nanoparticle SiC phase. As the dynamic samples were all pulverized upon high-strain rate compression, in what follows, we will focus on the quasistatic samples.
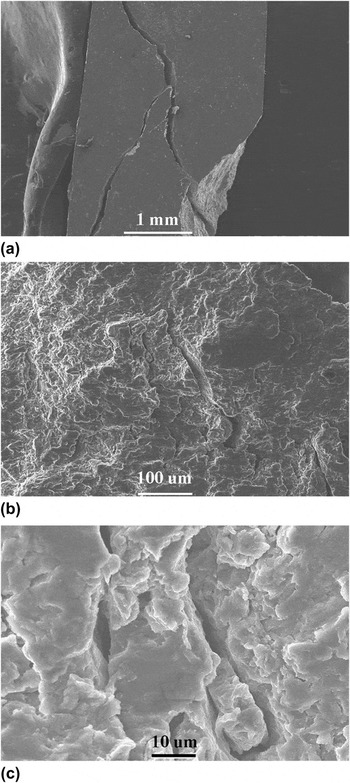
Figure 11 displays SEM images of the fracture surface of a representative Mg-5 vol% SiC MMNC. The sample was broken into two pieces. We have partially recovered the specimens and have put the broken pieces together, with an example displayed in Fig. 11(a). This image shows that the cracks are off-axis ones and they might have been initiated from the specimen corners. These cracks are unlike the cracks seen in completely brittle materials such as ceramics where axial cracks prevail under uniaxial compression. No additional macrocracks are visible from the low-magnification SEM micrograph. An enlarged view [Fig. 11(b)] shows a few microcracks on the fracture surface. Figure 11(c) displays multiple microcracks.
(a) Low-magnification SEM micrograph of the fractured specimen of Mg-5 vol% SiC MMNC partially recovered after quasistatic loading. The sample was broken into several pieces. Loading was roughly in the vertical direction. This low-magnification SEM image reveals off-axis cracks, presumable initiated from the specimen corners. (b) Medium-magnification SEM micrograph of the same sample, showing microcracks on the fracture surface. (c) High-magnification SEM micrograph of multiple microcracks. All images show minor evidence for ductile fracture.

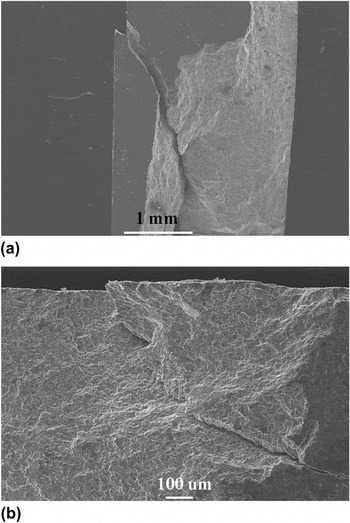
Figure 12(a) is the low magnification SEM image of a partially recovered quasistatic sample of Mg-10 vol% SiC MMNC. Again, off-axis cracks are identified, similar to these observed in the previous sample. It appears that the sample was fractured along a major plane, as a primary crack can be observed at the top right corner of the specimen. Figure 12(b) presents an enlarged view of the primary crack.
(a) Low-magnification SEM of a fractured sample of Mg-10 vol% SiC MMNC partially recovered after quasistatic loading. Loading is roughly in the vertical direction. (b) An enlarged view of fracture surface to show the macrocrack. Loading was in the horizontal direction in (b). No strong evidence for ductile fracture can be found in this sample.

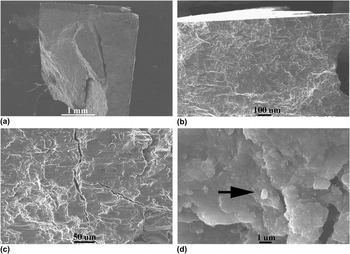
Figure 13(a) is the SEM image of a partially recovered quasistatic Mg-15 vol% SiC MMNC. In this case, more or less axial cracks are present, similar to very brittle materials under uniaxial compression. The sample was broken into several pieces upon quasistatic compression. The fracture surface appears flat. At relatively high magnification, numerous cracks can be seen [Fig. 13(b)]. Figure 13(c) shows cracks and crack branching in this sample. No evidence of ductile fracture can be found in this sample. Figure 13(d) is a high magnification of a local region. The bright particle marked by the black arrow seems to be the SiC phase. This is because, first, considerable charging was observed during SEM analysis, indicating that this particle is insulating, and second, EDS (not shown here) suggests that it is indeed the SiC phase. This SiC particle is about ∼1.0 μm in size. Therefore, we can reasonably believe that such particles can play as stress concentrators, leading to crack initiation during mechanical loading.
(a) Low-magnification SEM image of specimen of Mg-15 vol% SiC MMNC partially recovered after quasistatic loading. Loading is roughly vertical. The sample was broken into a few pieces upon quasistatic compression. The fracture surface is quite flat, and typical of brittle fracture. (b) An enlarged view of the fracture surface, showing cracks on the surface. (c) Cracks and crack branching in this sample. (d) A high-magnification SEM micrograph. The arrow points to a particle of size close to 1.0 μm. The light (bright) contrast of this particle comes from charging of the insulating SiC phase. EDS analysis (not shown here) also indicates that the particle is SiC.

In summary, SEM fractography indicates that large cracks exist on the fracture surface of the Mg-MMNC samples with the highest volume fraction of reinforcement. Whereas the samples with relatively low SiC content exhibit limited evidence of ductile failure, with off-axis cracks presumably initiated from the specimen corners, the 15 vol% SiC samples were broken into several pieces whose partially recovered sample shows axial cracks. The fractography observations are thus consistent with the quasistatic stress-strain curves, which show that the malleability of the Mg-based MMNC decreases with increasing volume fraction of the reinforcement. Detailed analysis indicates that certain large size SiC particles remain in the MMNC, which may be responsible for the low malleability of the MMNC samples. Such particles can be the stress raisers.
IV. DISCUSSION
A. Microstructural features
It is well known that the mechanical properties of structural materials are determined by their microstructure. Particularly, for discontinuously reinforced MMCs, mechanical properties are dependent on the type, size, volume fraction and geometrical shape of the reinforcing particles.Reference Lloyd60, Reference Ibrahim, Mohamed and Lavernia75–Reference Yadav, Chichili and Ramesh81 The microstructure of a discontinuously reinforced MMC can be characterized by the following parameters: the average particle size (d), volume fraction of the particles (fv), and the average interparticle spacing (λ), which is also the thickness of the metallic ligament between the two neighboring particles. These parameters can be related to one another as followsReference Ravichandran82:
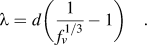 $$\lambda = d{\bigg(}{1 \over {f_v^{1/3} }} - 1{\bigg)}\quad.$$
According to Eq. (1) and the average particle size (∼14 nm) as shown in Fig. 3 for the 5 vol% MMNC, the calculated interparticle spacing is ∼24 nm, which is about half the measured interparticle spacing (∼45 nm) as shown in Fig. 3(b). Han et al.Reference Han and Dunand62 used the Hellman-Hillert approach to calculate the interparticle spacing as follows:
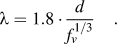 $$\lambda = 1.8 \cdot {d \over {f_v^{1/3} }}\quad.$$
This equation results in a calculated interparticle spacing of ∼68 nm, which overestimates the interparticle spacing as compared with the measured result. Yet from the Humphrey estimation,
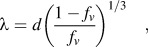 $$\lambda = d\left( {{{1 - f_v } \over {f_v }}} \right)^{1/3} \quad,$$
the calculated interparticle spacing is ∼37 nm, still slightly underestimating the inter-particle spacing between the SiC nano-particles. Finally, based on a simple geometrical model, Han et al. derived the following equation,Reference Han and Dunand62
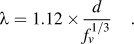 $$\lambda = 1.12 \times {d \over {f_v^{1/3} }}\quad.$$
Using Eq. (4) for our experimental results, the calculated interparticle spacing is then ∼43 nm. This result is the one in closest agreement with the experimentally measured interparticle spacing. However, this nice agreement appears fortuitous. We believe that the calculated results should be taken as significant in a statistical sense as distribution of either the particle size or the interparticle spacing, which is unavoidable. Each equation has its own assumptions and the geometrical models that simplify the analytic derivation, therefore only approximate the experimental scenario. Another point of importance is that clustering of the nanoparticles prohibits accurate theoretical calculations of the interparticle spacing, as each of the above formulas assumes a single value for the particle size, and does not factor the clustering effect into consideration.
Application of the above equations to the Mg-based MMNCs reinforced with 10 and 15 vol% SiC nanoparticles should result in further reduced interparticle spacing values. For example, the Han-equation [Eq. (4)] gives ∼33.8 and ∼30 nm interparticle spacings for the 10 and 15 vol% SiC nanoparticle-reinforced MMNCs, respectively (assuming ∼14 nm for the average nanoparticle size), close to the experimental results based on TEM measurements. However, we see that an exact agreement is missing among the calculated, TEM and XRD grain size analyses. This is not surprising as in such MMNC materials, a clear definition of grain size is lacking.
Both experimental results and calculations indicate that the interparticle spacing of the SiC nanoparticle-reinforced Mg-based MMNCs of this work is below 50 nm, which is in the true nanometer regime. Apparently, such interparticle spacing will lead to similar effective grain size of the Mg-matrix phase, and will impart strong effect on the mechanical behavior of these MMNCs in terms of the strengthening mechanisms.
B. Strengthening effects
A few strengthening mechanisms have been proposed for discontinuously reinforced MMCs with micrometer-sized particles.Reference Han and Dunand62, Reference Ibrahim, Mohamed and Lavernia75, Reference Clyne and Withers76 As pointed out by Nan and Clarke,Reference Nan and Clarke83 there are generally two approaches in the literature regarding theoretical treatment of the strengthening effect in MMCs. The first one is based on dislocation plasticity, including various dislocation blocking mechanisms that may contribute to the strengthening effect due to the presence of the “rigid” reinforcing particles. The second is based on micromechanics in the context of the Eshelby inclusion theory.Reference Eshelby84 In the former, particle size effect can be dealt with in a natural manner as in the effective medium approach proposed by Nan and Clarke.Reference Nan and Clarke83
It should be noted that there are two types of size effect.Reference Groh, Devincre, Kubin, Roos, Feyel and Chaboche85 The first is the grain size effect, or Hall-Petch effect which is based on the notion that grain boundaries (GBs) are barriers to dislocation motion, and thus dislocations tend to pile-up in front of a GB, and because of this reason, refined grain size translates into increased yield or flow strength of the material.Reference Hall86, Reference Petch87 Other equally valid theories have also been proposed to explain the empirical Hall-Petch relation, such as GBs as sources or sinks of dislocations,Reference Li88 geometrically necessary dislocations (GNDs) to account for the compatibility of polycrystalline plasticity,Reference Ashby89 and dislocation avalanche as collective behavior in the presence of GBs.Reference Louchet, Weiss and Richeton90 For pure Mg, the Hall-Petch relation in the literature is based on powder-metallurgy-processed samples,Reference Choi, Kim, Shin and Bae29 and consists of three regimes. In the first regime, a steep Hall-Petch relation is observed with a large Hall-Petch coefficient of the order of ∼13 GPa.nm1/2. However, this behavior levels off when the grain size is smaller than 1000 nm, and in this second regime, the Hall-Petch coefficient is only of the order of 1.16 GPa.nm1/2, which is one order of magnitude smaller than that of the first regime. When the grain size is below 100 nm, the grain size effect enters into the third regime where an inverse Hall-Petch relation is observed in the powder-metallurgy-processed monolithic magnesium. Whereas it is possible that artifacts may exist in such experimental results from porosity, poor interparticle bonding, and so on, it is also highly possible that such behavior represents the intrinsic properties of monolithic magnesium based on the following reasons. First, as the authors have observed, the strain rate sensitivity (SRS, defined as 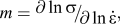 $m = {\raise0.7ex\hbox{${\partial \ln \sigma }$} \!\mathord{\left/ {\vphantom {{\partial \ln \sigma } {\partial \ln \dot \varepsilon }}}\right.\kern-\nulldelimiterspace}\!\lower0.7ex\hbox{${\partial \ln \dot \varepsilon }$}},$ where σ is the yield or flow stress and
 $\dot \varepsilon $ is the imposed strain rate) of monolithic Mg increases almost in a manner of the Hall-Petch relation, viz. m is nearly proportional to the inverse square root of the grain size. When the grain size is ∼50 nm, the SRS is about 0.1, suggesting that plasticity other than dislocation mechanisms-related is operating, including GB sliding,Reference Wei91 GB shufflingReference Dao, Lu, Asaro, de Hosson and Ma38 and grain rotation,Reference Shan, Stach, Wiezorek, Knapp, Follstaedt and Mao92 and so on. This can be understood based on the fact that the melting point of monolithic magnesium is only 923 K, and room temperature (300 K) translates to 1/3 of the melting point of Mg. Therefore, GB activities can prevail in nanocrystalline Mg to accommodate plastic deformation, which brings about the inverse Hall-Petch effect in the nanocrystalline regime. Based on this reasoning, we believe that grain size refinement in the nanoparticle-reinforced MMNCs will not be of much benefit in terms of strengthening in these materials, as the interparticle spacing is smaller than 50 nm, which happens to be in the third regime of the grain size effect of the monolithic Mg. We can also argue alternatively that dislocation pile-up within such small space is practically impossible, as pointed by Groh et al.Reference Groh, Devincre, Kubin, Roos, Feyel and Chaboche85 Our TEM observations did not find evidence for dislocation pile-up in the matrix between the SiC nanoparticles.
The second size effect stems from the dislocation line tension and confinement, which gives rise to a dependence of the critical stress on the inverse of a characteristic length, such as the distance between unshearable obstacles. Operations of the Frank-Read source and the Orowan mechanism serve as typical examples for the second size effect. Traditionally, as has been pointed out previously, Orowan strengthening in the presence of second phase particles or reinforcing ceramic particulates is regarded as one of the primary contribution to the elevated strength of MMCs with mcirometer-sized ceramic particles.Reference Lloyd60, Reference Ibrahim, Mohamed and Lavernia75, Reference Clyne and Withers76, Reference Mortensen, Llorca, Clarke, Ruhle and Zok93 When dealing with particle size effect, Nan and Clarke considered four contributionsReference Nan and Clarke83 to the strength increase due to the presence of the reinforcing particles. The first is the Orowan stress as
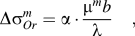 $$\Delta \sigma _{Or}^m = \alpha \cdot {{\mu ^m b} \over \lambda }\quad,$$
where λ is the average interparticle spacing, given in Ref. Reference Nan and Clarke83 as
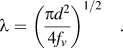 $$\lambda = \left( {{{\pi d^2 } \over {4f_v }}} \right)^{1/2} \quad.$$
In Eq. (5), μm is the shear modulus of the matrix, b the Burgers vector of the dislocations of the matrix material and α a geometric factor of the order of unity. Using the parameters of Mg (shear modulus 16.6 GPa, Burgers vector 0.321 nm), and the measured interparticle spacing for 5 vol% MMNC, the Orowan stress contribution is ∼120 MPa. However, from Eq. (6), we can see that for a given volume fraction, the interparticle spacing should decrease with decreasing particle size in a linear fashion. Or for a given particle size, the interparticle spacing will decrease with increased particle volume fraction. This will in turn increase the Orowan stress. That means, according to this contribution, for the Mg-based MMNC considered here, increased vol% of the SiC nanoparticles should lead to increased strength, which is not the case as the strengthening effect levels off when vol% of the SiC nanoparticles exceeds 10%.
The second contribution comes from the isotropic form of the strain gradient effect in the sense of Brown’s theory, and the stress increase is
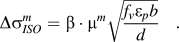 $$\Delta \sigma _{ISO}^m = \beta \cdot \mu ^m \sqrt {{{f_v \varepsilon _p b} \over d}} \quad.$$
In Eq. (7), β is a geometric factor of ∼0.4, and εp is the plastic strain in the matrix. Taking the plastic strain of the matrix to be 0.002 (0.2%), and using the parameters of Mg and experimental results of the 5 vol% SiC Mg-based MMNC of this work, we obtain a value of only ∼10 MPa for the Brown stress. It is observed from Eq. (7) that with a given particle size d, the Brown stress should increase with the volume fraction of the reinforcing particles, which is not the case for the Mg-based MMNCs considered here when the volume fraction is greater than ∼10 vol%. In other words, even if the Brown model is valid for small vol% of the nanoparticles, it fails at higher vol%.
The third contribution is also from the strain gradient but is due to the so called kinematic gradient contribution, which has the form
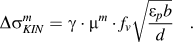 $$\Delta \sigma _{KIN}^m = \gamma \cdot \mu ^m \cdot f_v \sqrt {{{\varepsilon _p b} \over d}} \quad.$$
In Eq. (8), the numerical value of γ is ∼2.0. This equation produces a stress increment in the amount of ∼10 MPa. Therefore, the total contribution due to strain gradient effect adds up to ∼20 MPa. Similar to the Brown stress, for a given particle size, the kinematic gradient strengthening should increase linearly with the particle volume fraction, which is found to be inconsistent with ourReference Gupta and Sharon94 experimental results at relatively high vol% of the nanoparticles.
Finally, the fourth contribution to the strengthening effect is the statistically stored dislocations (SSD) due to, e.g., the thermal mismatch between the particle and the metal matrix, which has the following form (in the spirit of the Taylor formula)
 $$\Delta \sigma _{CTE}^m = \eta \cdot \mu ^m \cdot b\sqrt \rho \quad,$$
where η is a factor of unity, and ρ the dislocation density depending on the temperature drop, and difference of coefficients of thermal expansion (CTE) between the matrix and the ceramic phase, as well as the particle size and volume fraction, such that
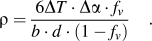 $$\rho = {{6\Delta T \cdot \Delta \alpha \cdot f_v } \over {b \cdot d \cdot (1 - f_v )}}\quad.$$
Based on Eq. (10), the density of SSD in the Mg-matrix due to thermal mismatch is 98.2 × 10¹³/m2, which when put into Eq. (9) yields a stress increase in the amount of ∼167 MPa (temperature drop ∼550 K; CTE of Mg ∼29.9 × 10⁻⁶/KReference Gupta and Sharon94; CTE of SiC ∼4.5 × 10⁻⁶/K). Again Eq. (10) shows that the SSD density increases with increasing particle volume density for a given particle size, which translates to increased strength from the Taylor Eq. (9). This again is inconsistent with our experimental results at relatively high vol% of the nanoparticles.
Usually, the quadratic sum of the above contribution is taken to calculate the total contribution to the strength from the various strengthening mechanisms.Reference Clyne and Withers76, Reference Nan and Clarke83 In this case, we have
 $$(\Delta \sigma _{Total}^m )^2 = \,(\Delta \sigma _{Or}^m + \Delta \sigma _{KIN}^m )^2 + (\Delta \sigma _{ISO}^m )^2 + (\Delta \sigma _{CTE}^m )^2 \quad.$$
Based on Eq. (11), the total strengthening effect can then be calculated to be of the order of ∼206 MPa. If this is combined with the base strength of the pure Mg, the total yield strength is calculated to be ∼386 MPa, which is in good agreement with the experimental results [Fig. 9(b)].
One more strengthening mechanism in MMCs has often been underrated and ignored by the research fraternity, which is the load sharing or load transfer from the soft matrix to the more rigid ceramic particles during mechanical loading. In what follows, we will apply the modified shear-lag model proposed by Nardone.Reference Nardone and Prewo95 Based on the load transfer from the matrix to the hard reinforcing phase during mechanical loading, Nardone and Prewo derived the following equation for the yield strength of the composite:
 $$\sigma _{cy} = \sigma _{my} \left[ {{\textstyle{1 \over 2}}\,\,\,f_v (s + 2) + f_m } \right]\quad.$$
In Eq. (12), σcy is the yield strength of the composite, σmy is the yield strength of the matrix, s is the aspect ratio (length to diameter ratio) for fiber reinforcements, and fm is the volume fraction of the matrix. Apparently, for the two phase structure such as in this work, fm + fv = 1.
Nardone et al. have shown that this shear-lag model could predict the yield strength of certain discontinuously reinforced aluminum (DRA) reasonably well, keeping in line with the experimental results. However, a clear guidance as to how to choose the yield strength of the matrix material is yet to be established. Basically, we are left with two choices. The first option is to use the yield strength of the unreinforced matrix material in its annealed state. With this choice, the calculated yield strength of the composite with 5 vol% SiC nanoparticles, according to the result of Fig. 9 of this work, is only ∼185 MPa, which is only merely half of the measured yield strength of the MMNC in question. The second option is to use the yield strength of the reinforced matrix, thus taking into account the in situ strengthening of the matrix phase.Reference Clyne and Withers76 We believe it is more reasonable to use the yield strength of the matrix in the presence of the reinforcing particles, as that is the actual yield stress during loading. We can use an indirect method to derive yield strength of the reinforced matrix. This is achieved by adding the strengthening effects from Orowan mechanism, Brown mechanism, and so on, as we have discussed previously using Eq. (11), to the yield strength of the unreinforced Mg (∼180 MPa from Fig. 9). This will lead to a yield strength value of ∼384 MPa for the matrix in the MMNC with 5 vol% SiC nanoparticles. Then the Nardone formula of (12) gives yield strength for the composite in the amount of 393.6 MPa. This value is in close agreement to the experimentally measured yield strength of the 5 vol% reinforced MMNC (Fig. 9).
If the above methods are used to all the volume fractions studied in this work, we have the results as shown in Table I. It shows that while Nardone’s modified shear-lag model provides the closest prediction of the yield strength of the SiC nanoparticle-reinforced Mg-based MMNC at 5 vol% of SiC; however, neither the Nardone model nor the dislocation plasticity theory can give good prediction at higher volume fractions of the SiC phase. What is more, both models fail to account for the inverse volume fraction effect when the vol% of SiC is greater than 10%.
Strengthening effect estimations (all stress terms in MPa).

(i) The interparticle spacing is based on the Han formula [Eq. (4) of this work].
(ii) The experimental results of the yield strengths of various MMNCs are from Fig. 9.
(iii) Yield strength of the unreinforced Mg is ∼180 MPa.
(iv)  $\sigma _y^{Cal} $ is the sum of
 $\Delta \sigma _{Tot}^m $and the yield strength of the unreinforced Mg (∼180 MPa).
Quadratic sum is used for  $\Delta \sigma _{Tot}^m $ [Eq. (11)].
We should point out that in the above discussion we have not considered the grain size refinement effect on the yield strength of the Mg-matrix. According to Choi et al.,Reference Choi, Kim, Shin and Bae29 and Hwang et al.,Reference Hwang, Nishimura and McCormick30 we can establish an inverse Hall-Petch relation for pure Mg for grain size smaller than 100 nm, as follows:
 $$\sigma _y = 437.0 - 1760 \cdot d^{ - 1/2} \quad.$$
In Eq. (14), the yield strength is in MPa, and the grain size (d) is in nm. For the Mg-based MMNC of this work, it is difficult to obtain an accurate evaluation of the grain size of the Mg matrix. As a reasonable approximation, we use the interparticle spacing (Table I) for the matrix grain size d. Then according to Eq. (13), as the interparticle spacing is reduced from 34 nm (10 vol% SiC) to 29 nm (15 vol% SiC), there is a drop of the order of ∼20 MPa in the yield strength, which may partially explain the strength decrease in the MMNCs with higher volume fraction of SiC nanoparticles. However, the exact underlying mechanism that causes this strength drop calls for further effort.
The next issue of interest is the rate dependence of the Mg-based MMCs. Even though a more detailed investigation is needed to provide a more accurate examination of the strain rate sensitivity (SRS) of the MMNCs of this work, via experiments such as strain rate jump test, stress relaxation or instrumented nanoindentation,Reference Wei91, Reference Wei and Kecskes96 we can still obtain approximate values of the SRS based on our quasistatic and dynamic mechanical testing results. Toward this, we use the popular definition of SRS as follows
 $$m = {{\partial \ln \sigma } \over {\partial \ln \dot \varepsilon }} = {{\Delta \ln \sigma } \over {\Delta \ln \dot \varepsilon }} = {{\ln \sigma _2 - \ln \sigma _1 } \over {\ln \dot \varepsilon _2 - \ln \dot \varepsilon _1 }}\quad.$$
From Eq. (14) and the experimental results (Fig. 9), the SRS values for all three MMNCs of this work are very close to 0.03. This is much smaller than the SRS values obtained for 100-nm grain size pure Mg (m ∼ 0.3) by Trojanova et al.Reference Trojanova, Lukac and Szaraz97 and the 45-nm grain size pure Mg (m ∼ 0.6) by Hwang et al.Reference Hwang, Nishimura and McCormick30 The large SRS values of nanocrystalline pure Mg obtained by Trojanova et al.Reference Trojanova, Lukac and Szaraz97 and Hwang et al.Reference Hwang, Nishimura and McCormick30 strongly suggest that grain boundary activities are prevalent in accommodating the plastic deformation in nanocrystalline Mg at room temperature. On the other hand, the small SRS obtained for our MMNCs indicates that the deformation behavior of MMNCs is quite different from pure nanocrystalline Mg, and some other mechanisms that play a key role in the deformation behavior of MMNCs are yet to be uncovered. The presence of the SiC nanoparticles may play an important role that leads to this difference.
We believe that the poor malleability of the MMNCs is primarily due to the clustering of the nanoparticles as well as the large particles in the MMNCs that have survived the processing.
In summary, further investigation is needed to clarify the unusual behavior of the MMNCs with large volume fraction of reinforcing hard particles as described in this work. Considering the very small interparticle spacing, and thus the very small nominal grain size of the matrix, atomistic simulation may be invoked for this purpose. We envision that this will become an interesting area of research, and many potential opportunities are yet to be explored.
V. SUMMARY AND CONCLUDING REMARKS
The effect of micro- and nanoreinforcements on the mechanical properties of Mg-based MMCs/MMNCs was investigated under quasistatic and dynamic loading rates and the underlying mechanisms were discussed in the present work. The following conclusions can be drawn based on the experimental results and the discussion of this study.
(i) Mechanical attrition of Mg and nanocrystalline SiC powders followed by subsolidus consolidation is an effective way to produce Mg-based MMNCs. The reinforcing ceramic nanoparticles (average particle size ∼14 nm) appear to be homogeneously dispersed within the matrix. Some large SiC particles have survived the synthesis processes. The average values of the interparticle spacing of all the MMNCs are smaller than 50 nm. Neither TEM nor SEM reveals significant porosity in the as-processed MMNCs.
(ii) All the MMNCs exhibit considerably increased strength as compared with the monolithic magnesium, indicating strong strengthening effect from the SiC nanoparticles. However, when the volume fraction of the SiC nanoparticles is greater than 10%, the strengthening effect levels off, and an inverse volume fraction effect emerges. No significant plastic deformation is observed in the MMNCs under either quasistatic or high-strain rate uniaxial compression.
(iii) A combination of dislocation plasticity models and the modified shear-lag model based on Nardone and Prewo provides quite close prediction of the yield strength of the MMNC with small SiC volume fraction. However, neither the dislocation-based models nor the modified shear-lag model can give close estimation of the yield strength of MMNC with larger SiC volume fractions. In particular, the existing models fail in predicting the inverse volume fraction effect at higher vol% levels. Further efforts are needed to uncover the underlying mechanisms responsible for such effect.
(iv) The estimated strain rate sensitivity of all the MMNCs of this work is around 0.03, which is much smaller than that of nanocrystalline Mg with100-nm and 45-nm grain sizes. This observation points to the strong effect of the SiC nanoparticles on the plastic deformation of the MMNCs. However, the detailed mechanisms of the effect are yet to be uncovered.
ACKNOWLEDGMENTS
J.H. Shen and J.L. Liu contribute equally to the technical contents presented in this article. J.H. Shen would like to thank the Chinese Ministry of Education for the support during his tenure at UNC-Charlotte, and for the support from China Scholarship Council. J.L. Liu appreciates the support from China Scholarship Council (Grant No. 2008629106). L.N. An thanks the National Science Foundation under Contract No. CMMI-0800086. Q. Wei wants to extend his gratitude to the financial support from U.S. ARL under Contract No. W911QX-08-0073, and to the support of the Chinese 111 Project (Contract No. B07050) through Northwestern Polytechnical University. Dr. Z.L. Pan assisted during the mechanical testing.