Introduction
Penguins are sensitive to changes in the Antarctic climate and environment (Baroni & Orombelli Reference Baroni and Orombelli1994, Wilson et al. Reference Wilson, Ainley, Nur, Jacobs, Barton, Ballard and Comiso2001), and thus from the palaeoecology of their population dynamics past climatic and environmental changes can be inferred (Sun et al. Reference Sun, Xie and Zhao2000, Sun & Xie Reference Sun and Xie2001). Historical information about Antarctic penguins remains quite limited, and most of the palaeoecological studies on penguins are based upon the distribution and age of abandoned colonies. By radiocarbon dating of the ancient remains from these abandoned penguin colonies, and geochemical analyses on penguin ornithogenic soils, some historical records of penguin occupation in the Antarctic Peninsula, Ross Sea area, Windmill Islands and Vestfold Hills have been reconstructed (Baroni & Orombelli Reference Baroni and Orombelli1994, Emslie Reference Emslie2001, Sun et al. Reference Sun, Zhu, Yin, Liu, Xie and Wang2004b, Emslie & Woehler Reference Emslie and Woehler2005, Emslie et al. Reference Emslie, Coats and Licht2007, Huang et al. Reference Huang, Sun, Wang and Zhu2009). Similarly, Hodgson & Johnston (Reference Hodgson and Johnston1997) and Sun et al. (Reference Sun, Xie and Zhao2000) have utilized well-preserved animal remains, such as hairs and droppings in lake sediments, to infer historical population dynamics of seals and penguins and examined the responses of ecosystems to climatic changes and human activities.
Most of the published studies on penguin palaeoecology are from the Antarctic Peninsula regions and Ross Sea, and have identified a late Holocene ‘penguin optimum’ (Ingólfsson Reference Ingólfsson2004). The palaeoecological information on penguins in East Antarctica, however, is scarce. We reported in a previous study the onset of Holocene Adélie penguin occupation in the Vestfold Hills by radiocarbon dating penguin remains in a penguin ornithogenic sediment core DG4 (Huang et al. Reference Huang, Sun, Wang and Zhu2009). In this study, we perform geochemical and geochronological analyses on DG4, extract the bio-element assemblage, reconstruct a Holocene record of the penguin population dynamics at Gardner Island, and examine the relationship between the penguin population dynamics and climatic and environmental changes in this region.
Methods
Study site and sample collection
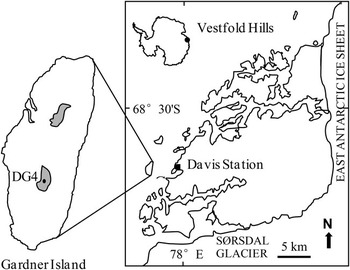
Gardner Island is about 2 km long, 1 km wide, and is located 4 km west of Davis Station (Fig. 1). The island is flat with a maximum altitude of 49 m above sea level and large numbers of breeding Adélie penguins. The sediment core DG4 was retrieved from a dry lake catchment at an altitude of 32 m. The catchment is about 80 m long and 20 m wide, and is covered by white salt efflorescence, probably due to the recently increased evaporation and sublimation in East Antarctica (Hodgson et al. Reference Hodgson, Roberts, McMinn, Verleyen, Terry, Corbett and Vyverman2006). A 12 cm diameter PVC pipe was pushed vertically into the centre of the lake catchment to collect a sediment core. After the PVC pipe was retrieved, its bottom and top were hermetically sealed. Samples of bedrock and fresh penguin guano were also collected from the island. In the laboratory, the core was opened, photographed, described, and then sectioned at 1 cm intervals. The 83 subsamples as well as penguin guano and bedrock samples were stored frozen prior to analysis. Before chemical analyses, each subsample was air-dried in a clean laboratory and homogenized.
Map of the Vestfold Hills including the sampling site on Gardner Island (GI).

Geochronology and elemental analysis
To calculate the age profile of the sediment, we performed radiometric dating (210Pb, 137Cs) and AMS14C dating of macrofossils. For the top 10 cm sediments, 210Pb and 137Cs dating was performed at 1 cm intervals by direct gamma spectrometry using an Ortec HPGe GWL series detector. Detailed information about the AMS14C dating on the core has previously been described by Huang et al. (Reference Huang, Sun, Wang and Zhu2009). In addition, we performed AMS14C dating on two bulk sediment samples at -3 cm (3 cm below surface of the core) and -36 cm in the core.
The 83 subsamples from DG4, together with the fresh penguin guano and local bedrock reference samples were analysed for elemental concentrations, total carbon (TC), total nitrogen (TN), total organic carbon (TOC), total phosphorus (TP) and total sulphur (TS). In addition, the 83 subsamples were analysed for their grain size distributions. For chemical element analyses, subsamples were sieved though a 70 μ mesh, and then ground to powder after removal of large rock pieces. About 0.25 g of each powder sample was taken, precisely weighed, and digested by multi-acids (e.g. HNO3-HF-HCLO4 for K, Na, Ca, Mg, Fe, Mn, Pb, Ni, Cu, Zn, Sr, Ba, Ti, Al and P; HNO3-HCLO4-HCL for As and Se) in a Teflon crucible with electric heating. The digested samples were analysed by AAS novAA400 for K, Na, Ca, Mg, Fe, Mn, Pb, Ni, Cu and Zn; by ICP-OES DV2100 for Sr, Ba, Ti and Al; by UV-VIS 8500 for TP and by atomic fluorescence spectrophotometry AFS-930 for As and Se. F was determined by fluoride ion selective electrode (ISE). The standard sediment reference materials were included with every batch of samples. The analytical values for major elements and trace elements are within ± 0.5% and ± 5% of the certified ones, respectively. Total sulphur was analysed by H2O2 volume method after combustion in SRJK-2 high temperature furnace as described in Sun et al. (Reference Sun, Zhu, Yin, Liu, Xie and Wang2004b). The chemical volumetric method was used to measure TOC content with a duplicate error of 0.05%. TC and TN were measured by Vario EL III with a relative error of 0.1%. For grain size distribution analysis, all the subsamples were first sieved through a 2000 μ sieve and then approximately 0.5 g was taken for analysis at the Institute of Geography and Limnology, Chinese Academy of Science (CAS), using a SALD-3001 laser particle analyser with an error of 3%.
In order to examine the relationship between element levels in the sediments and their controlling factors, we performed a series of statistical calculations on these data. Pearson correlation coefficient, R-clustering analysis, and Q-mode factor analysis (QFA) were performed using SPSS11.5.
Results and discussion
Lithology and sedimentology
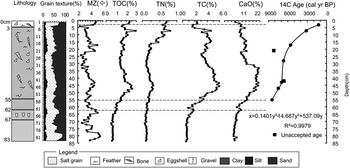
The lithology of DG4 is plotted in Fig. 2. From macroscopic description, colour, smell and sedimentology, three major sedimentary units were identified in DG4. Unit 1 is from the base to -63 cm, and was characterized by a dominance of greyish deposits; from -67 cm to -63 cm there were some rounded granules and pebbles. Unit 2 spans from -62 cm to -4 cm and consists of olive to dark olive grey sediments. Units 3, the top 3 cm of sediment, is dominated by white salt efflorescence and sporadic guano. The layers from -55 cm to the surface contained many penguin remains, and had a strong and unpleasant smell of penguin guano identified here as a penguin ornithogenic sediment layer. Penguin remains such as bone, feather or eggshell are present in every layer of this ornithogenic sediment except -3 cm, -7 cm, -18 cm, -38 cm and -48 cm, indicating a continuous penguin occupation in this area. In this study, we focus on this penguin ornithogenic sediment layer.
Lithology, down-core profiles of grain-size composition, mean grain size (MZ), TOC, TN, TC and CaO in the sediment core DG4 and the polynomial age depth curve.

Down-core profiles of grain size, TOC, TN, TC and CaO in DG4 are plotted in Fig. 2. The contents of TC, TN, TOC and CaO were extremely low in unit 1, but substantially higher in units 2 & 3. TOC and TN had similar profiles, with high levels at -49∼ -43 cm and -7 cm, indicating enhanced inputs of organic materials into the sediments. TC and CaO had a significant correlation (r = 0.900, n = 83, P < 0.001), suggesting a common origin. The XRD analysis on the sediments (results not shown) showed that CaO was derived mainly from carbonate minerals. The high levels of TC and CaO at -49∼-30 cm suggest a high deposition rate of carbonate in this layer.
Geochronology
For radiometric dating (210Pb, 137Cs), only the upper two samples showed a radioactive signal (data not shown), and the signal was too weak for age determination. This may have been due to the very low sedimentation rates in the surface sediments, and the exact reasons remain unclear. The results of the radiometric dating indicate that the upper two sediments are modern and there is no denudation of the surface sediments. To be conservative, in this study only 14C dates were used to establish the chronology of the ornithogenic sediment layer between -55 cm and -3 cm of the sediment core DG4.
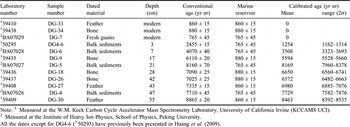
In a previous report (Huang et al. Reference Huang, Sun, Wang and Zhu2009), we presented eight radiocarbon dates for penguin remains from the DG4 core. In this study, we performed two additional AMS 14C dating on the samples at -3 and -36 cm, but the dating of the sample at -36 cm failed due to insufficient carbon content. The conventional dates were corrected and calibrated as described in Huang et al. (Reference Huang, Sun, Wang and Zhu2009). The corrected and calibrated dates are listed in Table I. The sample at -55 cm has the maximum value of 8463 calibrated year before present (cal. yr bp), and the sample at -3 cm has the value of 1254 cal. yr bp. A polynomial curve was used to extrapolate and interpolate the age versus depth curves of the ornithogenic sediments between -55 cm and -3 cm (Fig. 2).
AMS14C dates and calibrated ages using the Marine04 and SHCal04 datasets in CALIB 5.1.0.

Note: 1 Measured at the W.M. Keck Carbon Cycle Accelerator Mass Spectrometry Laboratory, University of California Irvine (KCCAMS UCI).
2 Measured at the Institute of Heavy Ion Physics, School of Physics, Peking University.
All the dates except for DG4-6 (150295) have previously been presented in Huang et al. (Reference Huang, Sun, Wang and Zhu2009).
Characteristics of the elemental concentration profiles in DG4
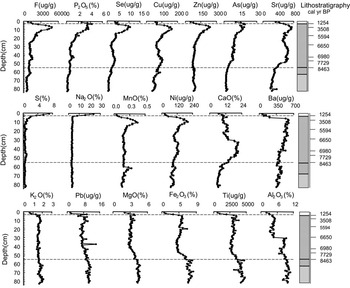
The concentration versus depth profiles of typical elements/oxides in the sediment core DG4 are plotted in Fig. 3, and show substantial fluctuations. Calcium oxide (CaO) had the highest mean concentration of 12.5% and it reached its highest levels between -49 and -30 cm. TS and Na2O had very similar profiles, with abnormally high concentrations in the upper 3 cm due to the dominance of salt grains composed of sulphate and sodium. Other elements/oxides in the top 3 cm sediments have a trend opposite to those of TS and Na2O, probably due to the dilution of the latter whose absolutely high concentrations will decrease the relative abundance of other elements/oxides in sediments. Fe2O3, MgO, Pb, Ti, K2O and Al2O3 are petrogenic elements/oxides, they have similar profiles, and their concentrations below -55 cm are higher than those above except for Al2O3. The heavy metals Mn and Ni had similar profiles, and they reached their highest levels at -10 cm. In addition, Ba showed a different variation pattern from other elements/oxides, probably due to its inherent geochemical properties.
Concentration vs depth profiles of elements/oxides in the sediment core DG4.

F, P, Se, As, Sr, Cu and Zn in DG4 (Fig. 3) had very similar stratigraphical patterns, their levels being much higher in the sediment above -55 cm than in those below, and reaching a maximum around -7 cm. The different geochemical properties but very similar profiles of these elements indicate that they are likely to have a common source. From studies of ornithogenic sediments from Adélie Island, Antarctic Peninsula, Sun et al. (Reference Sun, Xie and Zhao2000) and Xie & Sun (Reference Xie and Sun2008) have proposed that these elements can be used as biomarkers of penguin populations. Thus we suggest that the vertical variations of these elemental concentrations are caused by the changes in the amount of guano where the amount of dropping is directly linked to penguin numbers.
Identification of the bio-element assemblage in G4
The factors influencing elemental concentrations of lake sediments are complex, the geological explanations for behaviour of a single element are usually complicated, but an assemblage of elements can be distinct and used to infer their material source in specific studies (Sun & Xie Reference Sun and Xie2001, Liu et al. Reference Liu, Zhao, Sun, Luo, Yin, Xie, Wang, Liu, Wu, Ding and Fu2006). In order to compare the vertical concentration profiles of elements/oxides in DG4 and to obtain an assemblage of bio-elements from the ornithogenic sediments, we performed Pearson correlation and R-clustering analyses.
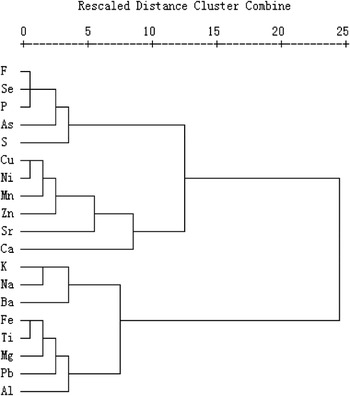
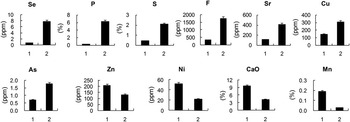
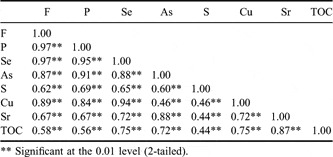
The R-clustering results for the elemental concentrations in the ornithogenic sediment layer (-55 cm∼-0 cm) of DG4 show that F, Se, P, As, S, Cu, Ni, Mn, Zn, Sr and Ca belong to the first group, and K, Na, Ba, Fe, Ti, Mg, Pb and Al the second (Fig. 4). We compared the concentrations of the first group elements with those of local penguin guano and bedrock. As shown in Fig. 5, the concentrations of F, P, Se, As, S, Cu and Sr in local penguin guano are much higher than those in local bedrock; Zn, Ni, Mn and Ca have an opposite geochemical character, indicating that guano is not their primary source. Thus the elements F, P, Se, As, S, Cu and Sr were identified as the bio-element assemblage of the ornithogenic sediment section of DG4. S has a different concentration vs depth profile from the other six bio-elements. In the upper sediments, S has an abnormally high concentration, apparently more from the dominant sulphates than from penguin guanos. Pearson correlation analyses on the concentrations of these bio-elements were performed to corroborate the clustering results. The correlation coefficients of the seven bio-elements are listed in Table II and show significant correlations. The results from both clustering and correlation analyses indicate that the common origin of these bio-elements is penguin guano (Fig. 5). Therefore our interpretation is that the ‘bio-element assemblage’ can be used as a geochemical marker of the penguin ornithogenic sediment in this region, and the vertical concentration/flux profiles of the assemblage can be used to estimate the abundance of penguin droppings in DG4 and to infer changes in the historical penguin populations.
R-mode clustering results for the elements in the sediment core DG4 from Gardner Island, Vestfold Hills.

Concentrations of Se, P, S, F, Sr, Cu, As, Zn, Ni, CaO and Mn in bedrock (1) and guano (2) from Gardner Island.

Correlations between the bio-elements and TOC concentrations in the DG4 sediment core.

** Significant at the 0.01 level (2-tailed).
Reconstruction of the penguin population at Gardner Island for the past 8500 years
The elemental concentration data in bulk sediments alone may not reflect true variations in their geochemical composition if the sedimentation rates very widely. For example, two East Antarctic lake sediment cores, one from Anderson Lake in the Vestfold Hills and one from Heart Lake in the Larsemann Hills showed abnormally higher sedimentation rates between c. 7000–6000 yr bp due to the higher productivity in a marine environment (Roberts & McMinn Reference Roberts and McMinn1998, Verleyen et al. Reference Verleyen, Hodgson, Sabbe and Vyverman2004). The sediment core DG4, section -43∼-28 cm (6980–6650 cal. yr bp) also has a much higher sedimentation rate than other sections of the ornithogenic sediment layer (Fig. 6). This section has a large amount of sand but very little clay (Fig. 2); unlike the petrogenic elements Ca and Al of higher levels, TOC and TN show no enrichment in this section. Apparently, the high sedimentation rate of this section is caused by increased overland runoff instead of high lake productivity. The sedimentation rates of other sections in the ornithogenic sediment layer are very low and show little fluctuation (Fig. 6), indicating a relatively stable runoff.
Profiles of the bio-element fluxes and the sedimentation rates in the sediment core DG4.

Abnormally high sedimentation rates could dilute the element concentration data. In order to reduce and eliminate this dilution effect, we converted the elemental concentrations to fluxes according to the method of Roos-Barraclough et al. (Reference Roos-Barraclough, Martinez-Cortizas, Garcia-Rodeja and Shotyk2002) and plotted the bio-element fluxes against depth in Fig. 6. As seen from Fig. 6, the bio-element fluxes have notably higher levels in the section of -43 cm ∼ -28 cm. The high fluxes are, apparently, a result of high sedimentation rates, which can be explained by the geochemical impact of climate change. The climate of this period was warm and wet (Roberts & McMinn Reference Roberts and McMinn1998), increasing overland runoff and inwash into the lake catchment (Liu et al. Reference Liu, Sun, Xie, Yin, Zhu and Wang2007), and more penguin droppings would therefore be washed into the centre of the catchment. The relative proportion of penguin droppings in the overland runoff in this section, however, is expected to be relatively stable compared with that in other sections. First, the bio-elements show no enrichment compared with other elements in this section (Fig. 3). Second, the high level of bio-element fluxes in the high sedimentation rate section was probably caused by increased overland runoff following climatic changes, not by increased input of penguin droppings from increasing penguin populations in this area. Thus the fluctuations of bio-element fluxes in the ornithogenic sediments of DG4 are caused by variations in both the penguin population dynamics and overland runoff.
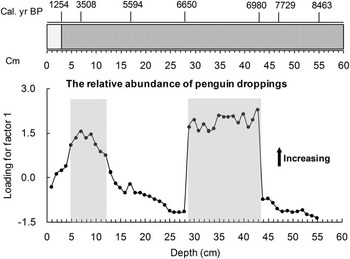
Although the effects of grain size and mobilization on the flux profiles of bio-elements in DG4 did not seem to be significant, we performed QFA on the flux profiles of bio-elements to further reduce or eliminate these potential effects and determine the main controlling factors. The QFA results (Fig. 7) show that above 95% of the variance in the data could be explained by two factors. Factor 1 is very close to the flux profiles of the bio-elements in DG4 (Fig. 6), it represents the relative abundance of penguin droppings in the sediments. Factor 2 (not shown) is different from Factor 1, and it may represent geochemical contributions from other media such as bedrock.
Relative abundance of penguin droppings in the sediment core DG4 as reconstructed by Q factor analysis on the flux profiles of bio-elements in the core.

The composition of typical bio-elements and biomarkers in lake sediments from seabird guano, sedimentary stable isotopes, algae associated with salmon-derived nutrients, and seal hairs have all been successfully used as indicators to indirectly infer past vertebrate population dynamics (Hodgson & Johnston Reference Hodgson and Johnston1997, Sun et al. Reference Sun, Xie and Zhao2000, Reference Sun, Zhu, Liu, Xie, Yin, Zhao and Wang2005, Gregory-Eaves et al. Reference Gregory-Eaves, Smol, Douglas and Finney2003, Wang et al. Reference Wang, Wang, Wang and Sun2007). The profile of Factor 1 in Fig. 7 has two peaks. As discussed above, the peak in the section -43∼-28 cm (6980–6650 cal. yr bp) was mainly due to the increased overland runoff. The other peak in the layer of -12∼-5 cm (4700–2400 cal. yr bp) has a low sedimentation rate and thus low overland runoff, and the high level of flux in this layer probably therefore reflects larger penguin populations.
As seen in Fig. 7, penguins started occupying Gardner Island as early as 8500 cal. yr bp, their population reached the maximum density around 3500 cal. yr bp and maintained the higher density between 4700–2400 cal. yr bp, with a decreasing trend after that. The penguin population dynamics between 6980–6650 cal. yr bp is not clear and will be not discussed.
Penguin population fluctuations in response to local climatic and environmental changes
Penguins occupied land right after deglaciation and the formation of ice free areas in Antarctica (Emslie & Woehler Reference Emslie and Woehler2005 and references therein), and their populations have been found to grow under optimum climatic conditions (Baroni & Orombelli Reference Baroni and Orombelli1994, Sun et al. Reference Sun, Xie and Zhao2000, Emslie & McDaniel Reference Emslie and McDaniel2002). In this study penguins occupied Gardner Island at 8500 cal. yr bp, consistent with a previous report that penguins occupied the Windmill Islands, East Antarctica as early as 9000 yr bp (Emslie & Woehler Reference Emslie and Woehler2005). Here, the penguin populations grew slowly and remained at a low level in the period 8500∼6980 cal. yr bp. After an episode of abnormally rapid sedimentation due to the increasing overland runoff in this area between 6980–6650 cal. yr bp, the penguin population experienced a swift increase reaching a maximum density around 3500 cal. yr bp. Between 4700–2400 cal. yr bp, the warm period in this area (Ingólfsson Reference Ingólfsson2004 and references therein), the penguin population maintained a high level. After 2400 cal. yr bp, the penguin population shows an obvious decreasing trend, following the Chelnok glaciation and neoglaciation in Vestfold Hills (Ingólfsson Reference Ingólfsson2004 and references therein). Overall, the penguin population dynamics at Gardner Island are consistent with local climatic and environmental changes, indicating that penguins here are sensitive to Antarctic climatic and environmental changes.
Such associations can be explained by the ecosystem impact of climate changes in sea ice extent and terrestrial snow accumulation on penguins’ nesting and foraging behaviour. During warm climate periods, the island’s rock would be adequately exposed and thus provide sites for penguins to nest and breed. More importantly, during warm climatic periods, the probably increase in abundance of marine prey can provide the food source required to support a rapid growth of penguin populations. During climatic deterioration, the Gardner Island could be covered with more snow and ice, making it harder for penguins to nest and breed and thus leading to a reduction in size of breeding penguin populations.
A late Holocene ‘climatic/penguin optimum’ in the circum-Antarctic regions
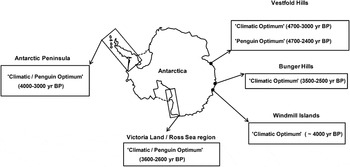
As summarized in Fig. 8, the late Holocene ‘climatic/penguin optimum’ is a broadly agreed and synchronous environmental period in the Antarctic Peninsula (4000–3000 yr bp), Bunger Hills (3500–2500 yr bp), Windmill Islands (∼4000 yr bp) and Victoria Land/Ross Sea region (3600–2600 yr bp) (Kirkup et al. Reference Kirkup, Melles and Gore2002, Ingólfsson Reference Ingólfsson2004, Hodgson et al. Reference Hodgson, Doran, Roberts and McMinn2004). For Vestfold Hills, the mid–late Holocene climate is controversial (Ingólfsson Reference Ingólfsson2004). Domack et al. (Reference Domack, Jull and Nakao1991) discovered evidence for a middle Holocene re-advance of floating ice tongues between 7300 and 3800 yr bp. Adamson & Pickard (Reference Adamson and Pickard1986) suggested a mid-Holocene glacial advance in the form of moraine ridges in Vestfold Hills but without dated evidence. On the basis of marine fossil assemblages and geomorphological criteria, Zhang (Reference Zhang1992) proposed a climatic optimum in Vestfold Hills between 6200–3700 yr bp. Björck et al. (Reference Björck, Håkansson, Olsson, Ellis-Evans, Humlum and Lirio1996) reported a late Holocene climate optimum (4700–3000 yr bp) in Vestfold Hills by re-interpreting the lake sediment evidence of Pickard et al. (Reference Pickard, Adamson and Heath1986). Roberts & McMinn (Reference Roberts and McMinn1996, Reference Roberts and McMinn1999) reported warmer and wetter conditions in the time interval 4200–2200 yr bp by transfer functions applied to the fossil diatom assemblages in lake sediments. Using marine sediment cores from this area, McMinn et al. (Reference McMinn, Hejnis, Harle and McOrist2001) also identified a mid–late Holocene warm period (>3600–2500 yr bp) and a significant cooling and increase in sea ice cover after 2500 yr bp. According to our study (Fig. 7), the penguin population maintained a stable and high level between 4700 and 2400 cal. yr bp, indicating mild climatic conditions in the area. This is consistent with the late Holocene climatic optimum in Vestfold Hills proposed by Björck et al. (Reference Björck, Håkansson, Olsson, Ellis-Evans, Humlum and Lirio1996). We therefore suggest that a late Holocene ‘penguin optimum’ occurred in the Vestfold Hills, similar to those in the Antarctic Peninsula and Ross Sea regions. As shown in Fig. 8, there is a late Holocene ‘climatic and penguin optimum’ in the circum-Antarctic regions although the present study areas are restricted to the Antarctic Peninsula, Ross Sea regions and some coastal areas in East Antarctica. More studies from other areas in Antarctic, however, are necessary to corroborate the late Holocene and circum-Antarctic ‘climatic/penguin optimum’.
Late Holocene ‘climatic/penguin optimum’ in the circum-Antarctic. Data were compiled from: Antarctic Peninsula (Ingólfsson Reference Ingólfsson2004, Hodgson et al. Reference Hodgson, Doran, Roberts and McMinn2004 and references therein); Victoria Land/Ross Sea area and Bunger Hills (Ingólfsson Reference Ingólfsson2004 and references therein); Windmill Islands (Kirkup et al. Reference Kirkup, Melles and Gore2002); and Vestfold Hills (Ingólfsson Reference Ingólfsson2004 and references therein, this study).

This preliminary study of penguin ornithogenic sediments from Gardner Island provides a better understanding of the past penguin population dynamics in the Vestfold Hills. Our conclusion that there is a late Holocene ‘penguin optimum’ in Vestfold Hills is, however, only based on a single sediment core from Gardner Island. More detailed investigations of other sites should be conducted to further document this optimum, especially in comparison with other islands in Vestfold Hills where similar archives may exist. The circum-Antarctic late Holocene ‘climatic/penguin optimum’ proposal here is preliminary, and more related studies from other Antarctic areas are needed to verify this conclusion.
Acknowledgements
We thank the Chinese Arctic and Antarctic Administration, Polar Research Institute of China, Australian Antarctic Division, the CHINARE22 team in Zhong Shan Station and the members of Davis Station for their support and assistance in field. We especially thank the reviewers for their valuable comments and careful corrections on this manuscript and its earlier version. This study was funded by the National Natural Science Foundation of China (No.40730107), the National Science and Technology Supporting Program (2006BAB18B07), the IPY 2007–2008 China Programme (IPY2008-P05040015-05) and the Australia Antarctic Division Science Project (AAD2873).