I. INTRODUCTION
Semiconductor nano/micromaterials have aroused widespread attention owing to their superior properties,Reference Uzar, Okur and Arikan1 and enormous potentials for improved performance and extended capabilities in the industrial fields,Reference Fang, Zhai, Gautam, Li, Wu, Bando and Golberg2 such as sensing gases and humidity,Reference Okur, Uzar, Tekguzel, Erol and Arikan3 sensitizers,Reference Ivan and Juan4 laser devices,Reference Daniele, Fabio, Giorgio, Chiara and Leonardo5,Reference Barrelet, Wu, Bell and Lieber6 photocatalysts,Reference Chen and Hsu7 luminescent materials.Reference Murugadoss8 Among these semiconductor materials, ZnS and CdS are important ones, which are regarded as the direct band gap semiconductors with band gap energies of 3.6 and 2.42 eV, respectively.Reference Han, Qiang, Wang, Zhu, Lu and Wang9,Reference Alireza and Zohreh10 However, continuous research shows that semiconductor nano/micromaterials are not confined to single components, but extended to composite structures, where a noticeable enhancement in respect of properties can be obtained.Reference Marc11,Reference Anuga, Subhendu and Subhadra12 Therefore, the potential for studying composites with enhanced properties shows promising research prospects.
Several authors have reported that ZnS nano/micromaterials exhibited high efficienciesReference Li, Hu, Liu, Xu, Wan and Wang13–Reference Li, He and Cao15 when they were used as photodegradation catalysts. Considering that the composite structures created a possibility—think of the composites as different materials, properties, and functionalities rolled into one,Reference Zhang, Tang, Weng and Ouyang16 it is expected that a higher photocatalytic activity can be obtained. Recently, considerable efforts have been devoted to the preparation and design of the semiconductor composites for their superior performances. So, increasingly great progress has been made in the preparation of CdS/ZnS. Mani et al.Reference Mani, Chettiannan, Devarajan, Kanchan and Rajdip17 reported that CdS–ZnS core–shell nanoparticles could be synthesized by means of the microemulsion route and their size could be controlled by changing the microemulsion drop size. Deshpande et al.Reference Deshpande, Shah, Gholap and Gupta18 synthesized polymer-supported CdS·ZnS nanocomposites, which exhibit better visible-light-mediated photoactivity for splitting of water, as compared to corresponding pure CdS or ZnS containing coupons. Kim et al.Reference Kim, Kang and Jang19 prepared CdS/ZnS core–shell nanorods, stabilized them by mercaptopropionic acid in water and discovered improved optical properties as compared to bare CdS nanorods. Herein, it is necessary to further explore the new preparation method of semiconductor nano/micromaterials and study their extended performances.
In this paper, CdS/ZnS spherical composites were synthesized successfully by combining a hydrothermal route with a homogeneous precipitation process. And CdS nanoparticles were found to be assembled on the surfaces of the cubic ZnS microspheres. Furthermore, the emission peak of the as-obtained ZnS/CdS composites not only exhibited an obvious blue shift and an enhancement in its fluorescent intensity compared to the pure ZnS microspheres but also showed an excellent photocatalytic degradation activity for MO under UV irradiation, which may be applied in wastewater treatment.
II. EXPERIMENTAL SECTION
All the chemical reagents were of pure analytical grade and used without further purification.
A. Synthesis of ZnS microspheres
In a typical experimental procedure, an appropriate amount of Zn(CH3COO)2·2H2O (0.219 g, 1 mmol) was dissolved thoroughly in 15 mL deionized water under stirring, which was transferred into a Teflon-lined autoclave of 20 mL capacity. Then, acetic acid (0.45 mL) and thiourea (1.5 mmol) were added. After the mixture became colorless and transparent, the autoclave was sealed and maintained at 170 °C for 8 h. Then, it was cooled down to room temperature naturally. The resulting white precipitate was filtered and washed with distilled water and absolute ethanol. Finally, the as-prepared products were dried in a vacuum at 60 °C for 6 h and collected for characterization and used in the next step.
B. Preparation of ZnS/CdS composites
Cd(NO3)2·4H2O (0.25 mmol) and the as-prepared ZnS microspheres (0.5 mmol) were ultrasonically dispersed in 50 mL aqueous solution to form a suspension. Subsequently, thioacetamide (0.5 mmol) was added, and then the mixture was further ultrasonically dispersed for 15 min. Then, the resulting mixture was transferred into a flask with a reflex device. The flask was heated up using an 80 °C water bath and kept for 1 h under vigorous stirring. A bright yellow precipitate was obtained when the flask was cooled down to room temperature and further stirred for 12 h at room temperature. The resulting bright yellow precipitation was filtered, washed, and dried in a vacuum at 60 °C for 6 h and collected for characterization.
C. Photocatalytic activity measurements
The photocatalytic degradation experiments of methyl orange (MO) were measured at room temperature under the irradiation of 40 W UV light at different times. 50 mg of the photocatalysts [the as-prepared ZnS, CdS, ZnS/CdS, and the commercial anatase TiO2 (P-25)] were respectively ultrasonically dispersed in 50 mL of solutions with a concentration of 1.0 × 10⁻⁵ mol/L of MO aqueous solutions. The mixtures were irradiated by 40 W UV light for given durations after they had been stirred in the dark for 20 min to achieve adsorption–desorption equilibrium. The optical property changes of dyes were recorded on a Hach DR5000 ultraviolet-visible (UV-vis) absorption spectrophotometer (Loveland, CO) with wave length ranging from 190 to 1100 nm.
D. Characterization
X-ray diffraction (XRD) patterns of the as-prepared products were recorded using a Japan Rigalcu D/Max-3c x-ray diffractometer (Tokyo, Japan) with a Cu Kα radiation (λ = 1.5418 Å). Field-emission scanning electron microscopy (FE-SEM) images were collected using a Japan Hitachi S-4800 FE-SEM (Ibaraki prefecture, Japan) equipped with an energy dispersive x-ray spectrometer to characterize the morphologies of the products and composition. The optical properties were measured at room temperature using a Hach DR5000 UV-vis spectrophotometer. The room temperature-photoluminescence (RT-PL) measurements were performed on a Fluoromax-4P fluorescent spectrophotometer (Paris, France).
III. RESULTS AND DISCUSSION
A. Structural and compositional analysis
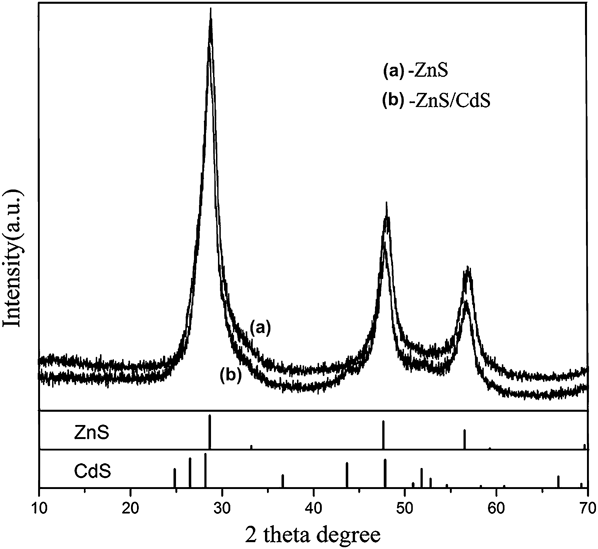
The structure and composition of the as-prepared samples were first detected by x-ray diffraction (XRD). Figure 1(a) exhibits the typical XRD pattern of the as-obtained ZnS microspheres. All of the diffraction peaks can be indexed as the pure face-centered cubic ZnS phase with the lattice constant of a = 5.400 Å, which is nearly consistent with the literature data (JCPDS No. 65-0309). The sharp and strong diffraction peaks confirm the well crystallization of the products. No other obvious diffraction peaks from other phases or impurities are detected. CdS nanoparticles were found to assemble on the surface of ZnS microspheres, and the XRD pattern of ZnS/CdS composites hence obtained is shown in Fig. 1(b). From Fig. 1(b), it can be seen that the XRD pattern of the as-prepared ZnS/CdS composites is similar to that of ZnS microspheres, but compared to Fig. 1(a), the diffraction peaks move toward the left and the intensity of the diffraction peaks decreases for the weaker CdS crystallinity, which indicates the formation of the ZnS/CdS composites.
The typical XRD patterns of (a) ZnS microspheres and (b) ZnS/CdS composites.

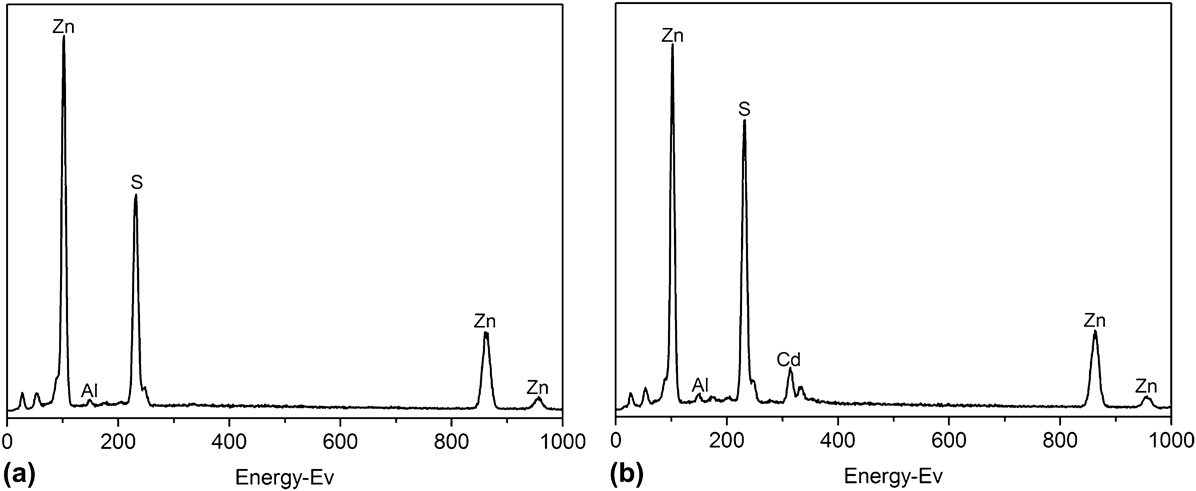
To further confirm the elemental constitution of the as-prepared ZnS and ZnS/CdS microspheres, the EDX measurements were carried out, which is shown in Fig. 2. From Figs. 2(a) and 2(b), we know that the two as-prepared samples are composed of Zn and S, and Zn, Cd, and S, respectively, showing that the as-prepared ZnS and ZnS/CdS microspheres are of high purity, which proves the results obtained by XRD measurements. In addition, in Fig. 2, there are other peaks besides Zn, Cd, and S elements. Two small peaks in the front come from carbon and oxygen of the conducting resin. And the existence of the weak aluminum peak can also be traced to the utilization of sample stage which contains aluminum element.
EDX spectra of the as-prepared products (a) ZnS microspheres and (b) ZnS/CdS composites.
B. Morphology and size analysis
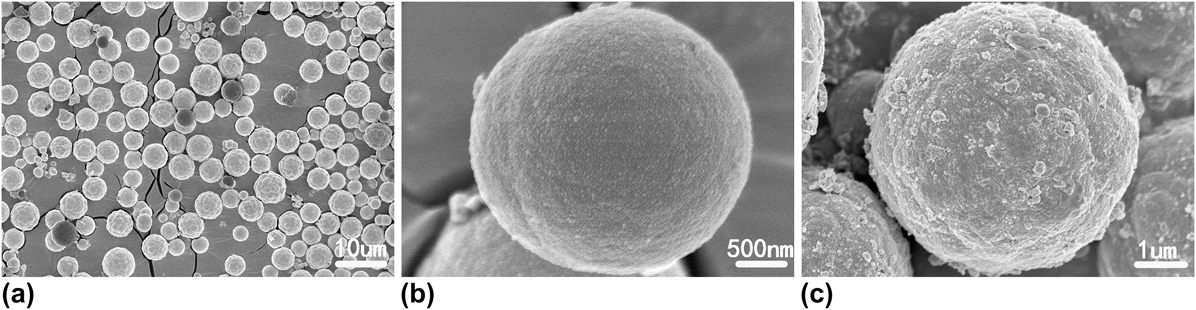
The morphology and size of the as-obtained products were investigated by SEM (as shown in Fig. 3). Figures 3(a) and 3(b) show the different magnification SEM images of as-prepared ZnS microspheres. In Fig. 3(a), a low-magnification SEM image of ZnS is observed, which reveals that the as-obtained ZnS products are composed of a large quantity of spherical structure with good uniformity, and their average diameter is about 3 µm. Figure 3(b) presents a high-magnification SEM image of one representative ZnS microsphere. From Fig. 3(b), it can be seen that the surface of the as-prepared ZnS microspheres is comparatively smooth, but some smaller nanoparticles attached to the surface of the microspheres could be seen, indicating that the ZnS microspheres are aggregated by these small nanoparticles. As a comparison, the SEM image of the as-obtained ZnS/CdS composites is shown in Fig. 3(c). It is found that the composites still comprise lots of spherical structures, but after CdS particles are coated on the surface of ZnS spheres, their surface becomes rough and some obvious bigger CdS nanoparticles could be observed, which further provide the evidence for the formation of the ZnS/CdS composites.
The typical SEM images of (a, b) ZnS microspheres and (c) ZnS/CdS composites.
In our experiments, it is obvious that S2− can be released into the solution easily [as shown in Eqs. (1) and (2)] and then it would react with the released Zn2+ when heated so as to produce ZnS nanoparticles [as shown in Eq. (3)]. Driven by the minimization of interfacial energy, ZnS microspheres were obtained undoubtedly. Next, on the basis of the as-obtained ZnS microspheres, CdS nanoparticles [could be obtained through Eqs. (4) and (5)] were further assembled on the surface of ZnS microspheres. The whole reaction process can be expressed as follows:
 $$\left( {{\rm{NH}}_{\rm{2}} } \right)_{\rm{2}} {\rm{CS}} + {\rm{2H}}_{\rm{2}} {\rm{O}} \to {\rm{2NH}}_{\rm{3}} + {\rm{H}}_{\rm{2}} {\rm{S}} + {\rm{CO}}_{\rm{2}} \quad ,$$
 $${\rm{H}}_2 {\rm{S}} \to {\rm{S}}^{{\rm{2}} - } + 2{\rm{H}}^ + \quad ,$$
 $${\rm{Zn}}^{{\rm{2}} + } + {\rm{S}}^{{\rm{2}} - } \to {\rm{ZnS}}\quad {\rm{,}}$$
 $${\rm{CH}}_3 {\rm{CSNH}}_{\rm{2}} + {\rm{H}}_2 {\rm{O}} \to {\rm{CH}}_{\rm{3}} {\rm{CONH}}_{\rm{2}} + {\rm{H}}_2 {\rm{S}}\quad {\rm{,}}$$
 $${\rm{Cd}}^{{\rm{2}} + } + {\rm{S}}^{{\rm{2}} - } \to {\rm{CdS}}\quad {\rm{.}}$$
It is needed to point out that the appropriate amount of acetic acid is a key factor during the formation and assemble of ZnS microspheres. As an organic weak, acetic acid has an appropriate pH, in which H+ can be released slowly. Under such conditions, the decomposition ratio of (NH2)2CS can be controlled by the concentration of H+ in the system and then the nucleation and assembly of ZnS microspheres from the kinetics can be controlled. Thus, the assembled ZnS microspheres with uniform size can be obtained.
C. Optical and photoluminescence properties of ZnS/CdS
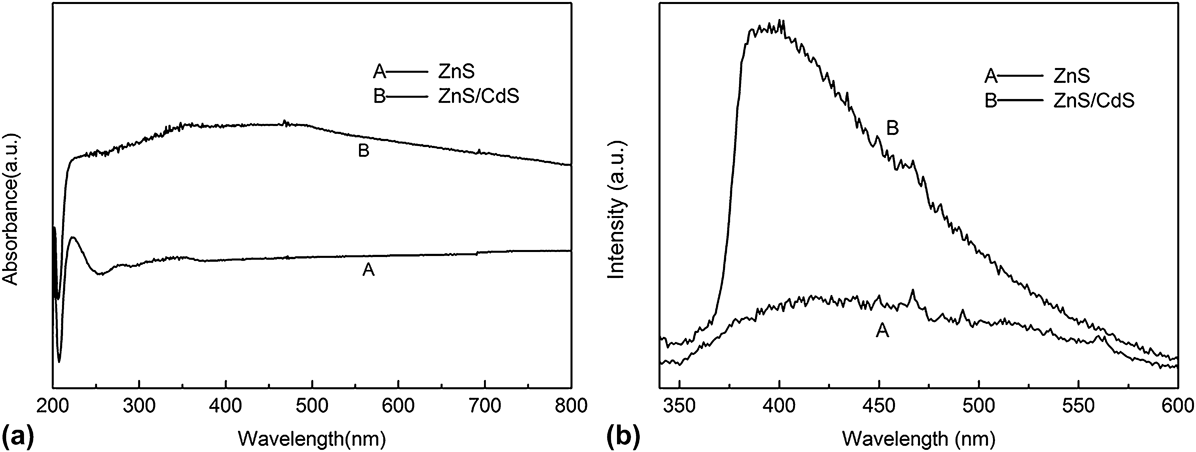
The optical properties of spherical ZnS and ZnS/CdS composites were measured by UV-vis absorption and PL spectroscopy. The UV-vis absorption spectra of the spherical ZnS and ZnS/CdS composites are shown in Fig. 4(a), which were recorded after the powder samples being dispersed in ethanol. As shown in Fig. 3(a), the absorption spectra of ZnS microspheres mainly show two absorption peaks centered at about 224 and 340 nm, which exhibit a slight blue-shift compared to that of bulk ZnS (345 nm). The absorption spectra of the ZnS/CdS spherical composites are dominated by the ZnS core, but the absorption of 224 nm decreases and the absorption of 340 nm becomes wider owing to the influence of the CdS shells. The photoluminescence (PL) measurements of pure ZnS and ZnS/CdS composites were carried out at room temperature with 300-nm excitation [shown in Fig. 3(b)]. It can be clearly seen that the weak and broad emission spectra from pure ZnS are mainly located in the blue region with its maximum intensity centered at 420 nm, which might be attributed to interstitial zinc.Reference Manam, Chatterjee, Das, Choubey and Sharma20 Compared to the PL spectrum of the pure ZnS, the emission peak of the as-obtained ZnS/CdS composites exhibited an obvious blue shift and its intensity also had a large enhancement. This large enhancement in the emission is due to the fact that the CdS material suppresses the tunneling of the charge carriers from ZnS to the surface atoms of the CdS nanoparticles, resulting in more photogenerated electrons and holes confined inside the ZnS microstructure.
(a) UV-vis spectra and (b) RT-PL spectra (excitation wave length: 300 nm) of ZnS microspheres and ZnS/CdS spherical composites.
D. Photocatalytic activities of ZnS and ZnS/CdS
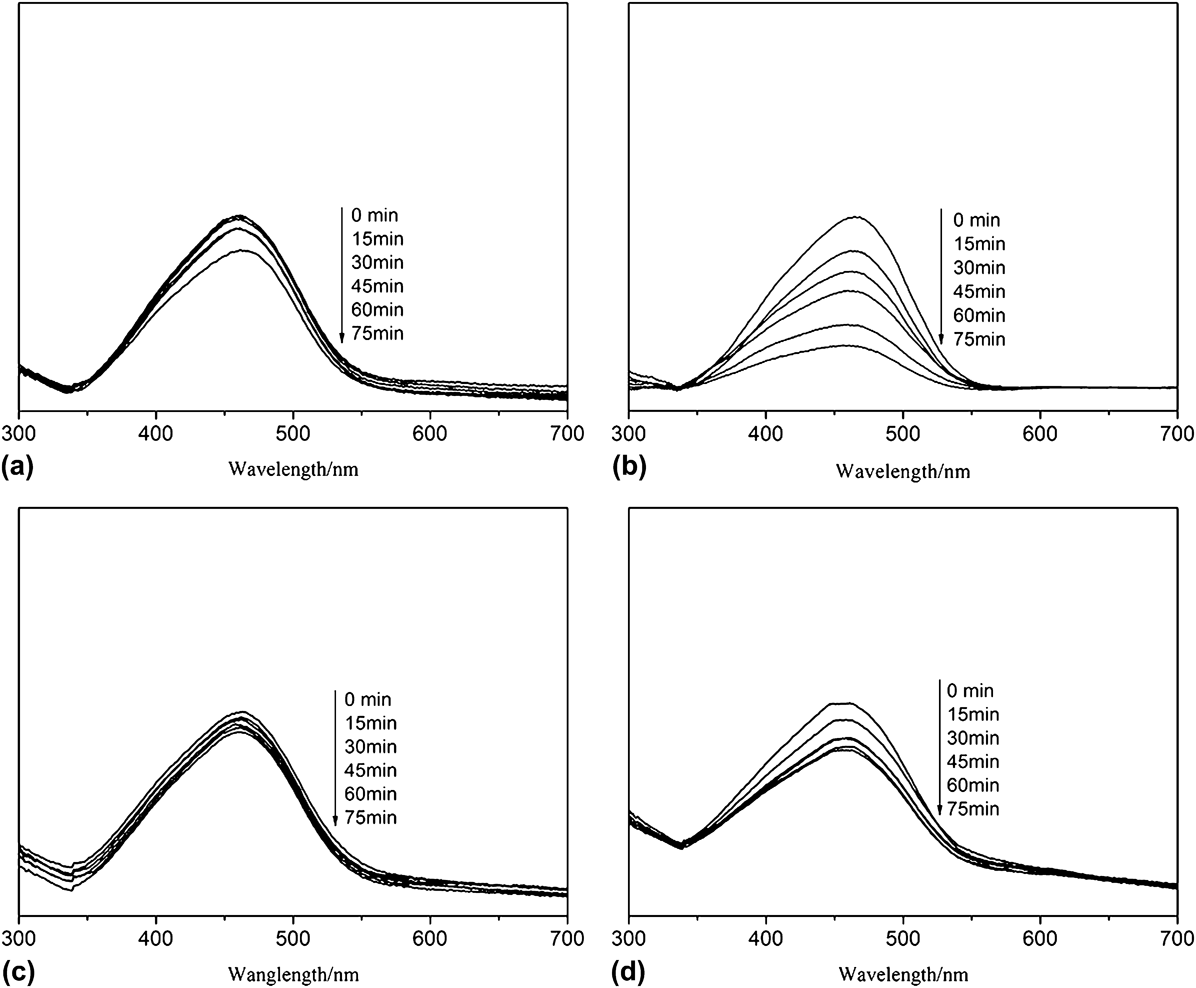
It is well known that the component proportion of the semiconductor composites can affect their property. So the photodegradation experiments for MO with different concentrations of CdS to ZnS were carried out (as shown in Fig. 5). Figure 5 shows the UV-vis absorption spectra of MO solutions in the presence of catalysts with different ZnS/CdS ratios under UV for 75 min: (a) ZnS:CdS = 4:1, (b) ZnS:CdS = 2:1, (c) ZnS:CdS = 1:1, and (d) pure CdS. As shown in Figs. 5(a)–5(d), the intensities of the main absorption peak of MO centered at about 460 nm decreased with different degrees as the exposure time being increased to 75 min under UV. And when the concentration ratio of ZnS to CdS is 2:1, the as-prepared ZnS/CdS composites possess better degradation ability than other concentrations and than only CdS [as shown in Figs. 5(a)–5(d)]. The reason may be that low concentration of CdS will lead to the formation of few hydroxyl radicals (.OH), which decreases the degradation ratio of MO; however, high concentration of CdS will overlap the active site at the CdS/ZnS interfaces, which also affects the degradation activity of MO. So the composite with ZnS/CdS being 2:1 is chosen to evaluate the photogradation activities.
UV-vis absorption spectra of MO in the presence of catalysts with different ZnS/CdS ratios: (a) ZnS:CdS = 4:1, (b) ZnS:CdS = 2:1, (c) ZnS:CdS = 1:1, and (d) pure CdS.
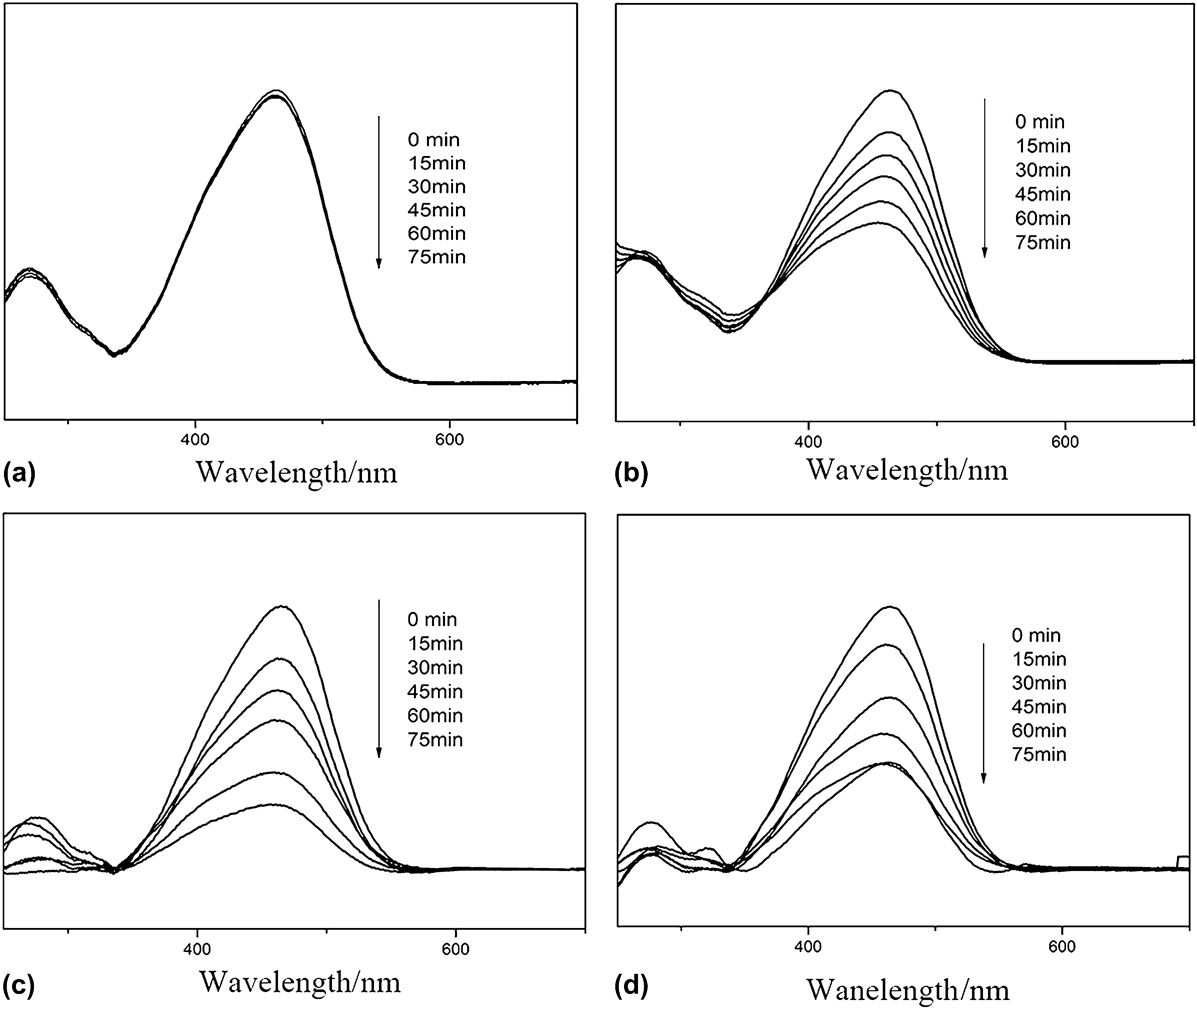
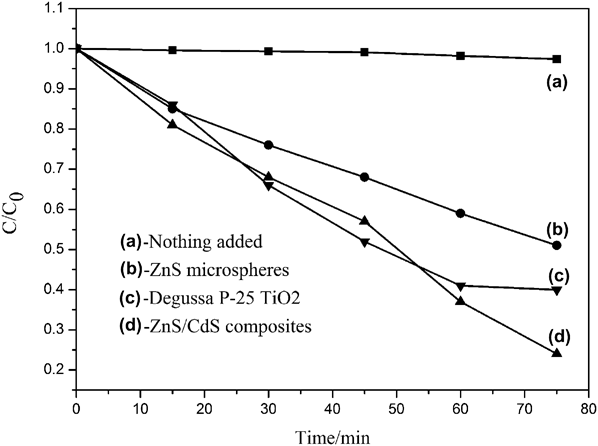
Figure 6 shows the UV-vis absorption spectra of MO solutions under UV irradiation for 75 min at room temperature in the absence of any catalysts [Fig. 6(a)], in the presence of ZnS microspheres [Fig. 6(b)], commercial anatase TiO2 (P-25) [Fig. 6(c)], and the as-prepared ZnS/CdS [Fig. 6(d)] as the photocatalysts. The photocatalytic degradation activities of ZnS microspheres and commercial anatase TiO2 (P-25) under the same conditions were used as evaluation parameters. As shown in Figs. 6(a)–6(d), after being irradiated by UV for 75 min, the intensities of the main absorption peaks of MO centered at about 460 nm also decreased with different degrees. In general, the degradations for MO in the presence of catalysts are found to be better than that in the absence of catalysts. What is more important is that the as-prepared ZnS/CdS composites possess stronger degradation ability than its constituent ZnS and even the commercial TiO2 (P-25). Figure 7 further exhibits the degradation ratio curves of various catalysts for MO. The y-axis of degradation is referred to as C 0 − C/C 0 in which C was the concentration of MO at each irradiated time interval determined at the main wave length of MO, whereas C 0 was the starting concentration when adsorption–desorption equilibrium was achieved. From the chart, it can be seen that MO was hardly decomposed under the absence of catalysts [Fig. 7(a)]. However, when the ZnS/CdS composite catalyst was used, the degradation ratios of the as-obtained ZnS/CdS composites increase to 76% [Fig. 7(d)], showing much greater activity than that of ZnS microspheres (48%) [Fig. 7(b)] and commercial anatase TiO2 (60%) [Fig. 7(c)]. The enhanced photocatalytic activity may be due to the modification of CdS nanoparticles on the surfaces of ZnS spheres. It is well known that ZnS and CdS (E g = 3.7 and 2.4 eV) have different electron affinity and band configuration, and the Fermi energy level of CdS is higher than that of ZnS. Under UV light irradiation, the electrons in the CB of CdS were driven by the potential energy to transfer to that of ZnS. Conversely, the photogenerated holes can move from the VB of ZnS to that of CdS. So, the electrons and holes were separated efficiently at the ZnS/CdS interfaces, reduce the recombination probability and increase the charge carrier lifetime, resulting in improved degradation activity.
UV-vis absorption spectra of MO in the absence/presence of catalysts: (a) without any catalysts, (b) ZnS microspheres, (c) ZnS/CdS composites, and (d) commercial TiO2 (P-25).
Degradation rate curves of MO for different times in the presence/absence of various catalysts: (a) without any catalysts, (b) ZnS microspheres, (c) commercial TiO2 (P-25), and (d) ZnS/CdS composites.
IV. CONCLUSIONS
In this paper, ZnS/CdS composites were synthesized successfully by combining a hydrothermal route at 170 °C for 8 h with a homogeneous precipitation process. It is found that CdS nanoparticles are coated on the surface of the obtained ZnS microspheres. The PL data show that the as-prepared ZnS/CdS composites exhibit an obvious blue shift, and its intensity also has a large enhancement compared to the pure ZnS microspheres. Furthermore, under UV irradiation, the as-prepared ZnS/CdS composites also showed enhanced photocatalytic degradation activity for MO compared to ZnS microspheres and P25. The improved properties may be due to the modification of CdS nanoparticles on the surfaces of ZnS spheres, which may be applied in wastewater treatment.
ACKNOWLEDGMENTS
The authors appreciate the financial support from the National Natural Science Foundation of China (Grant No. 21301113 and 21275094), the Scientific Research Planning Program of the Education Department of Shaanxi Province (Grant No. 2013JK0684), the Scientific Research Planning Program of Key laboratory of Shaanxi Province of China (Grant No. 11JS022), and the Graduate Innovation Fund of Shaanxi University of Science and Technology.