Introduction
Many auxological studies have provided evidence that the better the economic status and well-being of society, the smaller are the differences in biological status (Villerme, Reference Villerme1828; Quetelet, Reference Quetelet1835; Tanner, Reference Tanner1962; Eveleth & Tanner, Reference Eveleth and Tanner1990; Bodzsar & Susanne, Reference Bodzsar and Susanne1998; Mascie-Taylor & Lasker Reference Mascie-Taylor and Lasker2005; Su et al., Reference Su, Esqueda, Li and Pagan2012; Zsakai & Bodzsar, Reference Zsakai and Bodzsar2012; Wronka, Reference Wronka2013). ‘Growth is the mirror of society’ (Tanner, Reference Tanner1962), since differences in socio-demographic conditions, extent of urbanization, access to medical and educational resources and regional social policy all play a part in child growth and development. In addition, regional developmental concepts play a decisive part in shaping the physical development of children (Eveleth & Tanner, Reference Eveleth and Tanner1990; Tanner, Reference Tanner1990; Bodzsar, Reference Bodzsar2006).
Hungary, along with other former socialist countries in Eastern and Central Europe, experienced a rapidly changing political and socioeconomic environment at the turn of the 1980s and 1990s: a shift from a one-party communist system, inhibited social mobility and stratification, centrally planned economy, restriction on individual rights and an underdeveloped and closed financial market to a parliamentary democracy, free elections, the restoration of national sovereignty, market economy, free enterprise, improved social welfare services and free social mobility (Tokes, Reference Tokes1996; Philipov & Dorbritz, Reference Philipov and Dorbritz2003; Bielicki et al., Reference Bielicki, Szklarska, Koziel and Ulijaszek2005; Bodzsar & Zsakai, Reference Bodzsar and Zsakai2014). Although GDP increased, the rate of unemployment and impoverishment increased in Hungary after the transition, and regional differences in socioeconomic development, as well as differences in the socioeconomic strata of society, increased significantly (Liptak, Reference Liptak2012).
In 2001 the Hungarian cabinet, on the basis of economic indicators, recognized that some regions were endangered and needed development. The aim of this study was to determine whether essential differences existed in the physical development, nutritional status and the psychosomatic status of children living in these deprived regions compared with Hungarian national reference values (Bodzsar & Zsakai, Reference Bodzsar and Zsakai2012; Zsakai & Bodzsar, Reference Zsakai and Bodzsar2012).
Methods
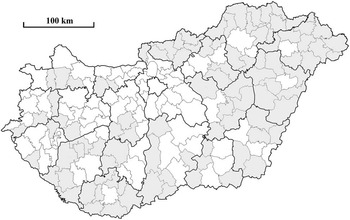
A total of 3128 children were studied (aged 3–18 years, Table 1) in the deprived regions of Hungary between 2010 and 2012, representing 2% of the children in this age range living in these areas. Altogether 95 of the 174 Hungarian regions are rated deprived (Fig. 1), but only 45 of these were included in the study.
The locations of the deprived regions in Hungary (grey).

Number of children studied by age and sex, deprived regions of Hungary, 2010–2012

The regions were graded into ‘deprived’ and ‘non-deprived’ by economic and social welfare indicators (e.g. economic indicators: the ratio of agricultural employment expressed as a percentage of total employment, the number of active enterprises, the amount of local tax per inhabitant, the number of academic researchers per 1000 inhabitants, the number of guest nights spent in commercial and private accommodation per 1000 inhabitants, infrastructural indicators: the ratio of households connected to the municipal water system as well as to regular waste collection, the length of sewer network expressed as a percentage of the length of the total water system length, the number of telephone lines including ISDN per 1000 inhabitants; social indicators: the number of cars per 1000 inhabitants, the number of deaths per 1000 inhabitants, the mean income per inhabitant, urban/rural index, migration ratio; demographic indicators: the ratio of inhabitants below 15 years and above 60 years of age, the ratio of households without any employed family member, the ratio of family members having at least baccalaureate degree, the number of regular social aid recipients; employment indicators: the ratio of job-seekers between the age of 16 and 60 years, activity rate, unemployment rate; Hungarian Government, 2001).
Parents gave their informed consent for their children’s participation before the investigations. Participation was voluntary and data were anonymized and analysed for scientific purposes only. Subjects’ biological status was compared with the Hungarian national reference values (2nd Hungarian National Growth Study (HNGS) 2003–2006; Bodzsar & Zsakai, Reference Bodzsar and Zsakai2012).
The chronological age of children was calculated by using the date of birth (collected during the anthropometric examination) and date of investigation. Children’s body structure was assessed by using body mass, stature, biacromial and bi-iliocristal widths, chest and relaxed upper arm circumferences and subcutaneous skinfold thicknesses (subscapular and triceps). Body dimensions were measured using standard instruments and techniques (Martin & Saller, Reference Martin and Saller1957; Weiner & Lourie, Reference Weiner and Lourie1969). Individual z-scores were calculated in relation to the national dataset (by age and sex) to assess the difference between the body dimensions of children living in the deprived regions and the national reference values. Nutritional status was assessed by body mass index (BMI, weight (kg)/height (m)2), and children were grouped into BMI categories of underweight, normal, overweight and obese using the age-dependent cut-off points recommended by Cole and colleagues (Cole et al., Reference Cole, Bellizzi and Flegal2000, Reference Cole, Flegal, Nicholls and Jackson2007). They proposed BMI cut-off limits using age-dependent trends of BMI and WHO adult cut-off points of underweight, overweight and obesity by defining centile curves passing through the adult cut-off points of 17.5, 25 and 30 kg/m2, respectively, at the age of 18.
In children and adolescents aged between 7 and 18 years, Currie’s standard symptom list (Currie et al., Reference Currie, Roberts, Morgan, Smith, Settertobulte, Samdal and Barnekow Rasmussen2004) was used to assess common psychosomatic complaints (PSCs), which has been validated in Hungarian children and youths (Aszmann, Reference Aszmann1997). The findings are based on self-reported data from questionnaires. The psychosomatic complaints were divided into: somatic health complaints (headache, abdominal discomfort, vomiting, feeling dizzy), psychic health complaints (bad temper, feeling nervous, irritability, fear) and sleeping problems (difficulty in getting to sleep, waking up several times at night, waking tired after a night sleep) subgroups. Subjects were asked how often they experienced the PSCs during the previous 6 months. To assess the frequency of experiencing complaints a five-point scale was used (almost every day, more than once a week, once a week, once a month, seldom or never). Children were considered having complaints very frequently if they reported experiencing them more often than once a week. Additionally, children were asked to rate their health status in terms of excellent, good, fair and poor.
Hypotheses were tested at the 5% probability level and analyses were undertaken using SPSS version 14.0 software package (χ 2 test for testing distributions’ homogeneity; Student’s t-test for comparing z-scores with the national reference values). A one-sample binomial (sign) test was carried out in body mass (a dichotomously scored variable was created for each age: if the deprived regions had a lower median they were scored 1, if they had a higher median they were scored 0), because the visible general trend and the results of the statistical analyses seemed contradictory.
Results and Discussion
Body dimensions of children living in the deprived regions
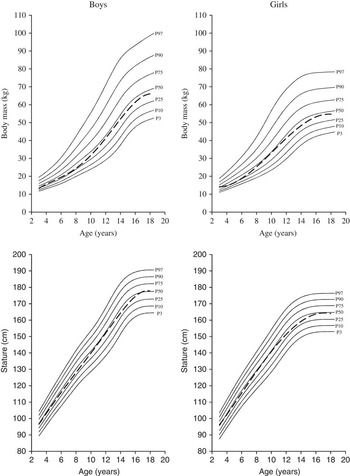
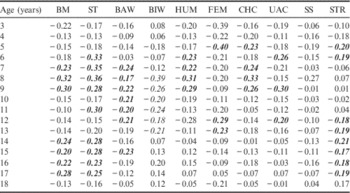
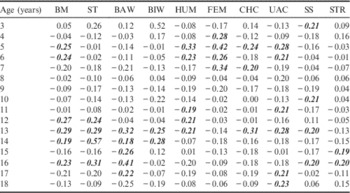
Both the body mass and the stature of children living in the deprived regions were worse than the national reference values in the age groups 7–9 years and 14–17 years in boys, and in the age groups 5–6 years (only body mass differed) and 12–16 years in girls (p<0.05, Student’s t-test; Fig. 2, Tables 2–3). The sign tests revealed (boys: p<0.05; girls: p<0.05) that overall there was a general trend for children in deprived areas to have a lower median body mass in both sexes. However, this difference between the deprived regions and the national standards was significant in certain age groups.
The median curves (dashed line) of body mass and stature of children living in the deprived regions compared with the Hungarian national reference values (solid lines, HNGS 2003–2006).

Mean z-scores of the studied body dimensions of boys living in the deprived regions compared with the Hungarian national references
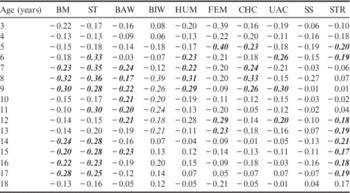
BM: body mass, ST: stature, BAW: biacromial width, BIW: bi-iliocristal width, HUM: biepicondylar width of humerus, FEM: biepicondylar width of femur, CHC: chest circumference, UAC: upper arm circumference, SS: subscapular skinfold, STR: triceps skinfold.
Significant values (p<0.05) in bold and italic (Student’s t-test).
The z-scores of the studied body dimensions of girls living in the deprived regions compared with the Hungarian national references
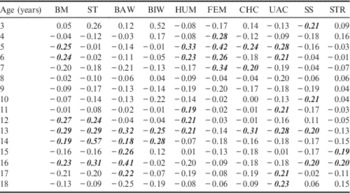
BM: body mass, ST: stature, BAW: biacromial width, BIW: bi-iliocristal width, HUM: biepicondylar width of humerus, FEM: biepicondylar width of femur, CHC: chest circumference, UAC: upper arm circumference, SS: subscapular skinfold, STR: triceps skinfold.
Significant values (p<0.05) in bold and italic (Student’s t-test).
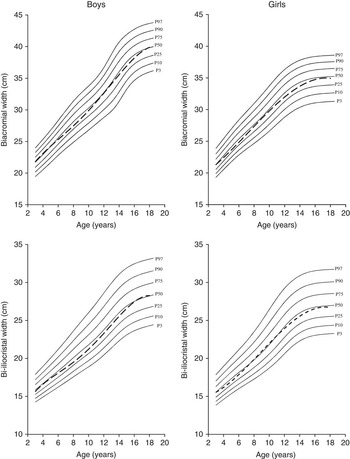
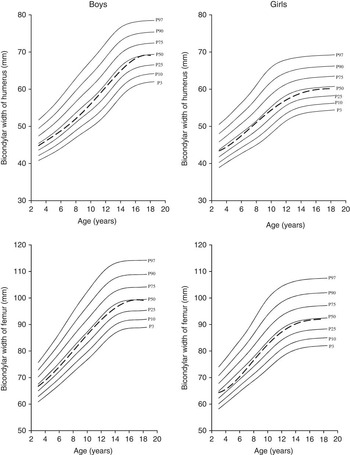
The trunk widths of deprived children differed significantly from the national reference values only in the age groups of 8–10 years in boys and 12–14 years in girls (significant differences: biacromial width – boys: 8 and 15 years, girls: 13–16 years; bi-iliocristal width – boys: 8–11 years, 13 years, girls: 14 years; p<0.05, Student’s t-test; Fig. 3). There was a tendency for the median curves of the limb widths in children living in the deprived regions to run below the national reference median curves throughout the studied age range (Fig. 4). Significant differences were found in some age groups (biepicondylar width of humerus – boys: 7–9 years, girls: 11–13 years; biepicondylar width of femur – boys: 5, 12–13 years, girls: 5–7 years; p<0.05, Student’s t-test; Fig. 4, Tables 2–3).
The median curves (dashed line) of biacromial and bi-iliocristal widths of children living in the deprived regions compared with the Hungarian national reference values (solid lines, HNGS 2003–2006).

The median curves (dashed line) of biepicondylar width humerus and femur of children living in the deprived regions compared to the Hungarian national reference values (solid lines, HNGS 2003–2006).

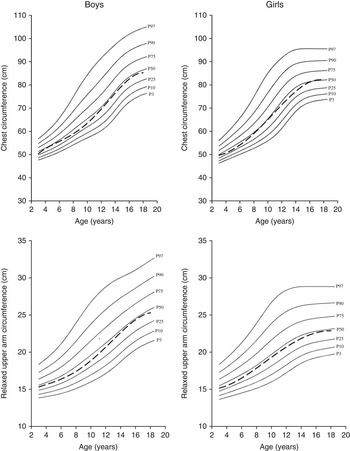
When considering both the trunk and limb circumferences it was observed that the circumferences in children living in the deprived regions were smaller than the national reference values in boys aged between 8 and 10 years and in girls aged between 12 and 14 years (significant differences were found in the following age groups: chest circumference – boys: 9 years, girls; 13 years, relaxed upper arm circumference – boys: 6, 9, 12 years, girls: 6, 8, 11, 13, 16–18 years; p<0.05, Student’s t-test; Fig. 5, Tables 2–3).
The median curves (dashed line) of chest and upper arm circumference of children living in the deprived regions compared with the Hungarian national reference values (solid lines, HNGS 2003–2006).

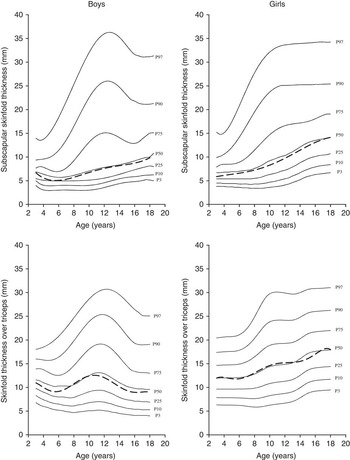
By comparing the deprived children’s median curves of subcutaneous skinfolds thicknesses with the national reference curves it was found that boys living in the deprived regions had smaller skinfold thicknesses both on the trunk and the extremities in the age group 4–6 years and only on the extremities from the age of 11 years onwards, while deprived girls accumulated smaller amount of subcutaneous fat on the trunk in the age groups of 4–6 years and 9–16 years and on the upper extremities in the age group 14–16 (p<0.05, Student’s t-test; Fig. 6, Tables 2–3).
The median curves (dashed line) of subscapular and triceps skinfold thicknesses of children living in the deprived regions compared with the Hungarian reference values (solid lines, HNGS 2003–2006).

Nutritional status of children living in the deprived regions
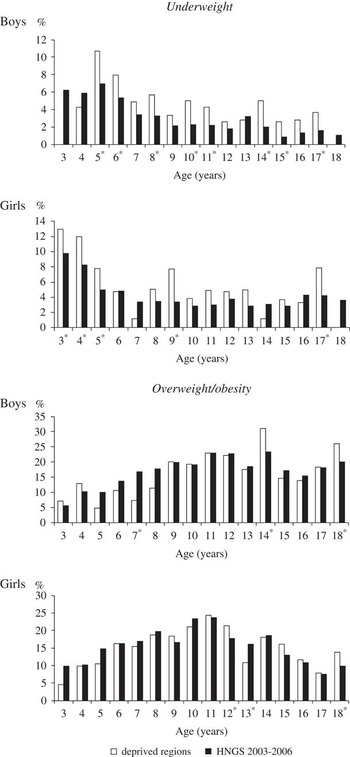
There was a tendency for the prevalence of underweight to be significantly higher in children and adolescents living in the deprived regions in both sexes compared with the Hungarian reference values: the prevalence of underweight boys was 4.8% in the deprived regions and 2.9% was in the national study (p<0.001, χ 2 test), while the prevalence of underweight in girls was 5.9% in the deprived regions and 4.0% in the national study (p=0.003, χ 2 test). By considering the age-related comparison of underweight children’s prevalence significant differences were found between the deprived regions and national study in the following age groups: 5–11 and 14–17 years in boys and 3–5, 9 and 17 years in girls (p<0.05, χ 2 test; Fig. 7).
The prevalence of underweight and overweight/obesity in children living in the deprived regions compared with the Hungarian reference values (HNGS 2003–2006; *significant differences, p<0.05, χ 2 test).

The prevalence of overweight and obese nutritional status in children living in the deprived regions was very similar to the national reference values: the total prevalence of overweight and obese boys was 20.2% in the deprived regions and 21.5% in the national study (p=0.414, χ 2 test), while the prevalence of overweight and obese girls was 19.8% and 19.1% in the two studies (p=0.667, χ 2 test), and within each age group the same similarity was found between the deprived regions and the national reference values (p>0.05, χ 2 test, with the exception of age groups 7, 14 and 18 years in boys and 12–13 and 18 years in girls; Fig. 7).
Subjective health status of children living in the deprived regions
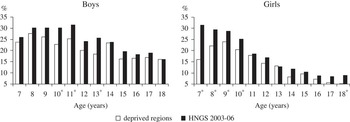
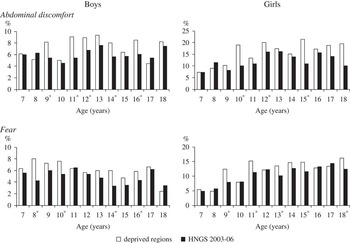
Children and adolescents (aged between 7 and 18 years) living in the deprived regions were less likely to rate their health as excellent (Fig. 8) than the national reference values from the ages of 10 to 13 years in boys and from 7 to 10 years in girls. The results of prevalence of experiencing psychosomatic complaints are presented here only for abdominal discomfort and fear due to space limitations. In the case of the other psychosomatic complaints the pattern of experiencing the complaints very frequently in the deprived children was very similar to the national reference values (p>0.05, with the exceptions of very few age groups).
The percentage of children who rated their health status excellent in deprived regions compared with the Hungarian reference values (HNGS 2003–2006; *significant differences, p<0.05, χ 2 test).

Deprived children experienced abdominal discomfort more often than the national reference values in the age groups 9–16 years for boys and 10, 12 and 15 years for girls (Fig. 8). The only psychosomatic complaint that showed a significant difference between deprived regions and national reference values was fear. Children living in deprived regions complained about fear more often than the national reference values in the age groups 8–10 and 14–16 years for boys and 9–11 and 13–15 years for girls (Fig. 9). Deprived children did not complain more frequently about sleeping problems than children studied in the national study.
The percentage of children who reported a high frequency of psychosomatic health complaints (abdominal discomfort and fear) in deprived regions compared with the Hungarian reference values (HNGS 2003–2006, *significant differences, p<0.05, χ 2 test).

Conclusions
Significant political changes, which were accompanied by dramatic economic changes and social restratification, occurred in Hungary – as in most of the other Eastern and Central European countries – from the 1990s. The socioeconomic inequalities among the regions of the country, as well as among the socioeconomic strata of society, intensified during this complex political and socioeconomic transition. By comparing the biological status indicators of children living in the deprived regions of Hungary with the national reference values it can be concluded that children from these regions had (1) retarded body development in the age groups 7–9 years for boys and 4–6 years for girls and in the age interval between 14 and 17 years in both sexes; (2) greater risk of being underweight than the national reference values, but there were no significant differences in the prevalence of overweight and obese children between deprived and non-deprived regions; (3) body developmental retardation that reflected the health status of children and adolescents living in the deprived regions, since these rated their health status worse and experienced more psychosomatic problems (abdominal discomfort and fear) than the national reference values.
Although most body dimensions of children living in the deprived regions had median values close to the 50th centile of the Hungarian national references, the retardation was statistically significant in all the studied linear, transverse, girth dimensions and skinfold thicknesses, as well as both on the trunk and the extremities. Therefore it can be concluded that there was a general body developmental retardation, and the higher rate of underweight in the deprived children was presumably caused by the underdevelopment of almost all the body mass components at the tissue system level (muscle, bone and fat). A prospective longitudinal study could explore the influence of the adverse psychosocial environment on children’s growth pattern in more detail.
Furthermore, it seems that the European tendency of increased prevalence of obesity in the lower socioeconomic strata (Evans et al., Reference Evans, Newton, Ruta, MacDonald and Morris2000; Cummins & Macintyre, Reference Cummins and Macintyre2006; Taylor et al., Reference Taylor, Poston, Jones and Kraft2006) has not been confirmed in this study. Similar or higher prevalence of overweight children in the lower socioeconomic strata than in the higher socioeconomic strata was also found in the Czech Republic, Poland and Russia from the Eastern and Central European regions (Wang et al., Reference Wang, Monteiro and Popkin2002; Due et al., Reference Due, Damsgaard, Rasmussen, Holstein, Wardle and Merlo2009; Koziel & Lipowicz, Reference Koziel and Lipowicz2009; Suliga, Reference Suliga2009). The parental occupational level, the mean income per family member and the number of children in the family were used from the socioeconomic indicators to assess the socioeconomic status level in these studies.
The results of this study indicate that there is an association between economic deprivation and physical growth, development and well-being. Thus the eradication of child poverty in Hungary should be prioritized. A limitation of the present study was that it did not take into account micro-environmental factors, so future research should extend the analysis to consider the socioeconomic status of families in the deprived regions of Hungary. Since both the prevalence of overweight/obese and underweight children increased in Hungary (by 5–10% and 1–2%, respectively) between the 1980s and the beginning of the 2000s (Bodzsar & Zsakai, Reference Bodzsar and Zsakai2012, Reference Bodzsar and Zsakai2014), future research should study whether this secular trend can be detected in children living in the deprived regions as well.
Acknowledgments
The study was supported by the Hungarian National Foundation for Science (OTKA grants K 47073 and K 76849). The work of Annamaria Zsakai was also supported by a Janos Bolyai Research Scholarship (2014–2017) from the Hungarian Academy of Sciences.