Introduction
The purpose of this article is to provide new empirical evidence of the relationship between poverty, its duration and gradation, and social exclusion. Studies from several countries show astonishingly low correlations between social and economic problems (Barstad, Reference Barstad2000; Fløtten, Reference Fløtten, Heggen, Bergem, Kvalsund and Myklebust2003b, Reference Fløtten2006; Burchardt et al., Reference Burchardt, Grand and Piachaud1999; Whelan et al., Reference Whelan, Layte, Mâitre and Nolan2001; Eurostat, 2003). However, one possible flaw of these findings is that the analyses in main are founded on cross-sectional data. Hitherto, studies of the relationship between economic and social problems have rarely applied a dynamic perspective. In this article we assume that ‘time matters’; that is, that it may take some time until income poverty carries over into elevated risks of exclusion from different social arenas. We focus on two different dimensions of social exclusion – exclusion from social networks and exclusion from participation in civic organisations – and explore whether poverty dynamics affect these two dimensions in the same way.
Our ambition is to undertake an empirical analysis of social exclusion that is faithful to recent theoretical developments of the concept. By adopting a dynamic approach to poverty and by looking at multiple variants of social exclusion, we are more true to the core ideas of social exclusion, and also to modern poverty research (Room, Reference Room1995; Townsend, Reference Townsend1979). To justify the two dimensions of social exclusion we have selected for scrutiny, we draw on insights developed by the rapidly growing social capital literature, namely by differentiating between social relationships that are bonding and those that are bridging (Field, Reference Field2003). Seen in a broader comparative perspective, it opens up the opportunity to discuss how national welfare policies influence the relationship between poverty and social exclusion and not only the magnitude of these problems per se.
Conceptual issues: poverty and social exclusion
During the past ten to 20 years, the concept of social exclusion has become increasingly popular. Despite this popularity, or maybe because of it, the concept is vague and denotes a multitude of states, processes and outcomes. Room (Reference Room1995, Reference Room, Gordon and Townsend2000) has proposed a definition of social exclusion that has been influential in the theoretical discourse in Europe. It involves five defining criteria: social exclusion is multidimensional; it is concerned with dynamic processes; it is relational as much as distributional; it focuses on the collective resources (for example, local areas and communities rather than on the individual or household); and it directs attention to catastrophically ruptured links to the wider society. Most definitions allude to at least one or more of these defining criteria (see Walker and Walker, Reference Walker and Walker1997; Burchardt et al., Reference Burchardt, Le Grand, Piachaud, Hills, Grand and Piachaud2002). Rarely, however, and only quite recently have researchers had access to data that comply with two or more of these criteria. Our own analysis explores the first three of these criteria (the multidimensional, the dynamic, and the relational aspects of social exclusion), and we use rupture of social relationships as an indicator of exclusion (infrequent social contacts and lack of participation in civil activities).
Several scholars have pointed out that exclusion does not radically differ from some approaches to poverty (for example, Burchardt et al., Reference Burchardt, Le Grand, Piachaud, Hills, Grand and Piachaud2002; Phillips, Reference Phillips2003; Fløtten, Reference Fløtten, Heggen, Bergem, Kvalsund and Myklebust2003b, Reference Fløtten2006). Certainly, the approach to poverty advocated by Townsend (Reference Townsend1979) and others includes many of the same elements as those included in the notion of social exclusion. The similarities mostly pertain to the notion of relative deprivation and to the importance of social relations and norms for defining and understanding poverty. On some accounts, however, there are also differences. The emphasis on multidimensionality in the notion of social exclusion distinguishes it from an economic poverty approach, which focuses primarily on economic and material resources. An exclusion understanding also opens up the possibility that social exclusion may have causes other than poverty – for example, discrimination and lack of civic rights – and that exclusion hits entire communities and not just individuals and households (Phillips, Reference Phillips2003). We see this issue of causes of social exclusion as a fundamentally empirical question that will be pursued in this work.
Our approach also invokes the notion of social capital. Basically, social capital is seen as having two main components: an attitudinal component consisting of generalised trust, and a structural component defined by social networks. It is the structural part we examine in this article. The social network part of social capital can be understood both as horizontal bonds between like-minded individuals, and as bridges between individuals with different positions and separate networks (Putnam, Reference Putnam2000: 22). Each form of social capital is helpful in meeting different human needs. Bonding social capital is important to maintain strong in-group loyalty and reinforce specific identities. Bridging social capital is useful for links to external assets, and it is an indication of engagement and participation in activities that are beneficial for the society as a whole (Field, Reference Field2003: 32).
The two forms of social exclusion we explore can be seen as indicators of bonding and bridging ties. Being excluded from personal networks by not having regular contact with friends and family is considered an indicator of weak bonding ties, while not being member of any organisation is considered an indicator of weak bridging ties.
Both bridging and bonding ties are important to promote integration into society, and can be of special importance for marginalised and underprivileged groups. Having friends or family to socialise with is considered an important asset in difficult situations, for example if one is poor. Such contacts can be an important source of emotional support, and in some instances they may also provide economic support or practical help. While bonding ties are exemplified by personal relationships, bridging ties refer to a broader network of acquaintances. To be an integrated member of society depends not only upon having close relationships but also on having acquaintances who can be of help in different ways. One of the advantages of such networks, for example, is the opportunity to use other members of the network as a means of escaping poverty. An unemployed person who does not take part in any civic activities, for example, does not have the same opportunities for meeting people who can help in finding a job as an unemployed person who does. Consequently, if a person who experiences poverty also lacks social relationships (bonding ties) and/or is not part of a broader network of acquaintances (bridging ties), this is likely to reinforce the negative effects of economic shortages, and reduce the likelihood of escaping poverty.
Our analytical approach is based on the premise that severe lack of economic resources, as measured by poverty, might have a causal impact on social relationships. Following the well-known argument of Townsend (Reference Townsend1979), to build and maintain social relationships like the ones we are looking at here requires a certain level of economic resources, among which income is an important if not a perfect and exhaustive measure. Examples are money to buy and run a car, a computer and an internet connection, to be able to invite friends for dinner or a birthday party, to go out to meet friends or go to a movie, or to go on holiday with friends and acquaintances. In the present context of membership of organisations, members must be able to afford to go to meetings and to pay their membership fees. Also, more subtle barriers may be conceived of – for example, psychosocial barriers such as feelings of shame or low self-esteem and dignity – which might hinder socialising with people outside their inner circle. Given that poor people tend to be stigmatised, being considered inferior, and treated with disrespect, such responses are likely to discourage the poor from engaging in social relationships of the bridging type. Moreover, we think it is plausible that such processes are less pronounced if poverty lasts only for a short period of time, or occurred some years ago, or is shallow, than if it is more persistent, recent or deeper. It is, of course, hard to verify empirically that the causal direction is as depicted, in so far as feasible empirical data seem to be missing. Hence, our position hinges upon the soundness of our theoretical arguments. Although we think that there are fairly convincing arguments, backing the claim that poverty influences social relationships, we will not dismiss the possibility that the relationship also may be recursive.
Previous research
Numerous indicators have been used to measure social exclusion. One of the most comprehensive lists of social exclusion indicators is found in the British project ‘Monitoring poverty and social exclusion’ (Howarth et al., Reference Howarth, Kenway, Palmer and Miorelli1999), where 50 different indicators are reported on an annual basis. Most other studies, however, focus on a narrower range of indicators. Some emphasise the interpersonal dimension of exclusion (Reference 66, 1997) or the subjective feeling of social exclusion or loneliness (Barstad, Reference Barstad2000). Others look at accumulation of welfare deprivation, such as Paugam's (1996) analyses of cumulative, social disadvantage in Europe, and Halleröd and Heikillä's (Reference Halleröd, Heikillä, Kautto, Heikkilä, Hvinden, Marklund and Ploug1999) study of social exclusion in the Nordic countries. Yet other studies use labour market participation as a core indicator (Clasen et al., Reference Clasen, Gould and Vincent1997).
Studies explicitly exploring the link between poverty and social exclusion show mixed results. Some have concluded that there is a relationship between level of income and patterns of social contacts (Vogel, Reference Vogel1997; Halleröd, Reference Halleröd1994; Paugam, Reference Paugam1996). On the other hand, Bradshaw and Finch's (Reference Bradshaw and Finch2003) study of the British Poverty and Social Exclusion Survey revealed that the income poor are not more likely than the non-poor to have no contact with family or friends, neither are they more likely to lack social support. The same study does, however, find that the income poor are more often unable to participate in a number of activities, and they are more often than the non-poor disengaged from all activities. In a cross-sectional study comparing Australia and Britain, Saunders and Adelman (Reference Saunders and Adelman2006) demonstrated that the distributional profiles of deprivation and exclusion were very different in the two countries. Britain had the higher income poverty rate of the two countries. Yet the occurrence of both deprivation and exclusion was higher in Australia. This study thus indicates that the relationship between income poverty and indices of social exclusion varies between countries and most likely also between welfare state regimes.
Based on Norwegian data, Fløtten et al. (Reference Fløtten, Dahl and Grønningsæter2001) conclude that some indicators of disadvantage have higher correlation than others (for example, that recipients of social assistance often report economic problems), but a subjective correlate of social exclusion (that is, feeling of loneliness) rarely occurs in any of the poverty categories employed in the study. The relationship between other forms of social problems and income poverty is even less pronounced and sometimes even reversed. For example, the non-poor often have less social contact than the poor (Fløtten, Reference Fløtten2003a). This phenomenon of independence between social problems and material deprivation is by no means limited to Norway, but applies also to countries with different welfare state regimes. Short's (Reference Short2005) study of income poverty and multiple indicators of economic hardship from the USA shows that there is a considerable degree of independence between different measures of income poverty and material hardship. Material hardship is something different from income poverty and is worthy of measurement in its own right.
These studies do, however, have a common shortcoming that the present study overcomes, at least to some extent. They are all based on cross-sectional data. There are reasons to believe that a dynamic approach might change the picture somewhat for the worse: that multiple deprivation is more common for people who experience persistent poverty. Detrimental social consequences of poverty may emerge after some time has passed: hence the call for longitudinal data.
Until now, no such data have been available in Norway, but what does longitudinal evidence from European countries tell? A number of studies of poverty and social assistance dynamics have surfaced over the past few years, as well as studies that adopt a comparative perspective (Saraceno, Reference Saraceno2002; Dahl and Lorentzen, Reference Dahl and Lorentzen2003; Fouarge and Layte, Reference Fouarge and Layte2005). These tend to show that the welfare state regime matters. For example, income poverty and social assistance receipt appear to be of a shorter duration in Scandinavian welfare states than in other countries. However, to our knowledge only a few studies have focused on the relationship between poverty duration and social exclusion. Eurostat (2003) has used panel data to investigate the relationship between poverty, multiple deprivation and social exclusion over time in the EU countries using the European Community Household Panel (ECHP) data covering four years around the mid-1990s (1994–1997). The study concludes that poverty duration (or number of poverty spells) is indeed linked to multiple deprivation. This applies to all European countries, although some countries, especially in the south of Europe (such as Portugal), are worse situated than others, especially the northern countries (such as Denmark). As might be expected, work and labour market variables strongly influence the risk of persistent deprivation. Nevertheless, persistent risk of poverty and persistent risk of deprivation do not interact in a cumulative fashion. For example, economic strain is not higher for those who are both persistently deprived and at the same time persistently poor. Whelan et al. (Reference Whelan, Layte and Maître2002, Reference Whelan, Layte and Maître2003, Reference Whelan, Layte and Maître2004) and Berthoud et al. (Reference Berthoud, Bryan and Bardasi2004) draw similar conclusions in their analyses of the ECHP. Burchardt et al. (Reference Burchardt, Grand and Piachaud1999) used the British Household Panel Survey to examine poverty and social exclusion over time in Britain.Footnote 1 Their findings are similar to those just reported from European countries. To summarise the findings from European countries based on panel data, poverty duration increases the risk of multidimensional deprivation and also the risk of social exclusion. Nonetheless, few experience multiple deprivation.
Yet studies of the dynamic relationship between poverty and social exclusion are still rare throughout Europe and non-existent in Norway. What this article adds to current knowledge in Europe is an analysis of how poverty dynamics are related to two different dimensions of social exclusion in a social democratic country not hitherto investigated, Norway. It is possible that people experiencing poverty for a prolonged period may be more at risk of social exclusion in such a country than in countries where more people are poor and where the general living standards are not as good. The logic behind such an assumption is that in extensive welfare states where the welfare allowances are relatively generous, prolonged poverty is associated with more severe social problems than in countries where fewer and less generous allowances are introduced to fight poverty.
Data and methods
Data
We use Statistics Norway's surveys of living conditions panel study, which cover six annual waves of data collection. The original sample was drawn in 1997 and consisted of 5,000 persons aged 16–79 years. The sample is updated every year to include immigrants and persons aged 16 to keep the sample representative. People in the sample are interviewed every year, and Statistics Norway has initiated several measures to maintain a high response rate and a representative sample (Kleven, Reference Kleven2002). We limit the observation window to the years 1997 to 2000, since 2000 was the only year when the dependent social exclusion variables had been collected. The number of respondents available for most of the present analyses is about 5,105. The response rate started out at 79 per cent in 1997 and fell to 70 per cent in 2002 (Normann, Reference Normann2004). A total of 312 persons have left the sample due to natural causes such as death, emigration and so on. Statistics Norway has evaluated the non-response rate in all waves from 1997 to 2000, and concludes that the correspondence between gross sample and net sample is very good (Kleven, Reference Kleven2002). Furthermore, Statistics Norway does not recommend weighting of the results. From a total of 5,000 respondents in first wave, there is a total loss of 729 persons up to the fourth wave. Another 1,051 persons have incomplete time-series, which leaves a total of 3,220 of the original sample (Kleven, Reference Kleven2002).
Students are excluded from the analyses for two reasons.Footnote 2 Firstly, since student loans are not a part of the income information, the inclusion of students would create a poverty bias among younger respondents. Furthermore, students are officially not considered as poor, even though they are poor by definition. This is because the government considers being a student a transitional life phase.
Operationalisation of variables
Independent variables
In this article poverty is understood and measured in a conventional way by using low income as the sole indicator. This is in line with contemporary poverty studies in many countries, Norway included. It also corresponds to Norwegian anti-poverty initiatives as well as policies pursued by international bodies such as the EU and OECD. However, since poverty levels based on low income are inherently arbitrary, we have calculated three poverty lines: 50, 60 and 70 per cent of median equivalised household income. The OECD82 equivalence scale is used to adjust for the number of household members. This scale assigns the weight 1 to the first adult, 0.7 to the second and 0.5 to each child below 16 years of age. The reference group for all analyses are non-poor, with incomes above the poverty threshold in question.
Furthermore, four different typologies of poverty duration have been constructed. These are mutual excluding categories, where ‘previously poor’ is defined as the experience of only one year in poverty early in the period (1996–1998). ‘Recently poor’ incorporates individuals that have been poor only once, but late in the period (1999–2000). ‘Recurrent poor’ includes individuals who have spent two or three years in poverty, independent of the order of poverty spells. ‘Permanently poor’ are those who have spent between four and five years in poverty during the entire five-year period. The poverty duration typologies are created from an idea that poverty is increasing in severity from the category of previously poor to the category of permanently poor. All the poverty duration categories are constructed for poverty thresholds of 50, 60 and 70 per cent of median income. This is done in order to be able to uncover whether there exists a threshold where the effects of poverty on social exclusion are more pronounced than elsewhere.
In the multivariate analyses, we control for the additional effects of education, age, gender, marital status, parenting, ethnicity and work activity. Parenting refers to children living in the household. Due to the fact that the number of poor is very low, we had to exclude detailed family information. Hence the only family information we have included is whether the person is married or not, and if there are children in the household. We have not separated older people (over the age of 67) in receipt of pensions into a separate group, since more than 10 per cent in this age group are still working, and because these constitute only 16 per cent of our sample. In the tables only the effects of the different poverty categories are presented.Footnote 3 Due to the construction of the poverty typologies, we have not performed panel data analysis on the data. Therefore, the background variables are static, and not time varying. We have chosen to set the background information to the year 2000, the same year as we measure social exclusion. Hence, we do not analyse changes in background characteristics that might have occurred in the first three waves. This might have implications for the prediction of social exclusion, to which we return in the discussion, but given the dataset at hand there are no other alternatives.
Dependent variables
As indicated in the theory section, social exclusion is a multidimensional concept. The literature suggests several dimensions, among them the ones we adopt in this analysis. Our analysis covers two domains that are operationalised as follows. It should be noted that information on these two items is available in one wave, for the year 2000.
• Exclusion from social networks: Not having a close friend or, if having a friend or friends, infrequent contact with them. These questions were posed in 2000. Those who do not see friends regularly (at least once a month) are considered at risk of being socially excluded.
• Exclusion from participation in civic organisations is based on activity level in voluntary organisations, unions, sports clubs and religious organisations. Overall, 15 different types of organisations were specified in the questionnaire. In addition, ‘other organisations’ was offered as the final option. Persons who are registered as very active members in one or more organisations are considered as socially included on this dimension, while those without active membership are considered excluded. The latter group makes up about 46 per cent of the sample. These questions were posed in 2000.
The choice of these variables as indicators of social exclusion needs some justification. As stated in the introduction, social exclusion is a multidimensional concept. We have no ambition to cover all aspects of exclusion, but consider social contact and participation in civic organisations to be relevant aspects of it, especially as we link our discussion to the concept of social capital. The variables measuring friendship and contact with friends are the ones in the dataset best suited to serve as indicators of bonding ties.
Historically, Norwegians have a tradition of high activity levels in voluntary organisations of different kinds, such as political movements, trade unions, feminist organisations and cultural, religious and humanitarian organisations. Over the last two decades, the importance and strength of large popular movements have declined, while new organisations have gained importance (Langeland, Reference Langeland1999; Wollebæk and Selle, Reference Wollebæk and Selle2002). In the late 1990s, 77 per cent of Norwegians were members of at least one organisation (Fløtten, Reference Fløtten2006). Lack of participation in voluntary organisations might indicate a kind of social exclusion from society that is associated with less social capital of the bridging type.
Analytical approach
The analyses are conducted by means of bivariate and multivariate logistic regression. The idea behind this two-stage approach is to find out whether the relationship between poverty and social exclusion is due to any third factor not covered by individual characteristics other than poverty.
In addition to the logit coefficients, we have calculated the in-sample probability of network and civic inclusion, given one belongs to one of the poverty categories. This probability is compared to the probability of network and civic inclusion for those who have never been poor. In cases where the poverty coefficient decreases or disappears from the bivariate to the multivariate analyses but a substantial difference still exists between the probability of poor versus non-poor being excluded from personal networks or civic arenas, there is strong reason to believe that the poor have other common characteristics that co-vary with poverty.
Results
Description of the sample
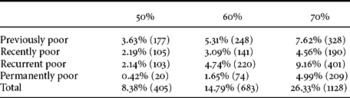
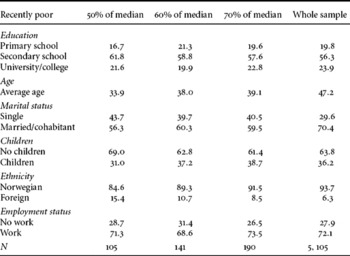
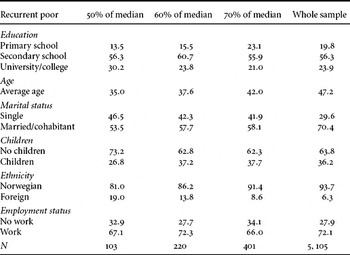
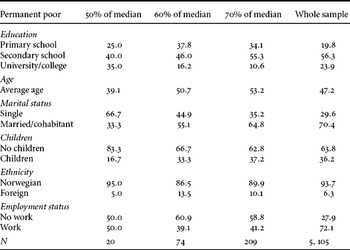
Descriptive statistics are presented in Appendix Tables 1–5. The numbers and percentages of poor along the two dimensions of poverty that we have identified are shown in Appendix Table 1. We see that the numbers are small, especially in the 50 per cent of median income group. Selected individual characteristics of the different poverty categories are shown in Appendix Tables 2–5.
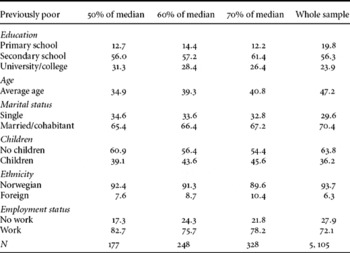
Among the previously poor, all the poverty gradation groups (50, 60 and 70 per cent of median income) are better educated and younger than the average figures for the whole sample. Individuals belonging to the previously poor category also have a higher percentage of work activity than the whole sample. These findings indicate that the group of previously poor have a substantial representation of young people that have recently entered the labour market.
Among the recently poor, there is a lower proportion of persons with higher education. Overall, the recently poor are substantially younger than the average for the whole sample. A large proportion of the individuals in the poverty groups are single, and the highest number is found in the 50 per cent group. The level of work activity is lower than in the group of previously poor.
Among the recurrent poor, we observe that those having the lowest income are also those with the highest education and the lowest age. However, a somewhat lower proportion of the recurrent poor are working. These findings suggest that many in this group are in the transition phase of entering the labour market. However, there is also a high representation of non-ethnic Norwegians among the recurrent poor.
The group of permanent poor consists of very few individuals, especially the poverty groups with 50 and 60 per cent of median income: 20 and 74 persons respectively. First of all, this is an indication of the low number of Norwegians living in severe poverty. Second, it also means that the results should be interpreted with caution as the statistical power is modest. We find a different age and education pattern than we found for previously poor and recurrent poor. The average age is substantially higher and the educational level is substantially lower for the 60 and 70 per cent of median income groups than for the whole sample. Not surprisingly, the groups of permanent poor have the lowest work activity of all the groups in the poverty typologies.
Exclusion from social networks
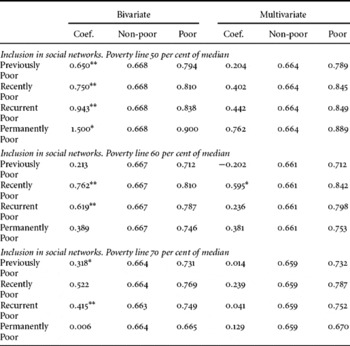
Table 1 shows that for most of the bivariate analyses, the effects of poverty on inclusion in social network are significant. However, the relationship is positive, meaning that the poor are more likely to be included in social networks than the non-poor. This effect changes when we enter the control variables: all the multivariate relationships between poverty and inclusion in social relationships are, with one exception, insignificant. The only significant one is the multivariate analysis of recently poor at 60 per cent of median income on inclusion in social networks. However, the analysis is significant only at the 5 per cent level. This implies that there are factors other than poverty (such as employment status or ethnicity) that account for the positive bivariate relationship between poverty and inclusion in social networks. It is further worth noting that this lack of relationship applies regardless of severity of poverty and where the poverty line is set.
Relationship between two dimensions of poverty and inclusion in social networks. Logit coefficients. In the multivariate analyses the following variables are adjusted for: education, age, gender, marital status, parenting, ethnicity and work activity

Note: One asterisk to the right of the coefficient indicates significance at a 5 per cent level. Two asterisks indicate significance at a 1 per cent level, and three asterisks indicate significance at a 0.1 per cent level.
Exclusion from participation in civic organisations
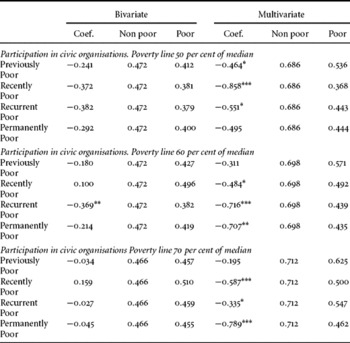
For participation in civic organisations (see Table 2), the pattern is different from that described above. Only the multivariate analyses show that poverty affects participation in civic organisations negatively; compared with the non-poor, the poor are less likely to participate in civic organisations. No systematic picture appears when we compare the multivariate logit coefficients across poverty grades and poverty duration. For example, if we look at the logit coefficients from the multivariate analysis pertaining to below 70 per cent of the median poverty line, we see that coefficients associated with increasing severity of poverty duration are −0.195 (which is insignificant), −0.587, −0.335 and finally −0.879. Similarly, if we keep poverty duration constant, focusing for example on the recurrent poor, we observe that that the logit coefficients pertaining to decreasing depth of poverty starting from 50 per cent are −0.551, −0.716 and −0.335. Hence, we find no evidence of increasing exclusion within the categories of increasing poverty severity and within poverty gradation. Thus, it does not appear that the chance of inclusion increases as poverty severity declines or poverty gradation decreases, as one might expect.Footnote 4
Relationship between two poverty dimensions and inclusion in civic organisations. Logit coefficients. In the multivariate analyses the following variables are adjusted for: education, age, gender, marital status, parenting, ethnicity and work activity

Legend: One asterisk to the right of the coefficient indicates significance at a 5 per cent level. Two asterisks indicate significance at a 1 per cent level, and three asterisks indicate significance at a 0.1 per cent level.
Summary and discussion
We have examined the relationships between different gradations of poverty and poverty duration patterns, and two dimensions of social exclusion: friendship relationships and activity in civic organisations. Two important findings stand out from our analyses. First, the probability of seeing friends regularly is related to whether or not people are poor, but the effect of poverty is not as expected. Poor persons are more likely to see friends regularly than the non-poor. However this relationship is not explained by poverty per se. It is accounted for by a third factor – such as labour market status or ethnicity – as shown in the multivariate analyses. This is the case for all the poverty duration categories and for all the three poverty lines we have identified. Second, we find a significant and negative relationship between poverty and participation in civic organisations, implying that the poor are consistently less likely to participate than the non-poor. By and large, this relationship persists also in the multivariate analyses. Furthermore, we find no evidence of participation in civic organisations being systematically related to poverty duration or to poverty gradation.
This analysis of poverty dynamics and social exclusion is the first to be conducted in Norway and, as far as we are aware, among the first in Europe as well. It has been made possible because Statistics Norway has collected panel data for six years in a row, and has recently made it available to the research community. The availability of these panel data represents an improvement and offers new opportunities for studying the dynamic processes taking place in a representative sample of the Norwegian population. As of today, these data are the best we have for examining our research questions. Yet our data suffer from some limitations. There is a lack of multiple indices of the same domain, especially related to social exclusion/inclusion. The sample size is relatively small. This prevents us from carrying out stratified analyses for subgroups, which would be worthwhile to do in the future when more appropriate datasets become available. Relatively few observations are also an obstacle to studying groups in more extreme poverty, such as groups below 40 or 30 per cent of the median. The fact that the social exclusion variables are available for only one year (2000) means that the causal direction between poverty and social exclusion strictly speaking is undetermined in empirical terms. However, as we argued in the introduction, it is plausible that poverty does affect social relationships, although we cannot reject the possibility that there also might be a reversal effect. Further, neither of the social exclusion indicators is perfect as they do not exhaust the broad notion of ‘social exclusion’. We also lack information on multiple aspects of material deprivation. These limitations should be kept in mind when interpreting the results. They also draw attention to shortcomings to be addressed in future research. In particular, we think that there is considerable potential for using panel or longitudinal data to examine the relationships between material resources and deprivation, and poverty on the one hand and social exclusion/inclusion on the other. Moreover, there is a need to distinguish further between different dimensions and indices of social relationships: for example, different operationalisations of terms such as bonding, bridging and linking.
How do these findings fit into the picture painted by previous research? Allardt (Reference Allardt1975) formulated the ‘social law’ that social and economic dimensions are separate phenomena. Since then, this view has been accepted as more or less common sense. Our dynamic analysis throws some doubt on this ‘law’: we do find a certain negative relationship between poverty and participation in civic organisations but not in social relationships per se. This suggests that it is important to distinguish between different forms of social exclusion, which also signifies access to different types of social resources. On the other hand, exclusion from participation in civic organisations does not vary systematically, either by poverty duration or poverty gradation.
Further, the findings urge us to question the two criteria underlying the official definition of poverty in Norway mentioned in the introduction: the three-year minimum time limit and the 50 per cent below the median requirement. To be officially counted as poor, both criteria have to be met. However, both criteria are arbitrary. The present analysis contributes to confirm this arbitrariness: participation in civic organisations does not increase systematically as poverty severity declines or poverty gradation decreases, as one might expect. Neither are there any signs of thresholds effects. The same applies to poverty gradations: there are no detectable threshold effects and little systematic variation between poverty gradation and inclusion in civic organisations. In other words, if exclusion or inclusion is the main problem with poverty, the official definition of poverty in Norway seems to have little discriminating power. Fløtten (Reference Fløtten2006) analysed different poverty lines with respect to multiple material deprivation. She found a salient linear relationship but no threshold effect of any of the poverty lines she examined. These two pieces of evidence indicate that the official poverty definition in Norway is hard to substantiate. It appears that the poverty definition is more of a political construction than an empirically verified entity.
The notion of social capital has attracted much attention from researchers and policy makers over the last decade, in Norway as elsewhere (Norwegian Research Council, 2005). Two key features of this concept may be distinguished: social capital as bridging and social capital as bonding. Our results show that poor people are not worse off with regard to the bonding dimension: that is, by being embedded in intimate and personal relationships. This may indicate that the poor's social and psychological needs may be met to the same degree as those of the non-poor. However, theories of social capital assume that, as a means to prosper and to get ahead in life, bridging relationships or ‘weak ties’ are essential. It is the bridging part of social capital that is essential to enhance poor people's prospects of escaping poverty and enable them to succeed in the labour market (Field, Reference Field2003). Current social and welfare policy in Europe as well as in Norway puts a heavy emphasis on activation policy and work. Our findings suggest that anti-poverty policies should be more sensitive to the fact that what poor people need, in addition to other resources, is bridging social capital. The chief means in Norway to fight poverty, social exclusion and long-term receipt of social assistance are active labour market programmes. At best these programmes help build individual resources such as job skills and qualifications. These resources are important in a late modern labour market, but might not be sufficient.
Appendix Tables
Percentages (numbers) of poor according to duration patterns and income gradations. Percentage base = 5105

Background characteristics of the previously poor, 50, 60 and 70 per cent of median income

Background characteristics of the recently poor, 50, 60 and 70 per cent of median income

Background characteristics of the recurrent poor, 50, 60 and 70 per cent of median income

Background characteristics of the permanent poor, 50, 60 and 70 per cent of median income

Acknowledgements
We are grateful for the insightful and constructive comments made by Theo Papadopolous, University of Bath, and also participants at the RC19 meeting in Chicago in September 2005. We would also like to thank the two anonymous referees of this journal for thorough, critical and constructive remarks. Thanks are also due to Statistics Norway and The Norwegian Social Science Data Services for providing the data. None of these institutions is responsible for the use of these data or for our interpretations of the findings.