NOMENCLATURE
- A
ray tube area
- A(x)
Mach plane cross sectional area
-
 $A_e $
equivalent area
-
$A_v\left(x,\theta \right) $
longitudinal area distribution
-
$a_0 $
ambient sound speed
-
$c_n $
speed that a wave propagates normal to itself
-
$C_D $
total drag coefficient
-
$C_{D_{wave}} $
wave drag coefficient
-
$C_{D_{LV}} $
induced drag coefficient
-
$C_{D_F} $
skin friction and form drag coefficient
-
$C_F $
skin friction coefficient
- FF
form factor
- l
overall aircraft length
-
$L(x,\theta ) $
lift on a spanwise strip per unit chordwise length
- M
Mach number
-
$S_{ref} $
reference area
-
$S_{wet}$
wet area
- dt
time step
-
$p_0 $
ambient pressure
-
$m_i $
slope of waveform segment I
-
${\triangle p}_i $
pressure rise across shock at the junction of waveform segments i and i-1
-
$\theta $
angle between the Y-axis and a projection onto the Y-Z plane of a normal to the Mach plane
-
$\gamma $
ratio of specific heat
-
$\rho $
air density
-
${\lambda }_i $
time duration of waveform segment i


1.0 INTRODUCTION
The supersonic business jet (SSBJ) is regarded as the pioneer of the next generation supersonic transport(Reference Smith1,Reference Sun and Smith2) . The sonic boom and aerodynamic efficiency are the biggest concerns for the return of the civil supersonic transport. There has been a renewed, worldwide interest in developing an environmentally friendly, economically viable and technologically feasible supersonic transport aircraft. NASA is working on the experimental Quiet Supersonic Technology X-plane (X-59 QueSST(3) to support the potential change in FAA regulations for supersonic flight over land. BOOM Technology is developing a 55-seat supersonic passenger airliner(4) with a technology demonstrator XB-1. JAXA is conducting experiments to help develop its next-generation supersonic airliner(Reference Sakata5). Aerion Supersonic has been updating its supersonic natural laminar flow SSBJ concept(Reference Supersonic6) to get a higher cruise efficiency. Spike Aerospace is developing a low-boom SSBJ concept(7) with innovative digital cabin for a better structural solution. The HyperMach(8) developed a supersonic concept SonicStar flying at Mach 3.6 and a hypersonic business jet concept flying at Mach 5.0. At Cranfield University, the E-5 Neutrino SSBJ concept was developed by 15 academic staff and team of 30 students over a period of seven months. The scope of this study is to provide a complete review of the issue related to the design of supersonic business jets – the E-5 being a focal case study(Reference Stocking9,Reference Smith10) .
Yoshimoto and Uchiyama(Reference Yoshimoto and Uchiyama11) studied the effect of canard position on sonic boom. Le et al.(Reference Le and Li12) proposed a method for low-boom low-drag SSBJ concept design, but it is only for the wing geometry design. The supersonic natural laminar flow (SNLF) concept(Reference Kroo, Tracy, Chase and Sturdza13,Reference Sturdza14) shows promising results in friction drag reduction. There is a lack of study on the sonic boom characteristics of this configuration. The wing morphing configuration balances the aerodynamic performance of subsonic and supersonic regimes. However there are still many technical challenges on the structure design, mechanical system design and certification(Reference Simmons and Freund15). Wataru and Kazuhiro(Reference Yamazaki and Kusunose16) studied the aerodynamic and sonic boom performance of six biplane twin fuselage configurations. A noticeable NASA research(Reference Hunton, Hicks and Mendoza17) studied 12 different wing-body configurations and they found that different wing configurations have quite different sonic boom performance. However, this research did not distinguish the effects of volume distribution and lift distribution.
In this research, we select four business-class concepts the Aerion AS-2, the Spike S-512, the HyperMach SonicStar, and the Cranfield University E-5 SSBJ, plus the BOOM airliner and the NASA X-59 QueSST, to evaluate their sonic boom and aerodynamic performance. The research is conducted in a multidisciplinary design analysis optimisation (MDAO) environment called GENUS(Reference Smith, Sziroczák, Abbe and Okonkwo18). In the previous studies, the authors have established the multidisciplinary methodologies for supersonic transport(Reference Sun and Smith19), evaluated the sonic boom and aerodynamics of three different classes supersonic transport(Reference Sun and Smith20,Reference Sun and Smith21) , and optimised a baseline configuration for low-boom and low-drag objectives(Reference Sun and Smith21). This paper aims to evaluate the aerodynamics and sonic boom of six business-class configurations quantitatively and find out low-boom and low-drag design solutions.
In the following section, the aerodynamic analysis methods are introduced. Section 3 describes the near-field pressure calculation method for sonic boom calculation. Section 4 shows the atmosphere model and the sonic boom propagation method. Section 5 compares the aerodynamic analysis results with Concorde data and compares the sonic boom propagation method to NASA PCBoom. The SSBJ concepts are built and studied in an MDAO environment in section 6. Section 7 concludes some low-boom low-drag design principles. The last section discusses the conclusions and future work.
2.0 AERODYNAMIC ANALYSIS
The main aerodynamic analysis tool is PANAIR(Reference Saaris, Tinoco, Lee and Rubbert22), which can predict inviscid subsonic and supersonic flows of arbitrary configurations by using a high-order panel method to solve linearised partial differential equation. There are several studies(Reference Yuhara, Makino and Rinoie23-Reference Kroo, Willcox, March, Haas, Rajnarayan and Kays25) on supersonic transport applying the PANAIR method and its accuracy is believed to be sufficient for conceptual design. For aerodynamic analysis, PANAIR can provide lift coefficients and induced drag coefficients. Digital DATCOM(Reference Williams and Vukelich26) is a semi-empirical code to calculate the aerodynamic coefficients and stability derivatives. The authors have introduce the approach to integrating PANAIR and digital DATCOM into the MDAO environment in another paper(Reference Sun and Smith19). The drag elements for supersonic flight consist of zero lift drag, wave drag, and induced drag, as accumulated in Equation (1).
 \begin{equation}
C_D=C_{D_F}+C_{D_{wave}}+C_{D_{LV}}
\label{eqn1}
\end{equation}
2.1 Friction drag
The form factor method(Reference Gur, Mason and Schetz27) is integrated to calculate the zero-lift skin friction and form drag. The result comes from the contribution of each element, as shown in Equation (2)
 \begin{equation}
C_{D_F}=\sum\nolimits^N_{j=1}{\frac{{FF}_jC_{F_j}S_{{wet}_j}}{S_{ref}}}
\label{eqn2}
\end{equation}
where N is the number of elements used to model the configuration, FF is the form factor,
 $C_F$
is the skin friction factor,
 $S_{wet}$
is the wing wet area,
 $S_{ref}$
is the wing reference area.
2.2 Wave drag due to volume
A wave drag computing method(Reference Harris28) based on the supersonic area rule is applied to calculate wave drag due to volume, as indicated in Equations (3) and (4). The cross section area calculation on Mach plane at different angles and positions are based on the parametric geometric model.
 \begin{equation}
{C_D}_{wave}\left(\theta \right)=-\frac{1}{2\pi }\int^l_0{\int^l_0}{\rm A}_v''({{\theta ,x_{1}}}){{\rm A}}_v''(\theta, x_{2}){\ln \left|x_{1}-x_{2}\right|\ }{\rm d}x_{1}{\rm d}x_{2}\\[6pt]
\label{eqn3}
\end{equation}
 \begin{equation}
{C_D}_{wave}=\frac{1}{2\pi }\int^{2\pi }_0{{C_D}_{wave}\left(\theta \right)d\theta }
\label{eqn4}
\end{equation}
where
 $\theta $
is the angle between the Y-axis and a projection onto the Y-Z plane of a normal to the Mach plane,
 $A''_v(\theta ,x)$
is the second derivative of longitudinal area distribution,
 $x_1$
and
 $x_2$
are positions along longitudinal axis.
3.0 NEAR-FIELD PRESSURE PREDICTION
This section introduces the Whitham theory(Reference Whitham29) used for the near-field pressure calculation. The Whitham theory is the basic theory for sonic boom prediction(Reference Cain30). The equivalent area due to volume and equivalent area due to lift are required for the near-field pressure calculation.
A lower fidelity approach is to use the normal areas A(x) for the equivalent area due to volume and use the wing platform area distribution B(x) for the equivalent area due to lift. The total effective area
 $A_e(x)$
is obtained through Equation (5). This approach is applied by the Carlson Simplified Sonic Boom Prediction method(Reference Carlson31).
 \begin{equation}
A_e(x)=A(x)+B(x)=k_{1}x+k_{2}x^{2}
\label{eqn5}
\end{equation}
A higher fidelity approach is to calculate the cross sectional areas on Mach planes. This is a complex calculation based on the parametric geometry model. The lift distribution comes from the PANAIR sectional properties, which give the lift coefficient on each cut. This approach is the basis of the waveform parametric method(Reference Thomas32). The equation for the total effective area calculation is indicated in Equation (6).
 \begin{equation}
A_e\left(x,\theta \right)=A_v\left(x,\theta \right)+\frac{\beta }{2q_{\infty }}\int^x_0{L(x,\theta )dx}
\label{eqn6}
\end{equation}
where compressor factor
 $\beta =\sqrt{M^2-1}$
,
 $q_{\infty }$
is the ambient dynamic pressure,
 $L(x,\theta )$
is the lift on a spanwise strip per unit chordwise length.
The F-function derives from the equivalent area, as shown in Equation (7). In this research, we decompose the F-function to F-function due to volume and F-function due to lift, as indicated by Equation (8). The purpose of this is to study the separate effects on sonic boom intensity. The near-field pressure is then calculated based on the Whitham theory, which is based on the concept that linear theory provides the correct first order values, as shown in Equation (9).
 \begin{equation}
F(x)=\frac{1}{2\pi }\int^x_0{\frac{A^{{\rm ''}}_e(\overline{x},\theta )}{\sqrt{x-\overline{x}}}d\overline{x}}\\
\label{eqn7}
\end{equation}
 \begin{equation}
F\left(x,\theta \right)=F_{volume}(x,\theta )+F_{lift}(x,\theta)= \frac{1}{2\pi }\int^x_0{\frac{A^{''}_v(\overline{x},\theta )}{\sqrt{x-\overline{x}}}d\overline{x}}+\frac{\beta }{4\pi q_{\infty }}\int^x_0{\frac{L^{'}(\overline{x},\theta )}{\sqrt{x-\overline{x}}}d\overline{x}}\\
\label{eqn8}
\end{equation}
 \begin{equation}
\delta p(x)=p_0\frac{\gamma M^{2}F(\chi )}{{\left(2\beta r\right)}^{1/2}}\\
\label{eqn9}
\end{equation}
where
 $\delta p=p-p_0$
, r is radial coordinate,
 $\chi =x-\beta r$
is the location on the axis of the equivalent body of the Mach plane translated field point.
3.1 Area distribution
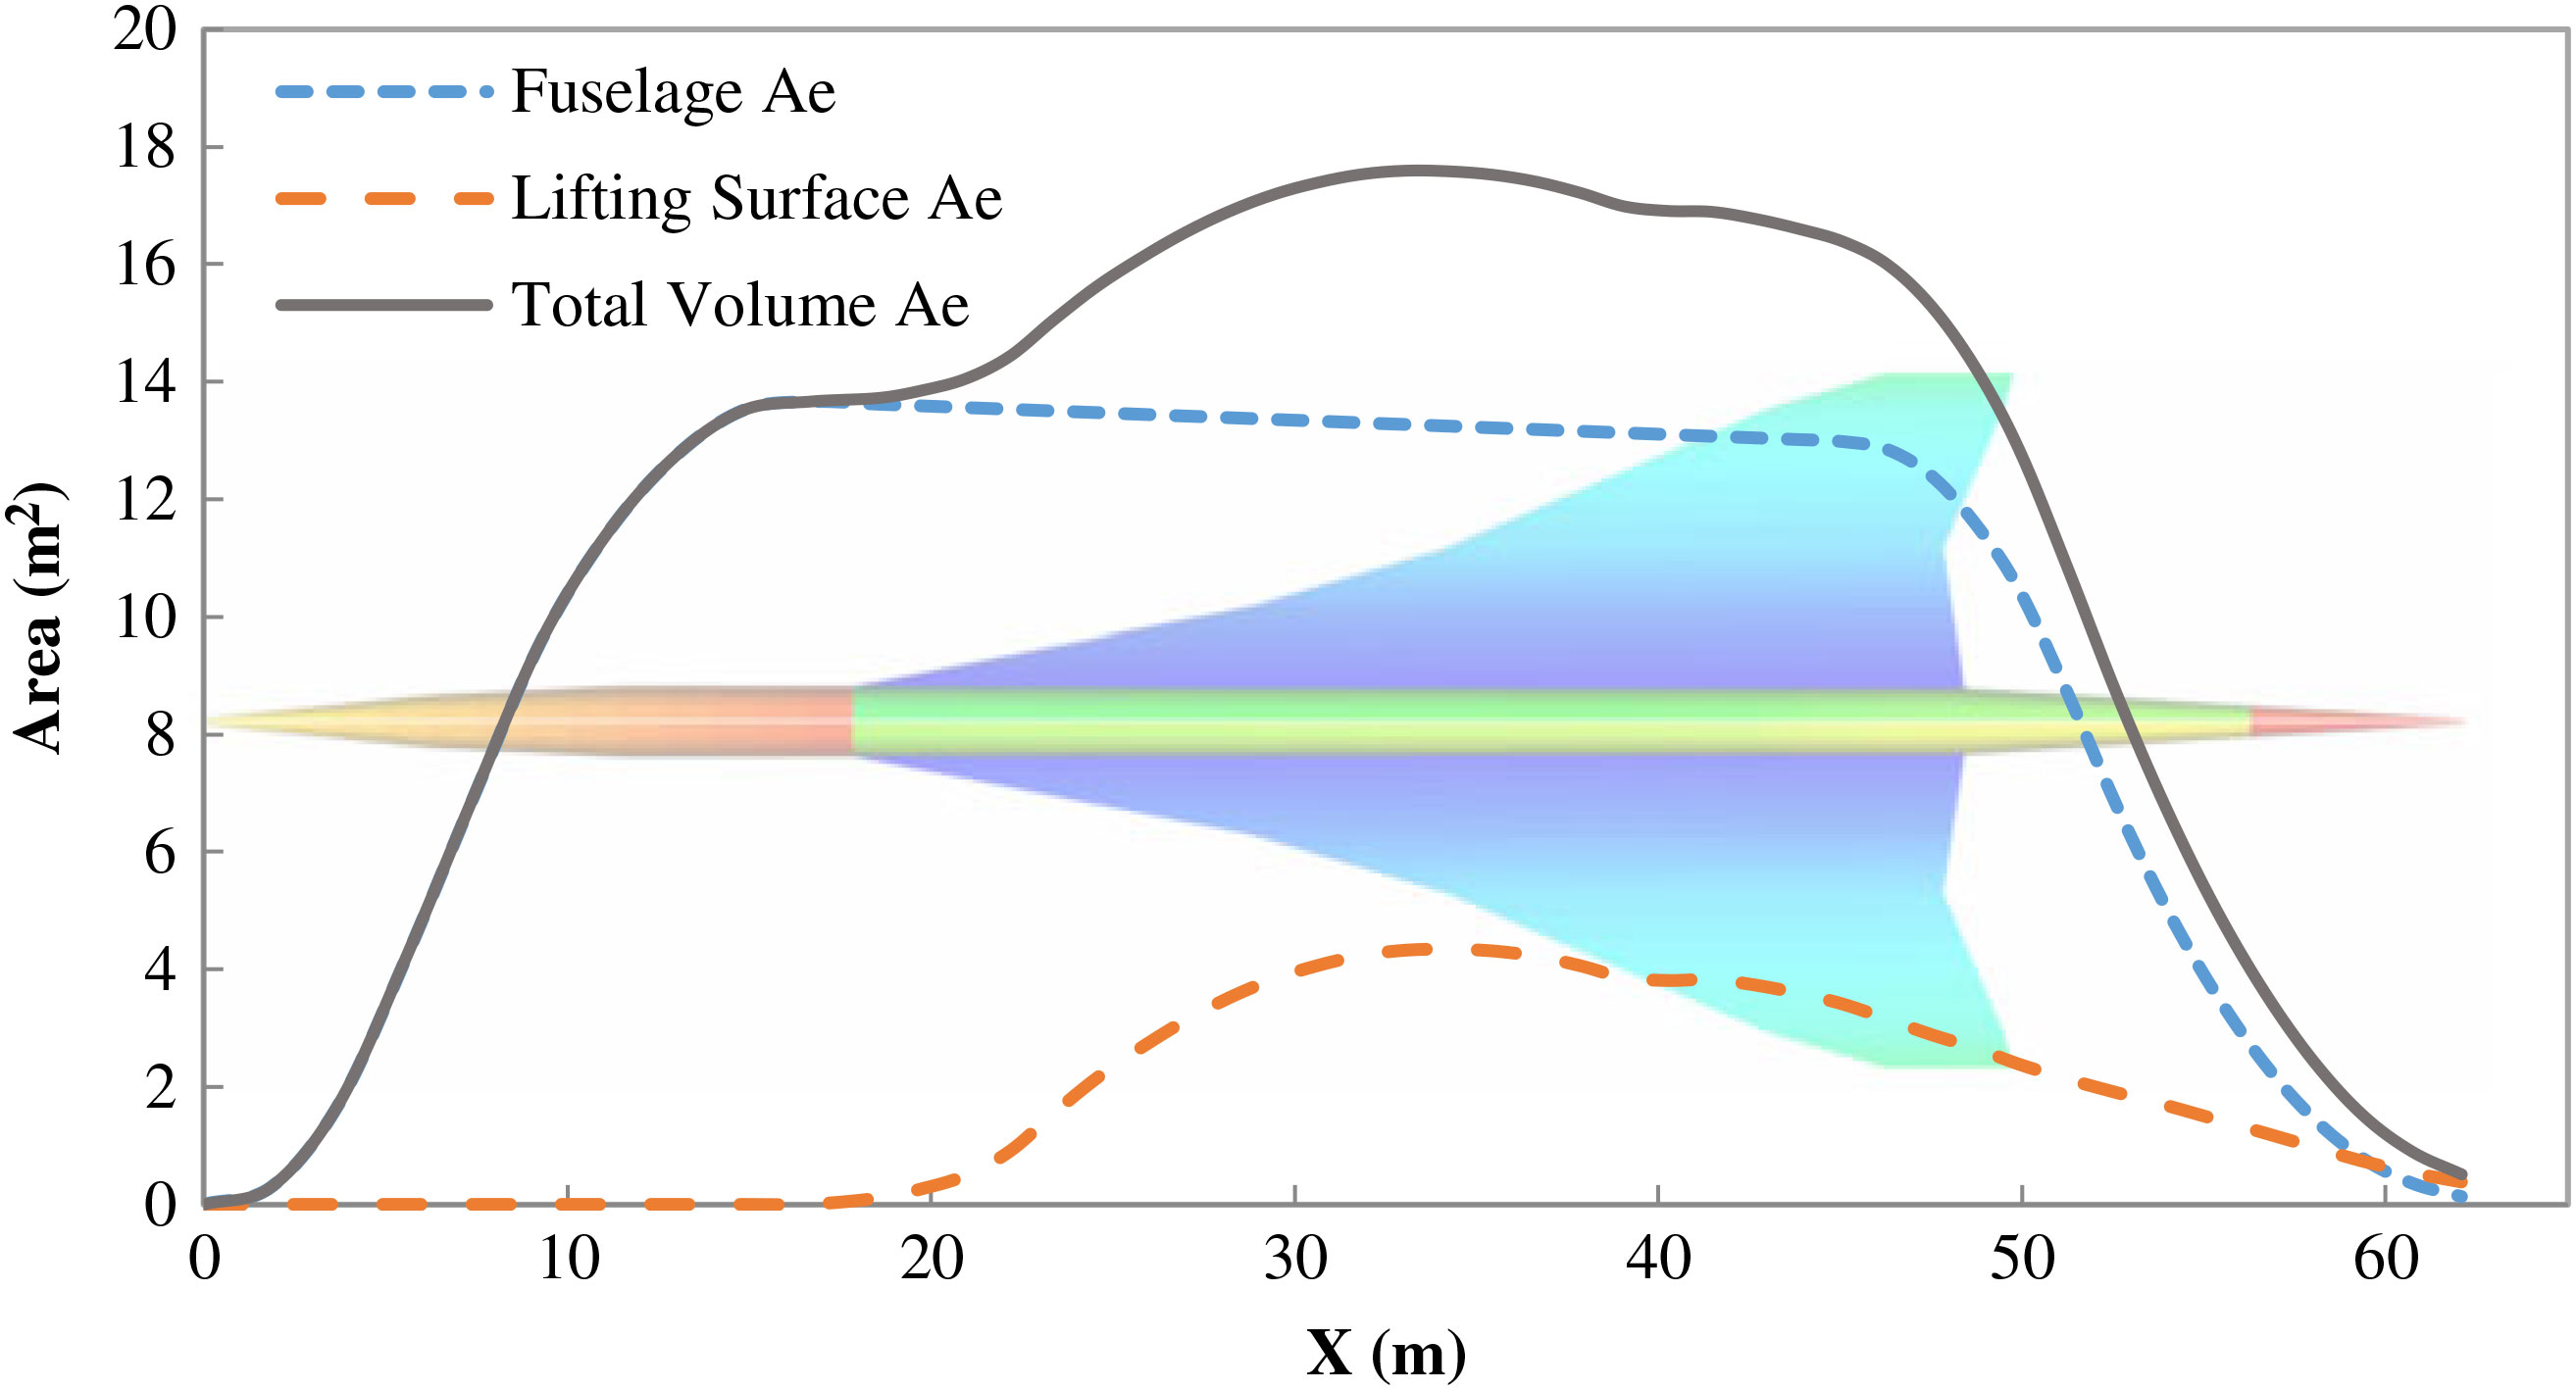
The area distribution comes from the parametric geometric model. Equation (10) gives the Mach plane position
 $x_i$
at angle
 ${\theta }_0$
. The Mach plane cross section distribution is illustrated in Fig. 1.
 \begin{equation}
x_i=x-ycos{\theta }_0\sqrt{M^{2}-1}-zsin{\theta }_0\sqrt{M^{2}-1}
\label{eqn10}
\end{equation}
Concorde Mach plane cross sectional area distributions.

3.2 Lift distribution
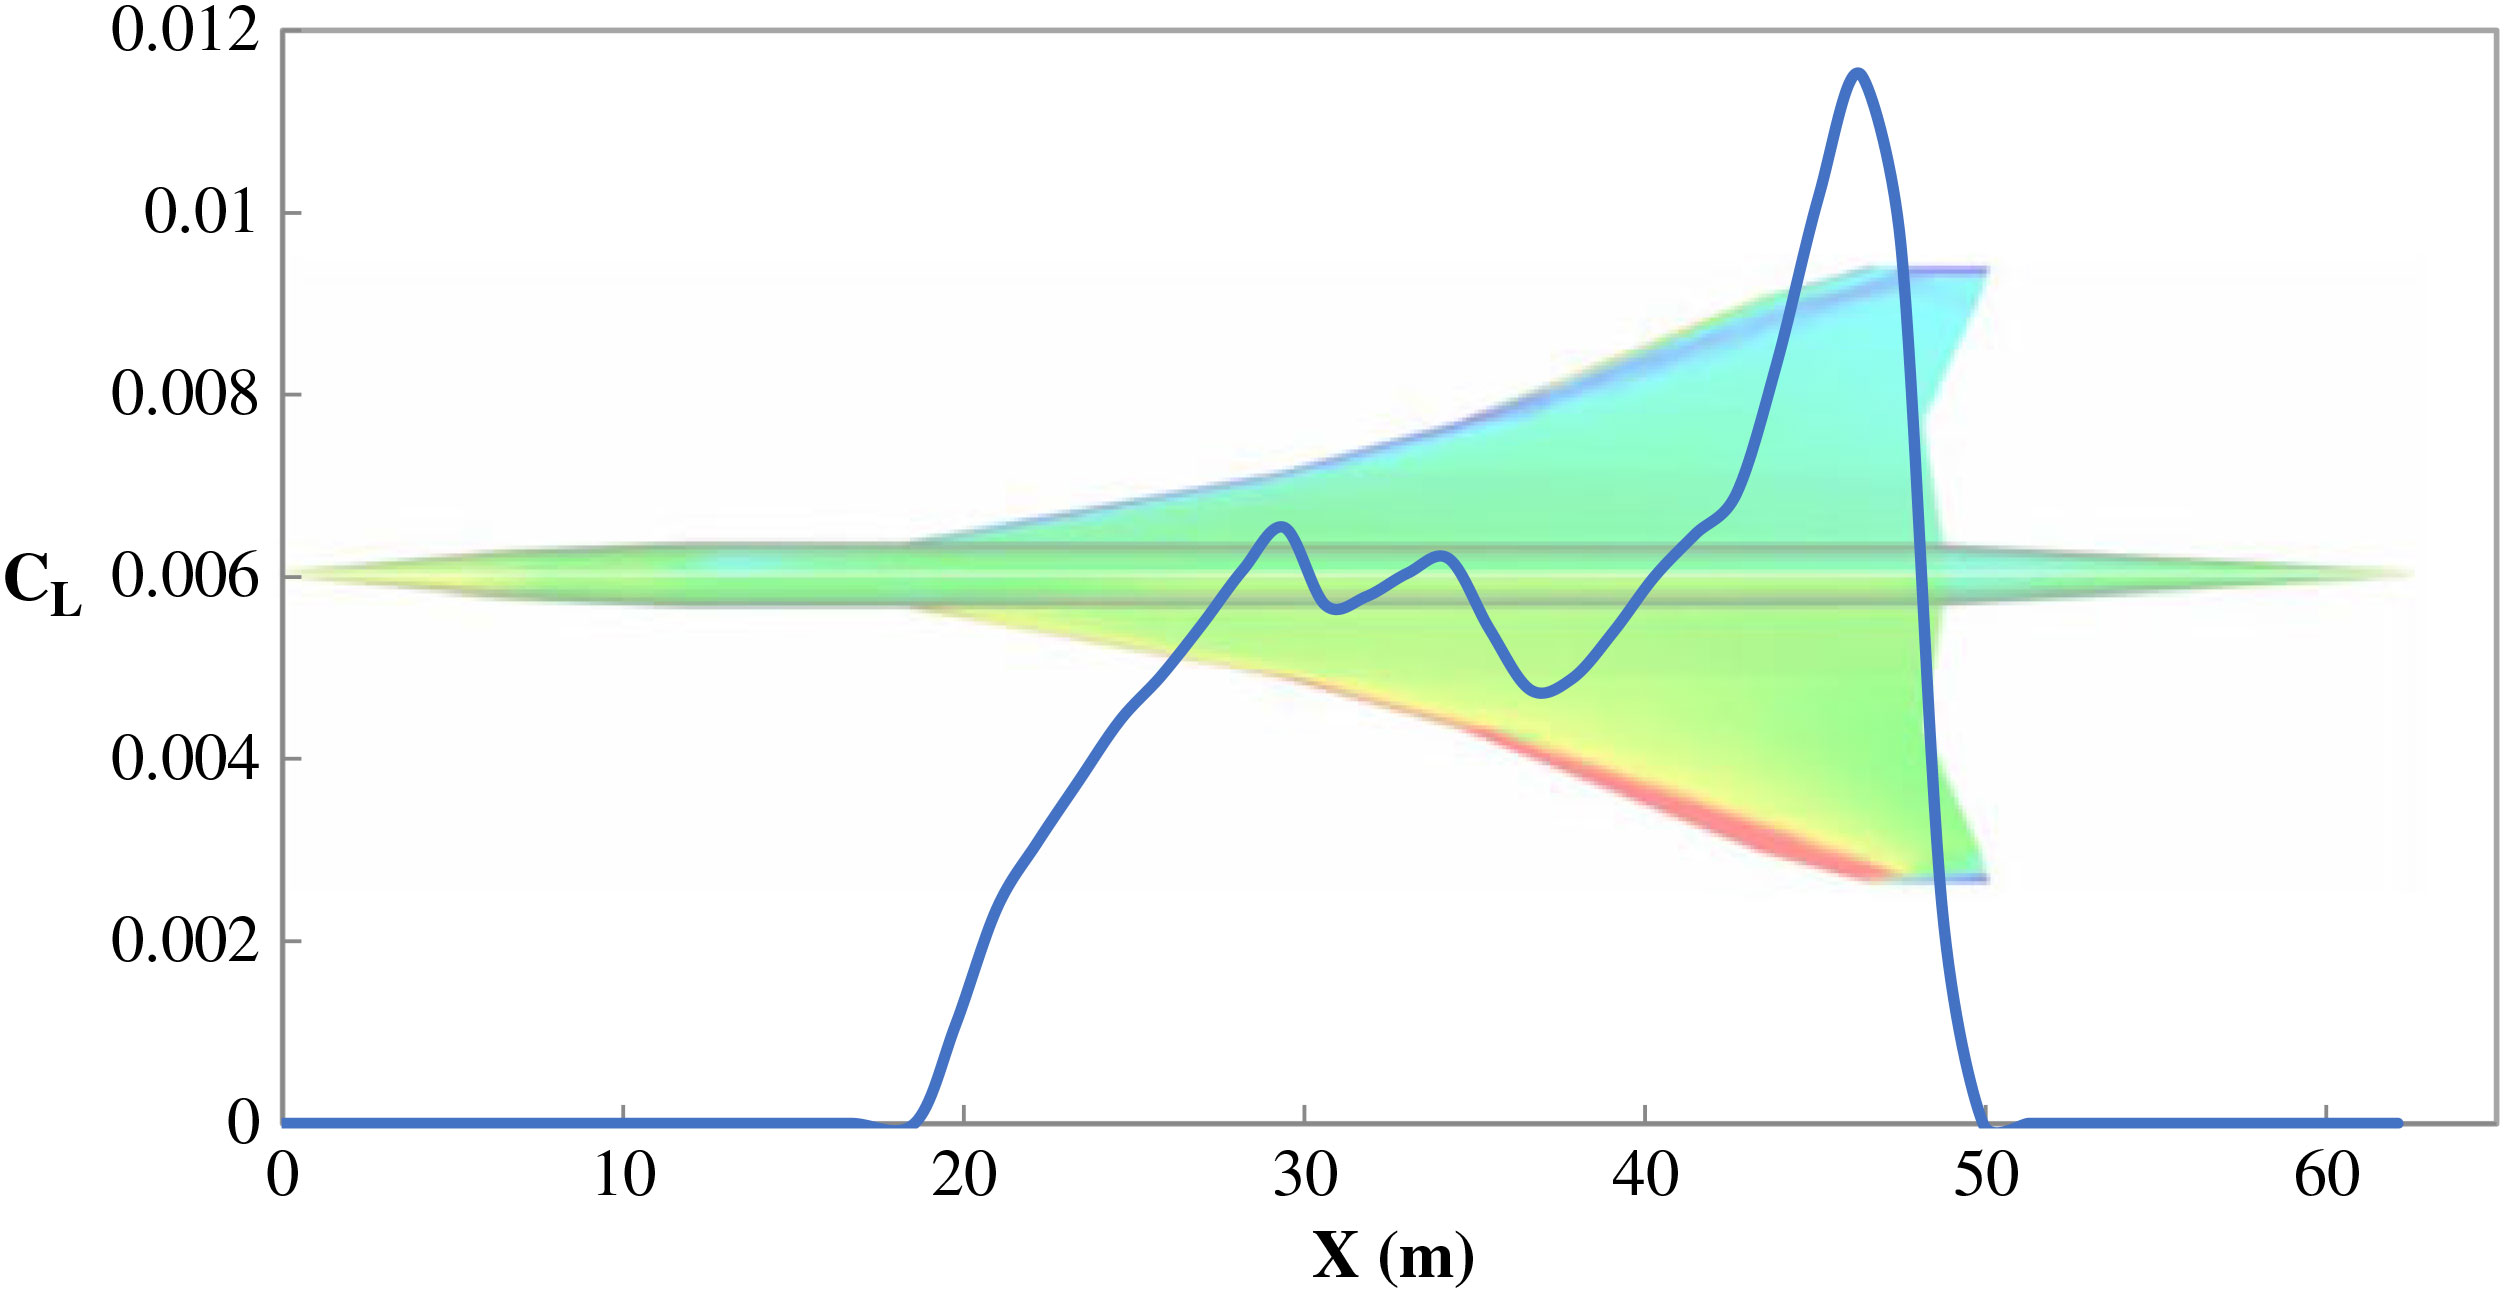
The lift distribution comes from the PANAIR program. The sectional property is utilised to get the lift distribution along the Mach angle direction. An example of Concorde lift distribution is shown in Fig. 2.
Concorde chordwise lift distribution at cruise Mach 2.0.

4.0 SONIC BOOM PROPAGATION
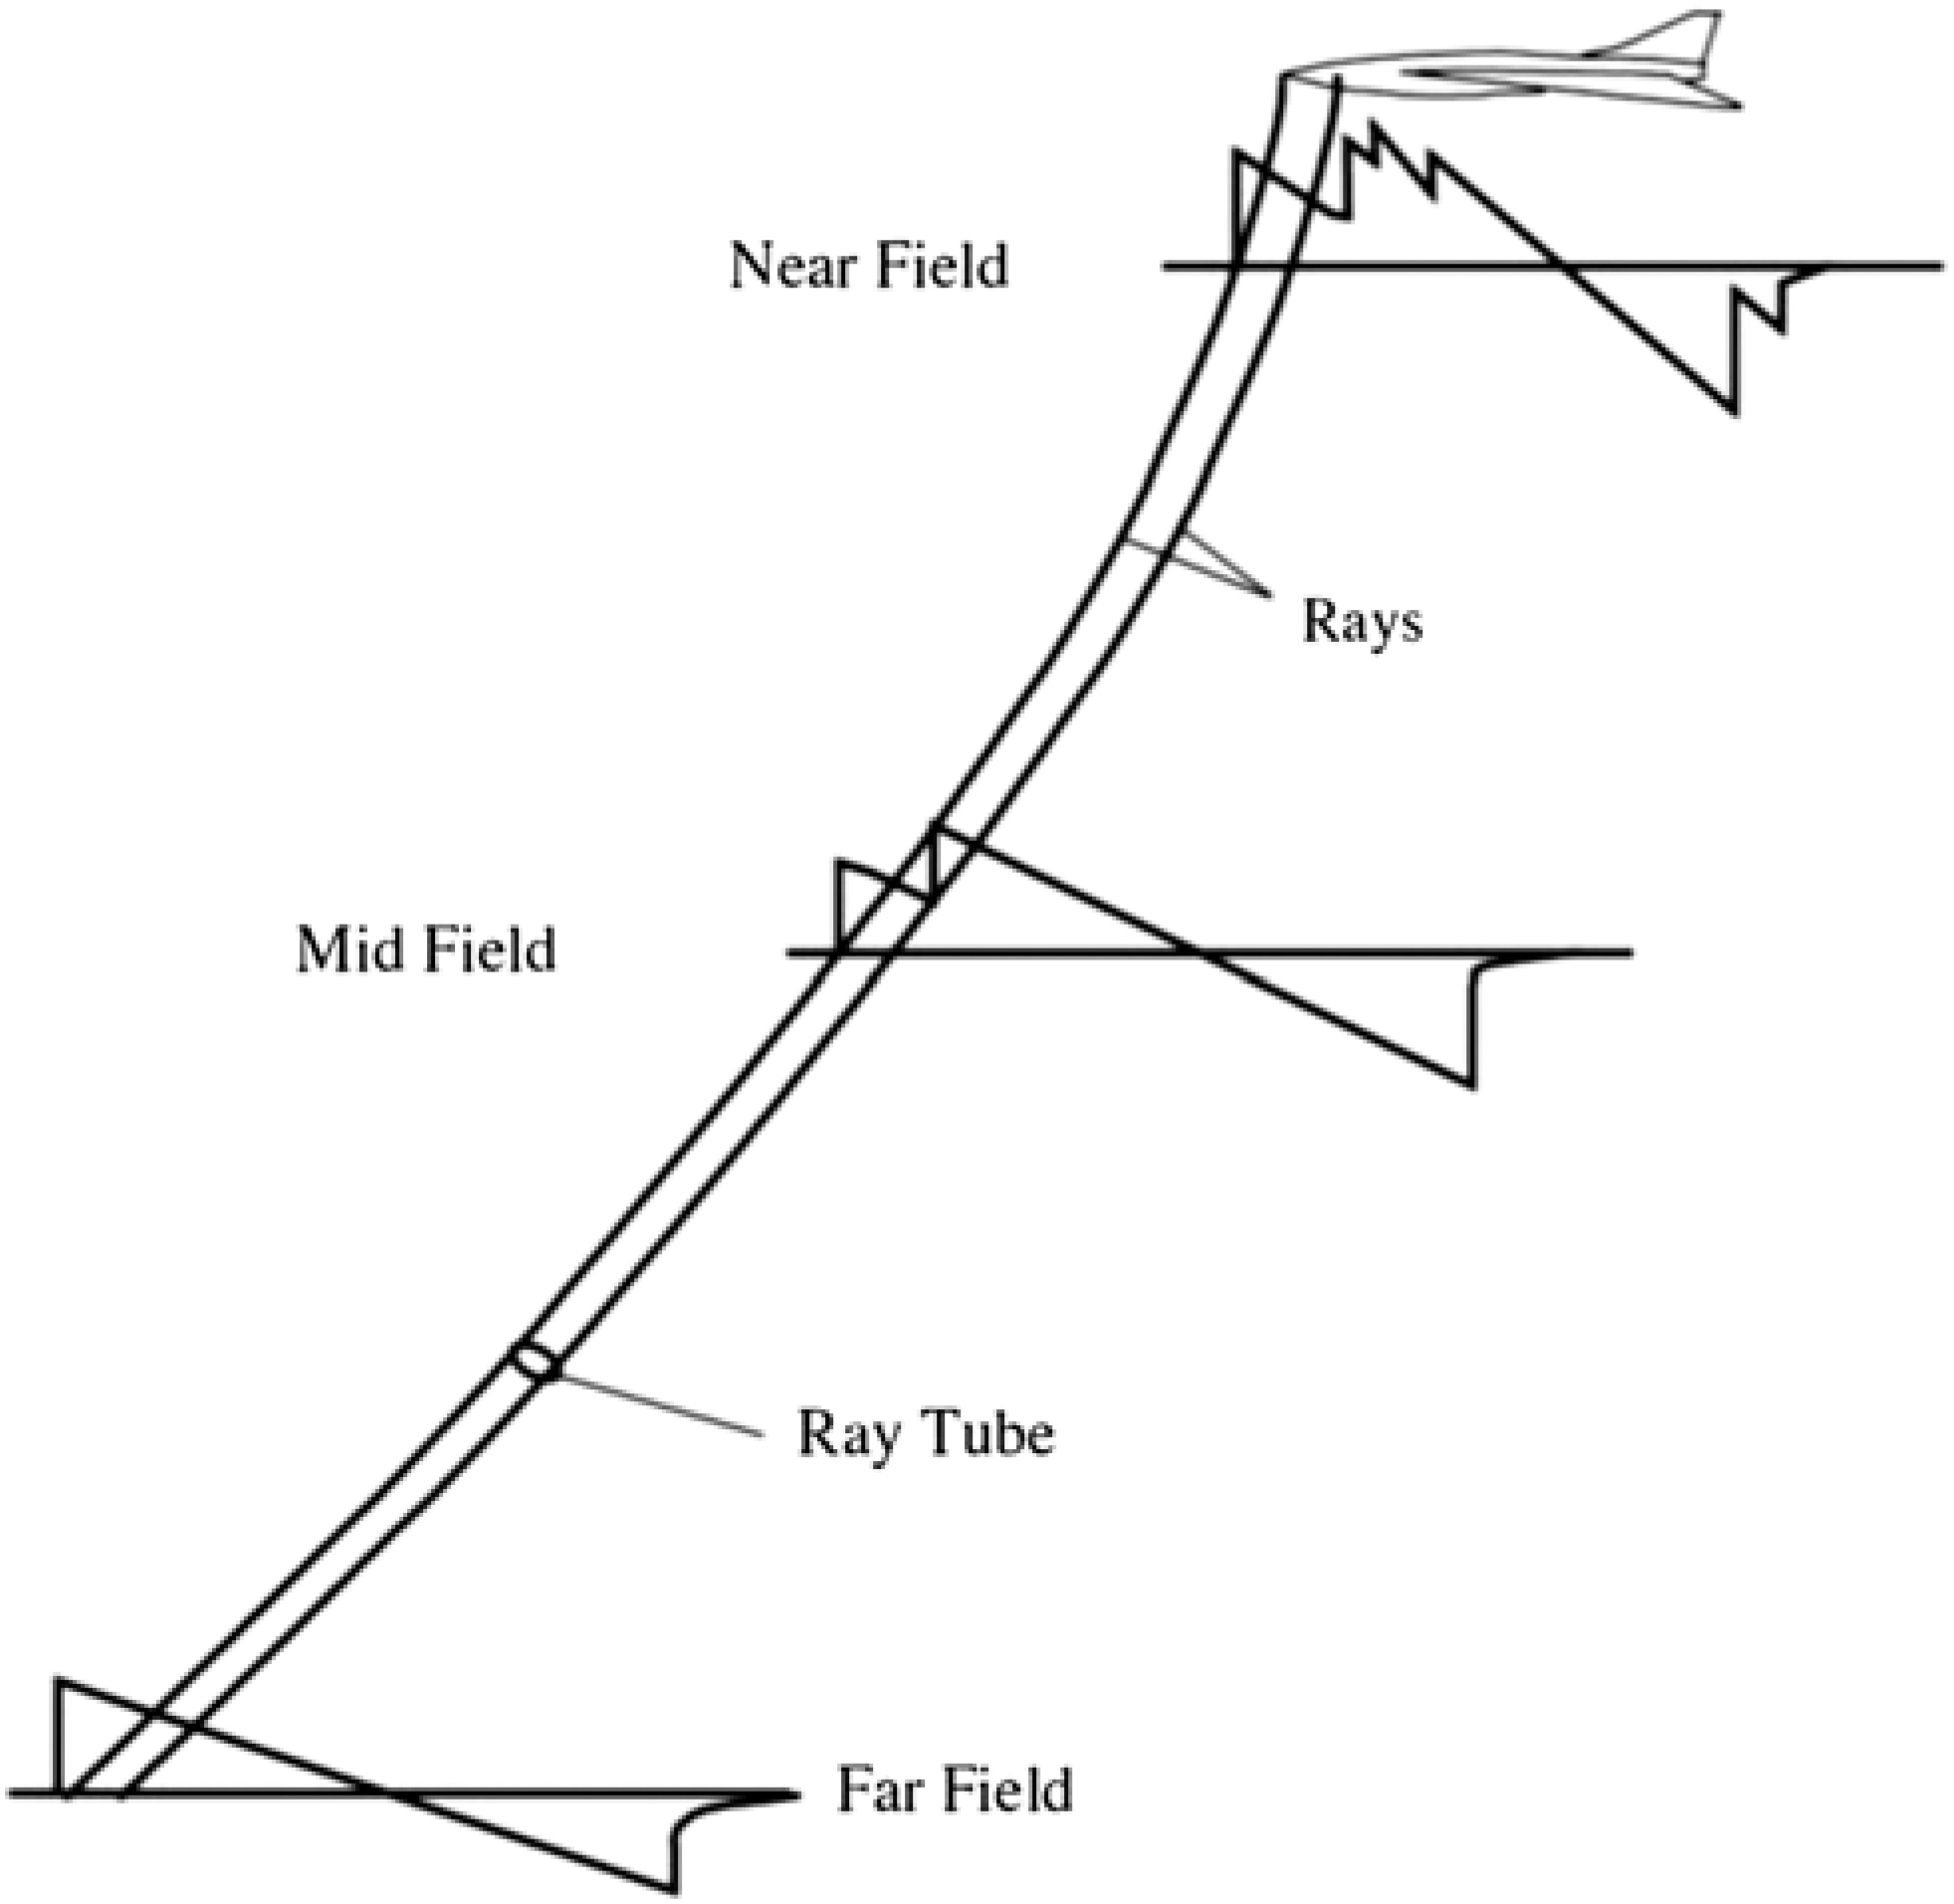
The sonic boom propagation method applied is the waveform parameter method(Reference Thomas32). The sonic boom signature propagates through the real stratified windy atmosphere is depicted in Fig. 3.
Schematic of sonic boom propagation.

4.1 Atmosphere model
The atmosphere model implemented for study is the 1976 US Standard Atmosphere(33). This model divides the atmosphere into layers with an assumption of linear distribution of absolute temperature against geopotential altitude. In this study, the influences of atmosphere on sonic boom propagation are two-folds: the effect of vertical changes of the atmosphere properties and the effect of the horizontal winds. At cut-off Mach number, where the aircraft speed over the ground is less than the speed of sound at the ground, the sonic boom signature will not reach the ground. At the supersonic transport cruise altitude (12 to 18km), the cut-off Mach number is around 1.16.
4.2 Waveform parameter method
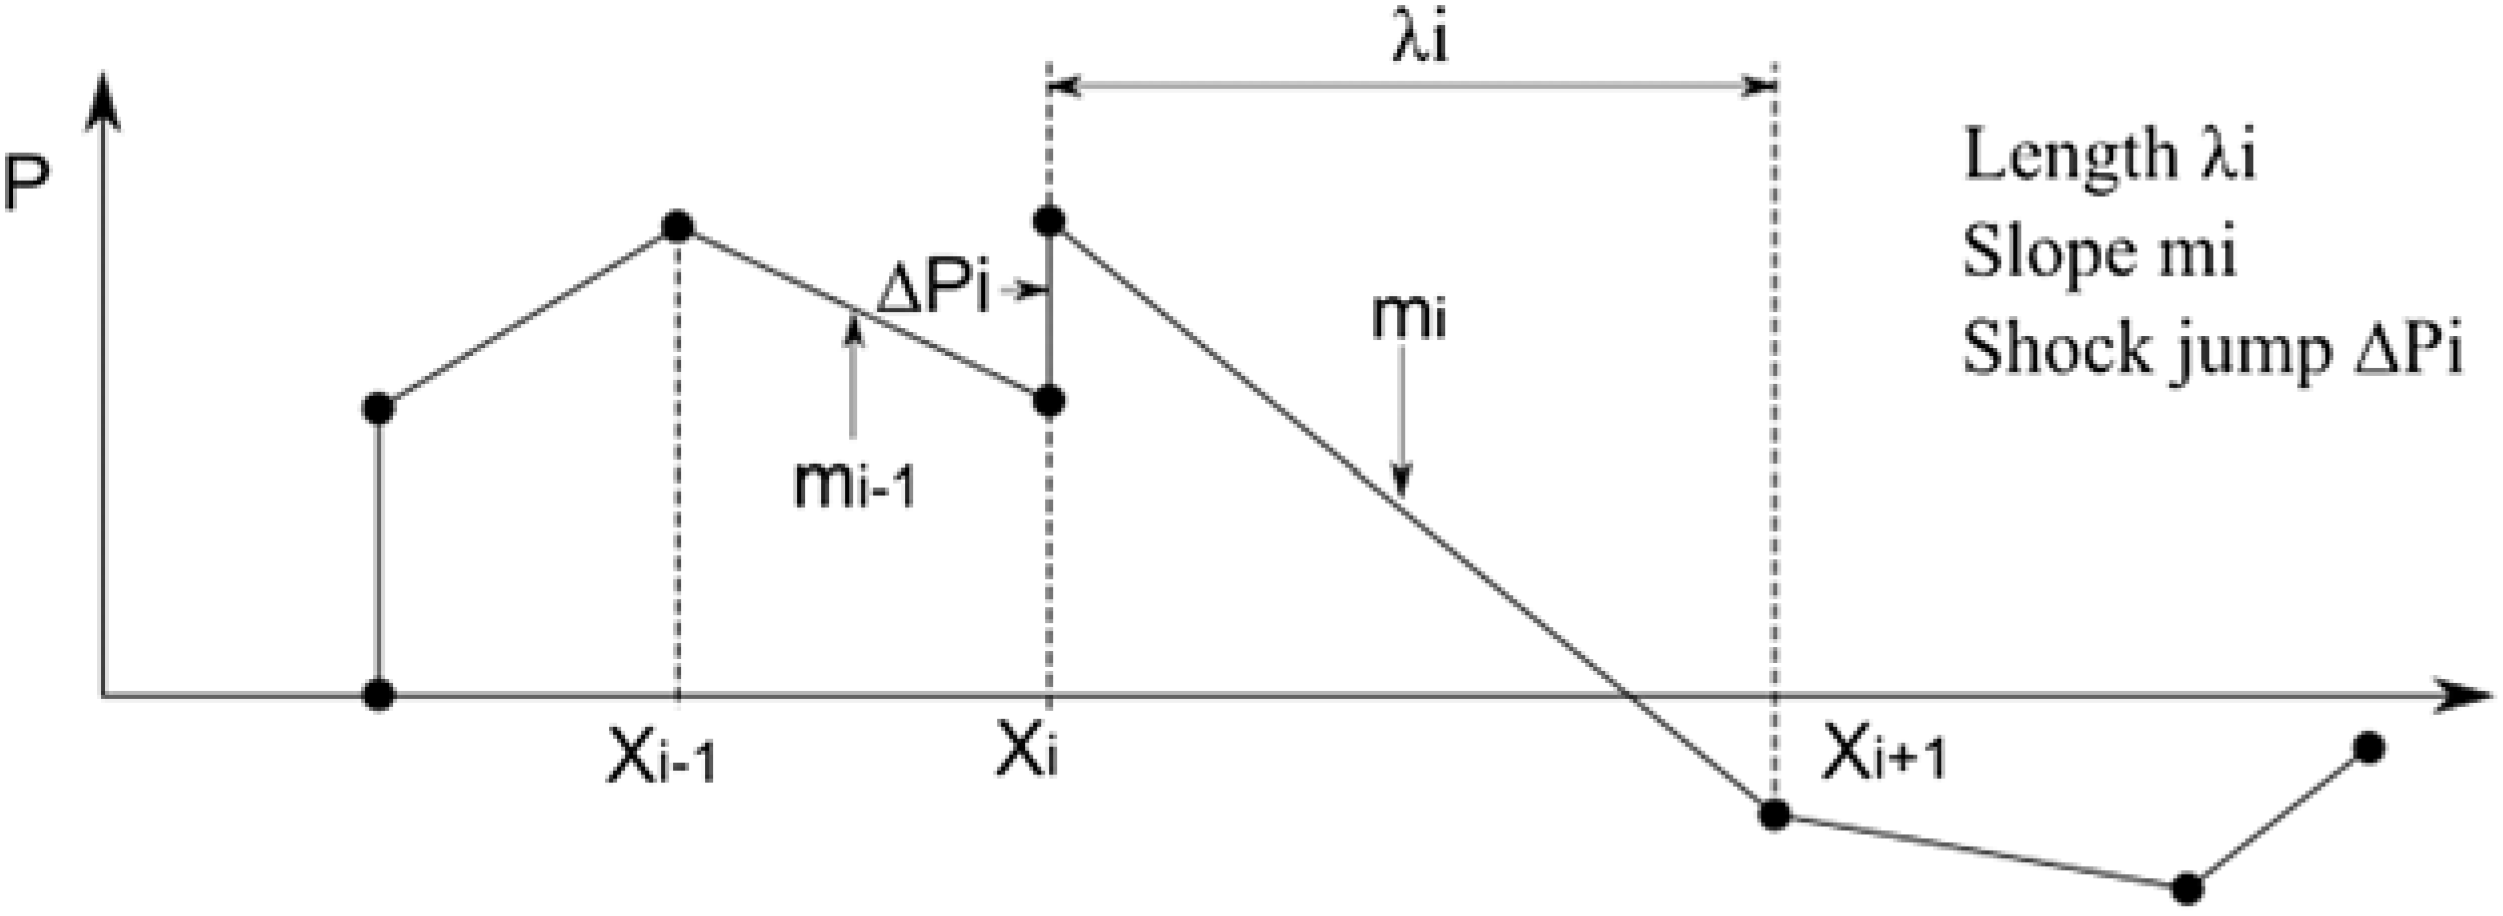
Waveform Parameter method(Reference Thomas32) is based on geometrical acoustics. This method is widely used in sonic boom prediction(Reference Yuhara, Makino and Rinoie23,Reference Ma, Wang, Ren, Ye, Lei and Zha34-Reference Scarselli and Castorini37) . This method is suitable for programming to run automatically. The weakness is it only expect one shock formation at a time and a complex signature would cause a failure of the calculation. The waveform parameters
 ${{\rm m}}_{{\rm i}}$
,
 ${\triangle {\rm p}}_{{\rm i}}$
and
 ${\lambda }_{{\rm i}}$
divide the pressure signature into several segments and shocks, as shown in Fig. 4.
Representation of Sonic Boom Signature by Waveform Parameters.

The waveform parameters are defined in Equations (11)–(13).
 \begin{equation}
m_i=\frac{p_{{\xi }_i}}{T_{{\xi }_i}}\\
\label{eqn11}
\end{equation}
 \begin{equation}
{\triangle p}_i=\sqrt{\frac{{\rho }_0a^{3}_0}{c^{2}_nA}}\triangle F_i\\
\label{eqn12}
\end{equation}
 \begin{equation}
{\lambda }_i=T_{i+1}-T_i\\
\label{eqn13}
\end{equation}
where
 $\xi $
is a variable used to identify the points on a waveform,
 $a_0$
is the ambient sound speed,
 ${\rho }_0$
is the ambient air density
 $c_n$
is speed that a wave propagates normal to itself, A is ray tube area.
The time rate of change of these waveform parameters are the following equations.
 \begin{equation}
\frac{{dm}_i}{dt}=C_{1}m^{2}_i+C_{2}m_i\\
\label{eqn14}
\end{equation}
 \begin{equation}
\frac{{d\triangle p}_i}{dt}=\frac{1}{2}C_{1}{\triangle p}_i\left(m_i+m_{i-1}\right)+C_{2}{\triangle p}_i\\
\label{eqn15}
\end{equation}
 \begin{equation}
\frac{{d\lambda }_i}{dt}=-\frac{1}{2}C_{1}\left({\triangle p}_i+{\triangle p}_{i+1}\right)-C_{1}m_i{\lambda }_i\\
\label{eqn16}
\end{equation}
where
 \begin{equation}
C_{1}=\frac{\gamma +1}{2\gamma }\frac{a_0}{p_0c_n}\\
\label{eqn17}
\end{equation}
 \begin{equation}
C_{2}=\frac{1}{2}\left(\frac{3}{a_0}\frac{da_0}{dt}+\frac{1}{{\rho }_0}\frac{d{\rho }_0}{dt}-\frac{2}{c_n}\frac{dc_n}{dt}-\frac{1}{A}\frac{dA}{dt}\right)
\label{eqn18}
\end{equation}
After the calculation of
 ${{\rm C}}_{1}$
and
 ${{\rm C}}_{2}$
, the ray path needs to be calculated according to Reference(Reference Thomas38). When the ray path is known, the ambient properties can be calculated along the ray path. The ray tube area is then determined according to Reference(Reference Hayes, Haefeli and Kulsrud39).
Equations (14)–(16) can be integrated to get the following solutions.
 \begin{equation}
m_i=\frac{m^0_ie^{C_{2}\triangle t}}{1-C_{1}m^0_iT}\\
\label{eqn19}
\end{equation}
 \begin{equation}
\triangle p_i=\frac{\triangle p^0_ie^{C_{2}\triangle t}}{{\left[\left(1-C_{1}m^0_iT\right)\left(1-C_{1}m^0_{i-1}T\right)\right]}^{1/2}}\\[3pt]
\label{eqn20}
\end{equation}
 \begin{align}
{\lambda }_i&=\left(1-C_{1}m^0_iT\right)\left[{\lambda }^0_i-\frac{\triangle p^0_i}{m^0_i-m^0_{i-1}}\left(\sqrt{\frac{1-C_{1}m^0_{i-1}T}{1-C_{1}m^0_iT}}-1\right)\right.\nonumber\\
&\left.\qquad\qquad\quad\qquad-\frac{\triangle p^0_{i+1}}{m^0_i-m^0_{i+1}}\left(\sqrt{\frac{1-C_{1}m^0_{i +1}T}{1-C_{1}m^0_iT}}-1\right)\right]
\label{eqn21}\end{align}
where
 \begin{equation}
T=\frac{e^{C_2\triangle t}-1}{C_2}
\label{eqn22}
\end{equation}
5.0 VALIDATION OF METHODS
5.1 Aerodynamic results comparison
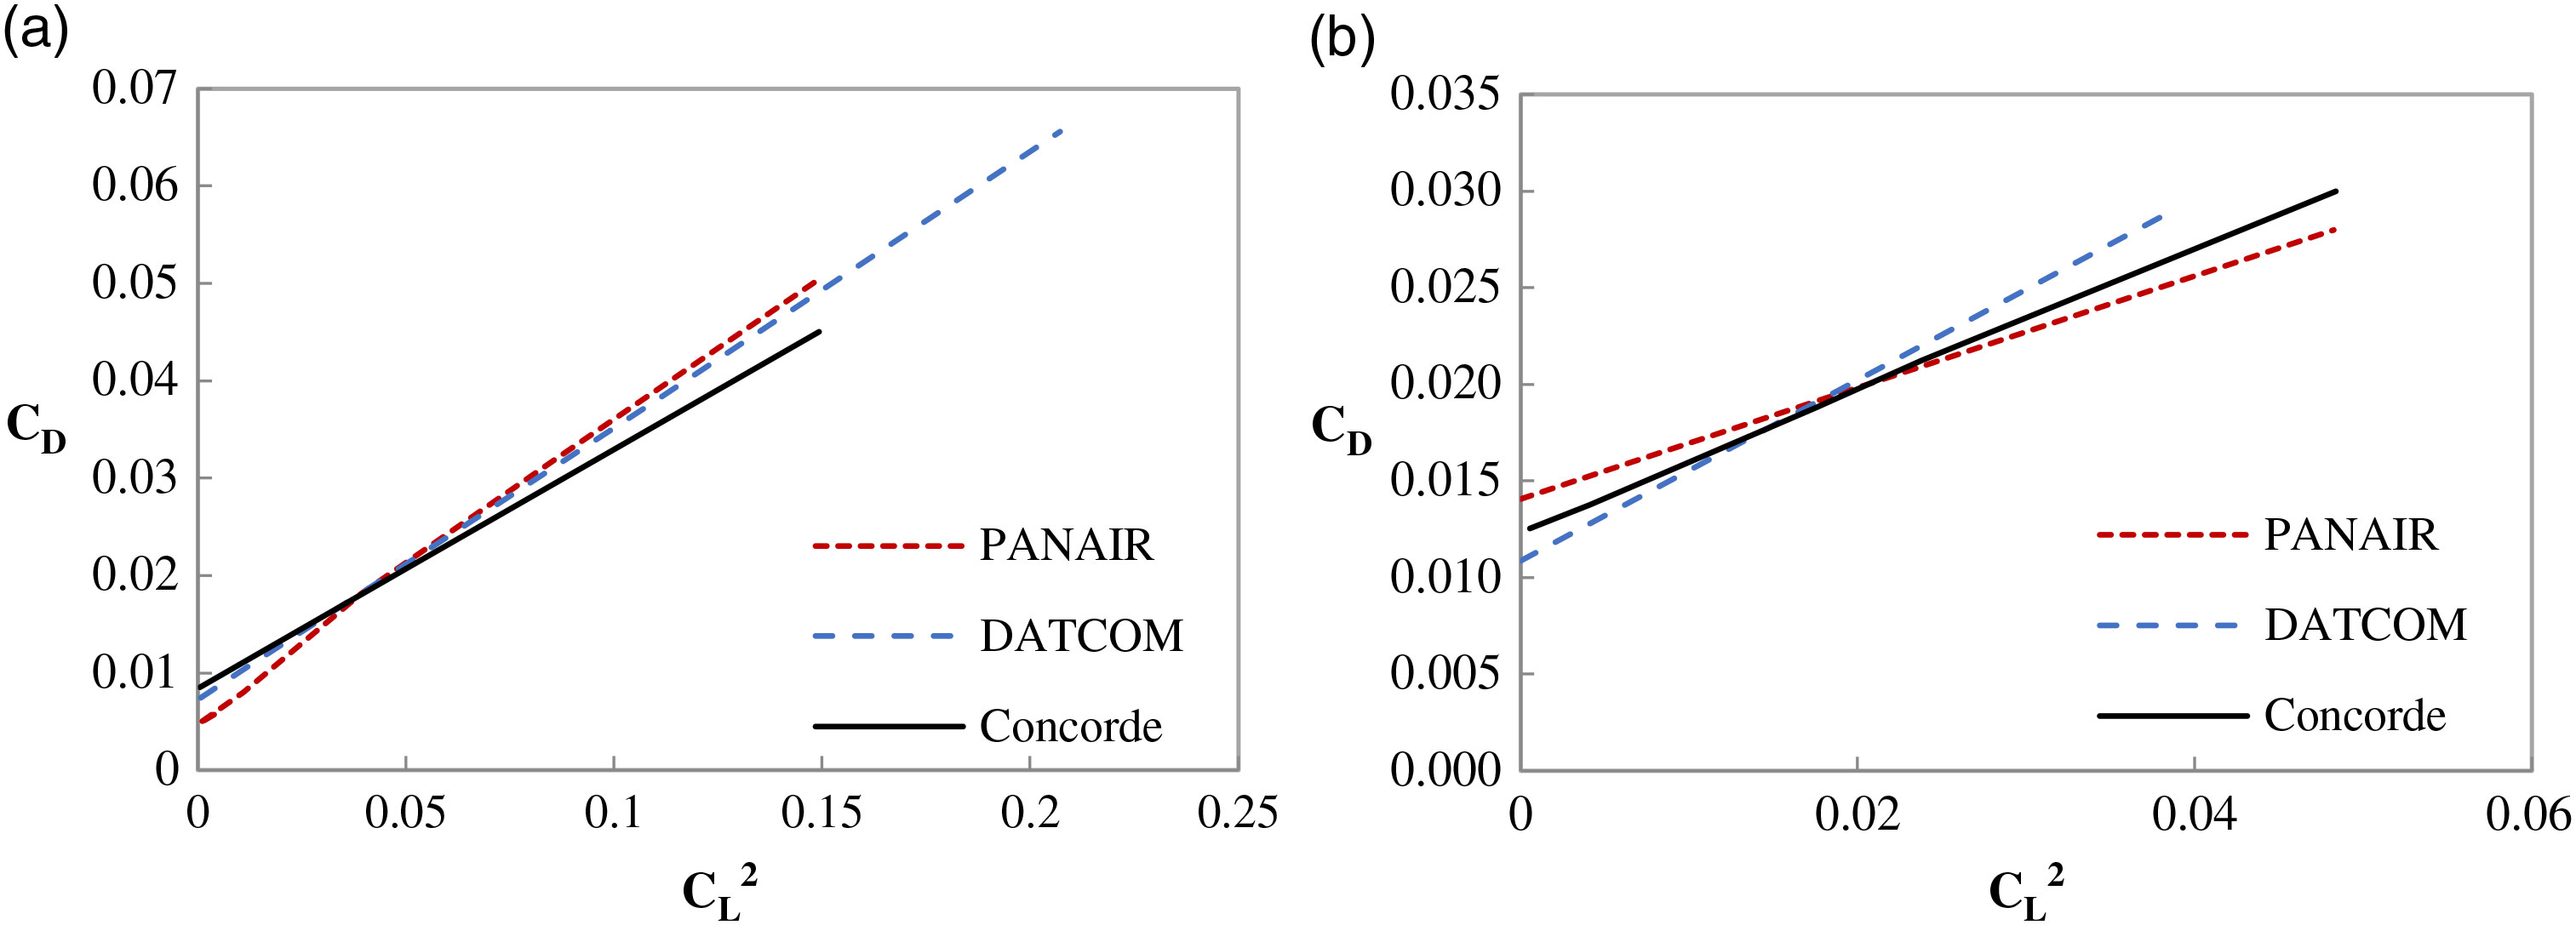
The lift and drag coefficients from GENUS (PANAIR and DATCOM) are compared with the Concorde experimental data(Reference Rech and Leyman40,Reference Orlebar41) at Mach 0.95 and Mach 2.0 respectively. Fig. 5 (a) and (b) indicate that the aerodynamic coefficients from GENUS are close to the results of the experimental data, which helps to validate the methods in GENUS.
Comparison of Concorde aerodynamic coefficients (a) Aerodynamic coefficients at Mach 0.95 and (b) Aerodynamic coefficients at Mach 2.0.

5.2 Comparison to PCBoom
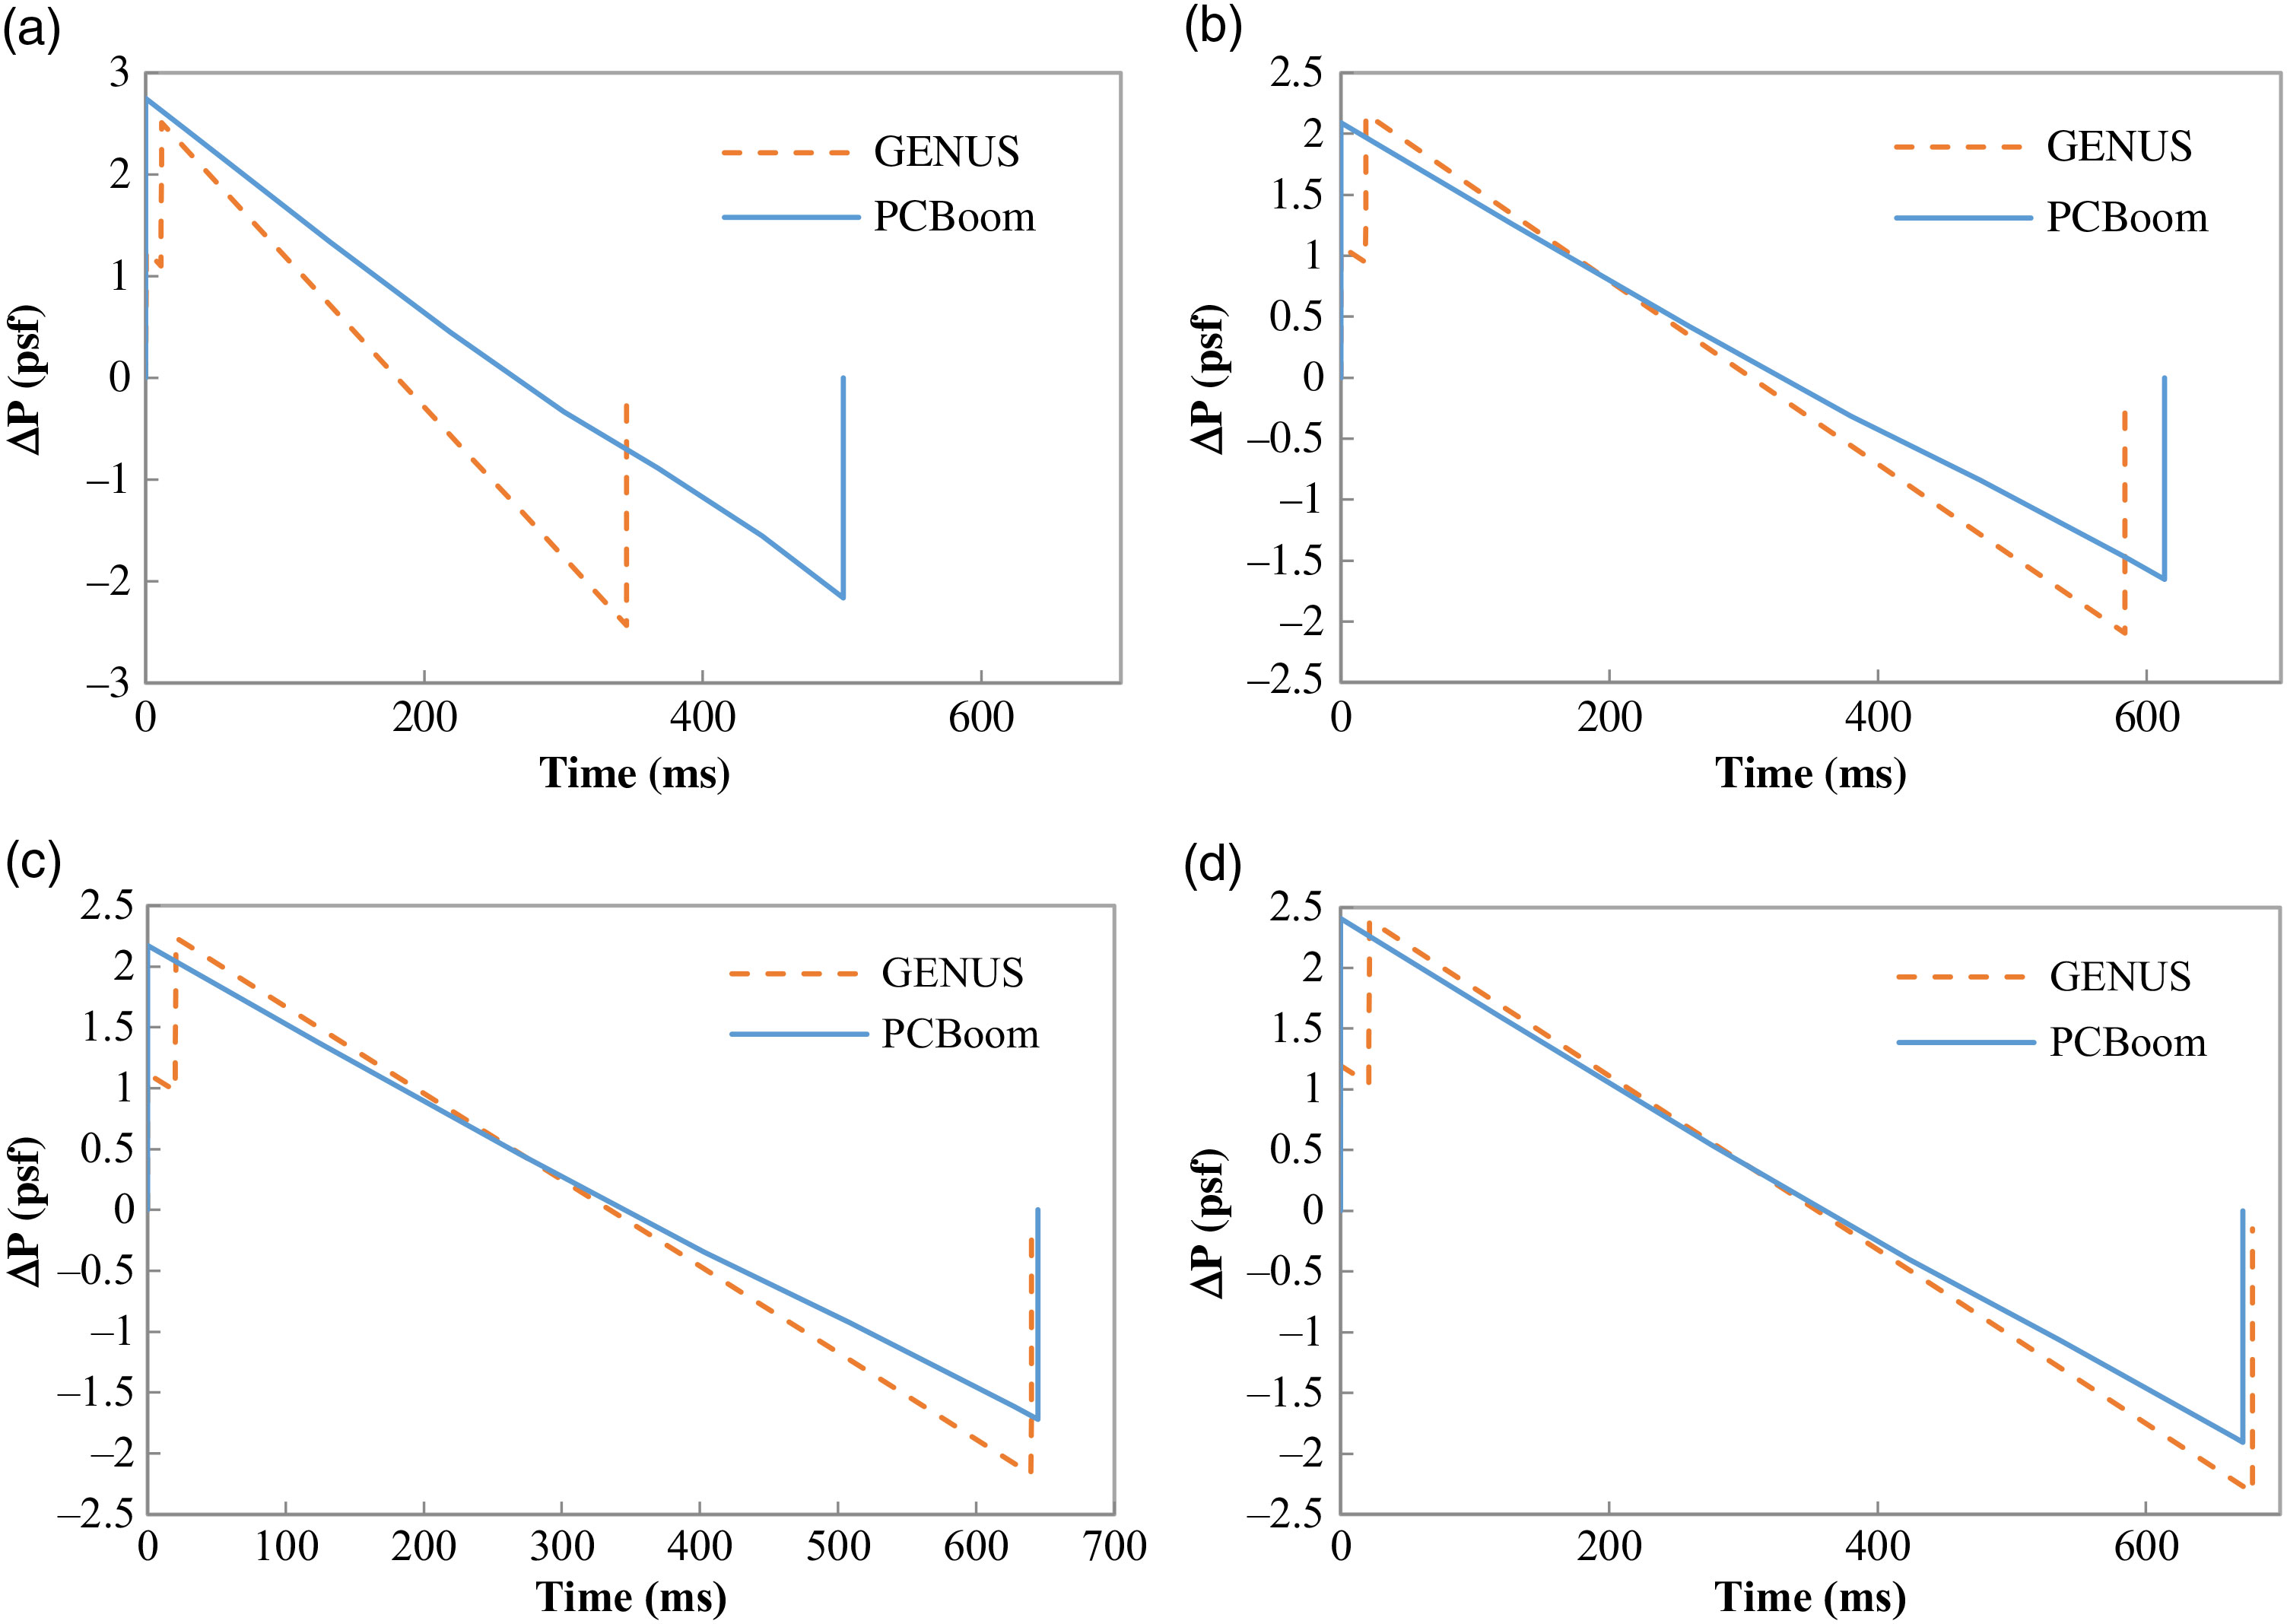
The results from the waveform parameter method are compared with the NASA PCBoom V.6. Sonic boom signatures intensity is measured by the unit of pound per square foot (psf, 1.0psf = 47.85Pa) from GENUS and PCBoom are plotted in Fig. 6. The GENUS waveform parameter method shows good match with PCBoom in terms of the sonic boom intensity. They are different by -8.75% in max pressure and -31.09% in duration at near field (Fig. 6(a)). The differences become -0.57% in max pressure and 1.09% in duration at ground (Fig. 6(d)). The comparisons indicate that the sonic boom propagation method in GENUS provides accurate sonic boom signature at ground.
Comparison of sonic boom overpressures from GENUS and PCBoom (a) Sonic boom overpressure at 40k feet, (b). Sonic boom overpressure at 20k feet and (c) Sonic boom overpressure at 10k feet (d) Sonic boom overpressure at ground.

6.0 CURRENT SUPERSONIC BUSINESS JET CONCEPTS EVALUATION
This section analyses the aerodynamics and sonic boom performance of six supersonic airliner concepts, as shown in Fig. 7. These concepts are selected for two reasons: the geometries can be built in the MDAO environment, with clear fuselage and lifting surfaces (wing, fin, horizontal tail, or canard); they are up to date and represent a range of configurations.
Business class civil supersonic jet concepts.

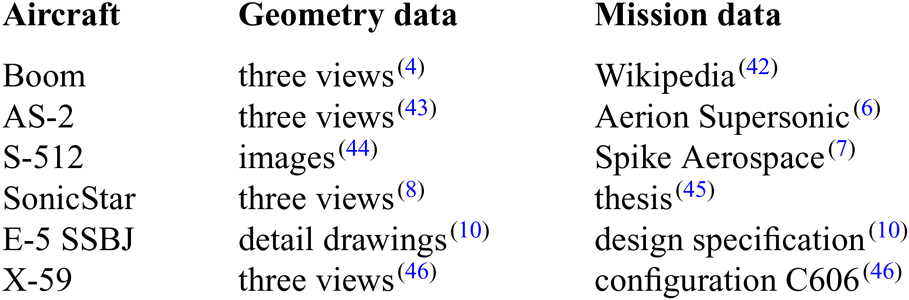
To model these concepts in a MDAO environment, the basic information required are geometry data, mission requirements, and engine performance data. The data has been assembled entirely from publically available sources (Table 1) and so it should be noted that some inaccuracies may have been introduced. For example, the overall geometries have been estimated from published three view drawings. Some of the geometry data, such as airfoil data, are not in the public domain and so, in this case, we use representative supersonic airliner data. However, the same consistent approach has been applied to each aircraft. The engine geometries are not modelled in this research.
Sources of geometry and mission data

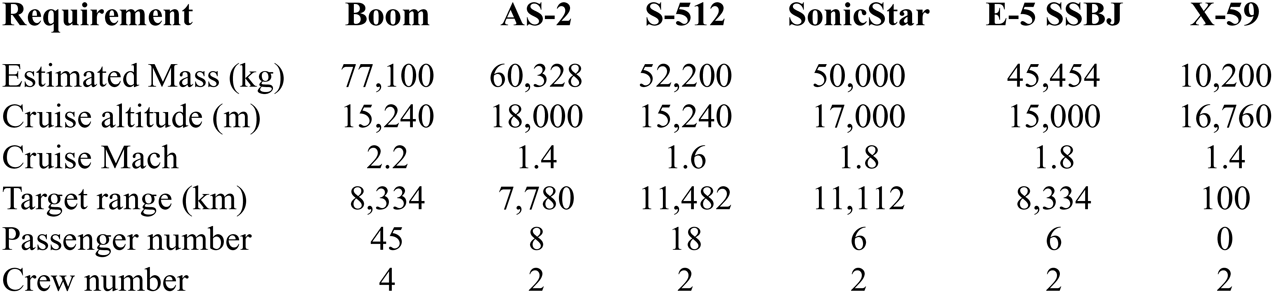
The mission requirements for these concepts are listed in Table 2. The table is sorted by the estimated mass. The SonicStar is modified to fulfill a mission at Mach 1.8 instead of Mach 3.6 and its estimated mass is then adjusted to a proper value of 50,000kg.
Mission requirements for SSBJs

The NASA EngineSim(47) is used to model the engines. The engines are sized by optimisations to make sure that each engine model is compliant with the performance requirements. Since the engine models do not make much difference to this research, we will not introduce the details.
6.1 Aerodynamic evaluation
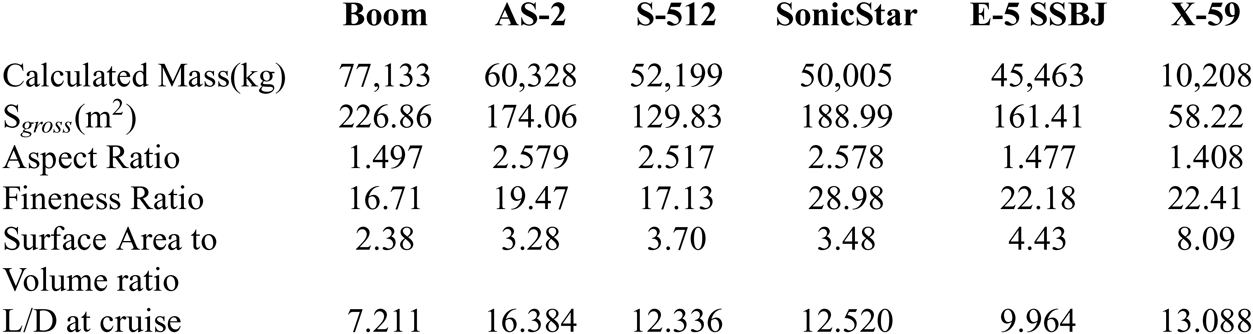
The aerodynamic evaluation results are listed in Table 3. This table gives the calculated mass, gross wing area, aspect ratio, fineness ratio, surface area to volume ratio, and lift to drag ratio (L/D). We use these overall ratios to help understand the aerodynamic performance.
Aerodynamic evaluation results of different configurations

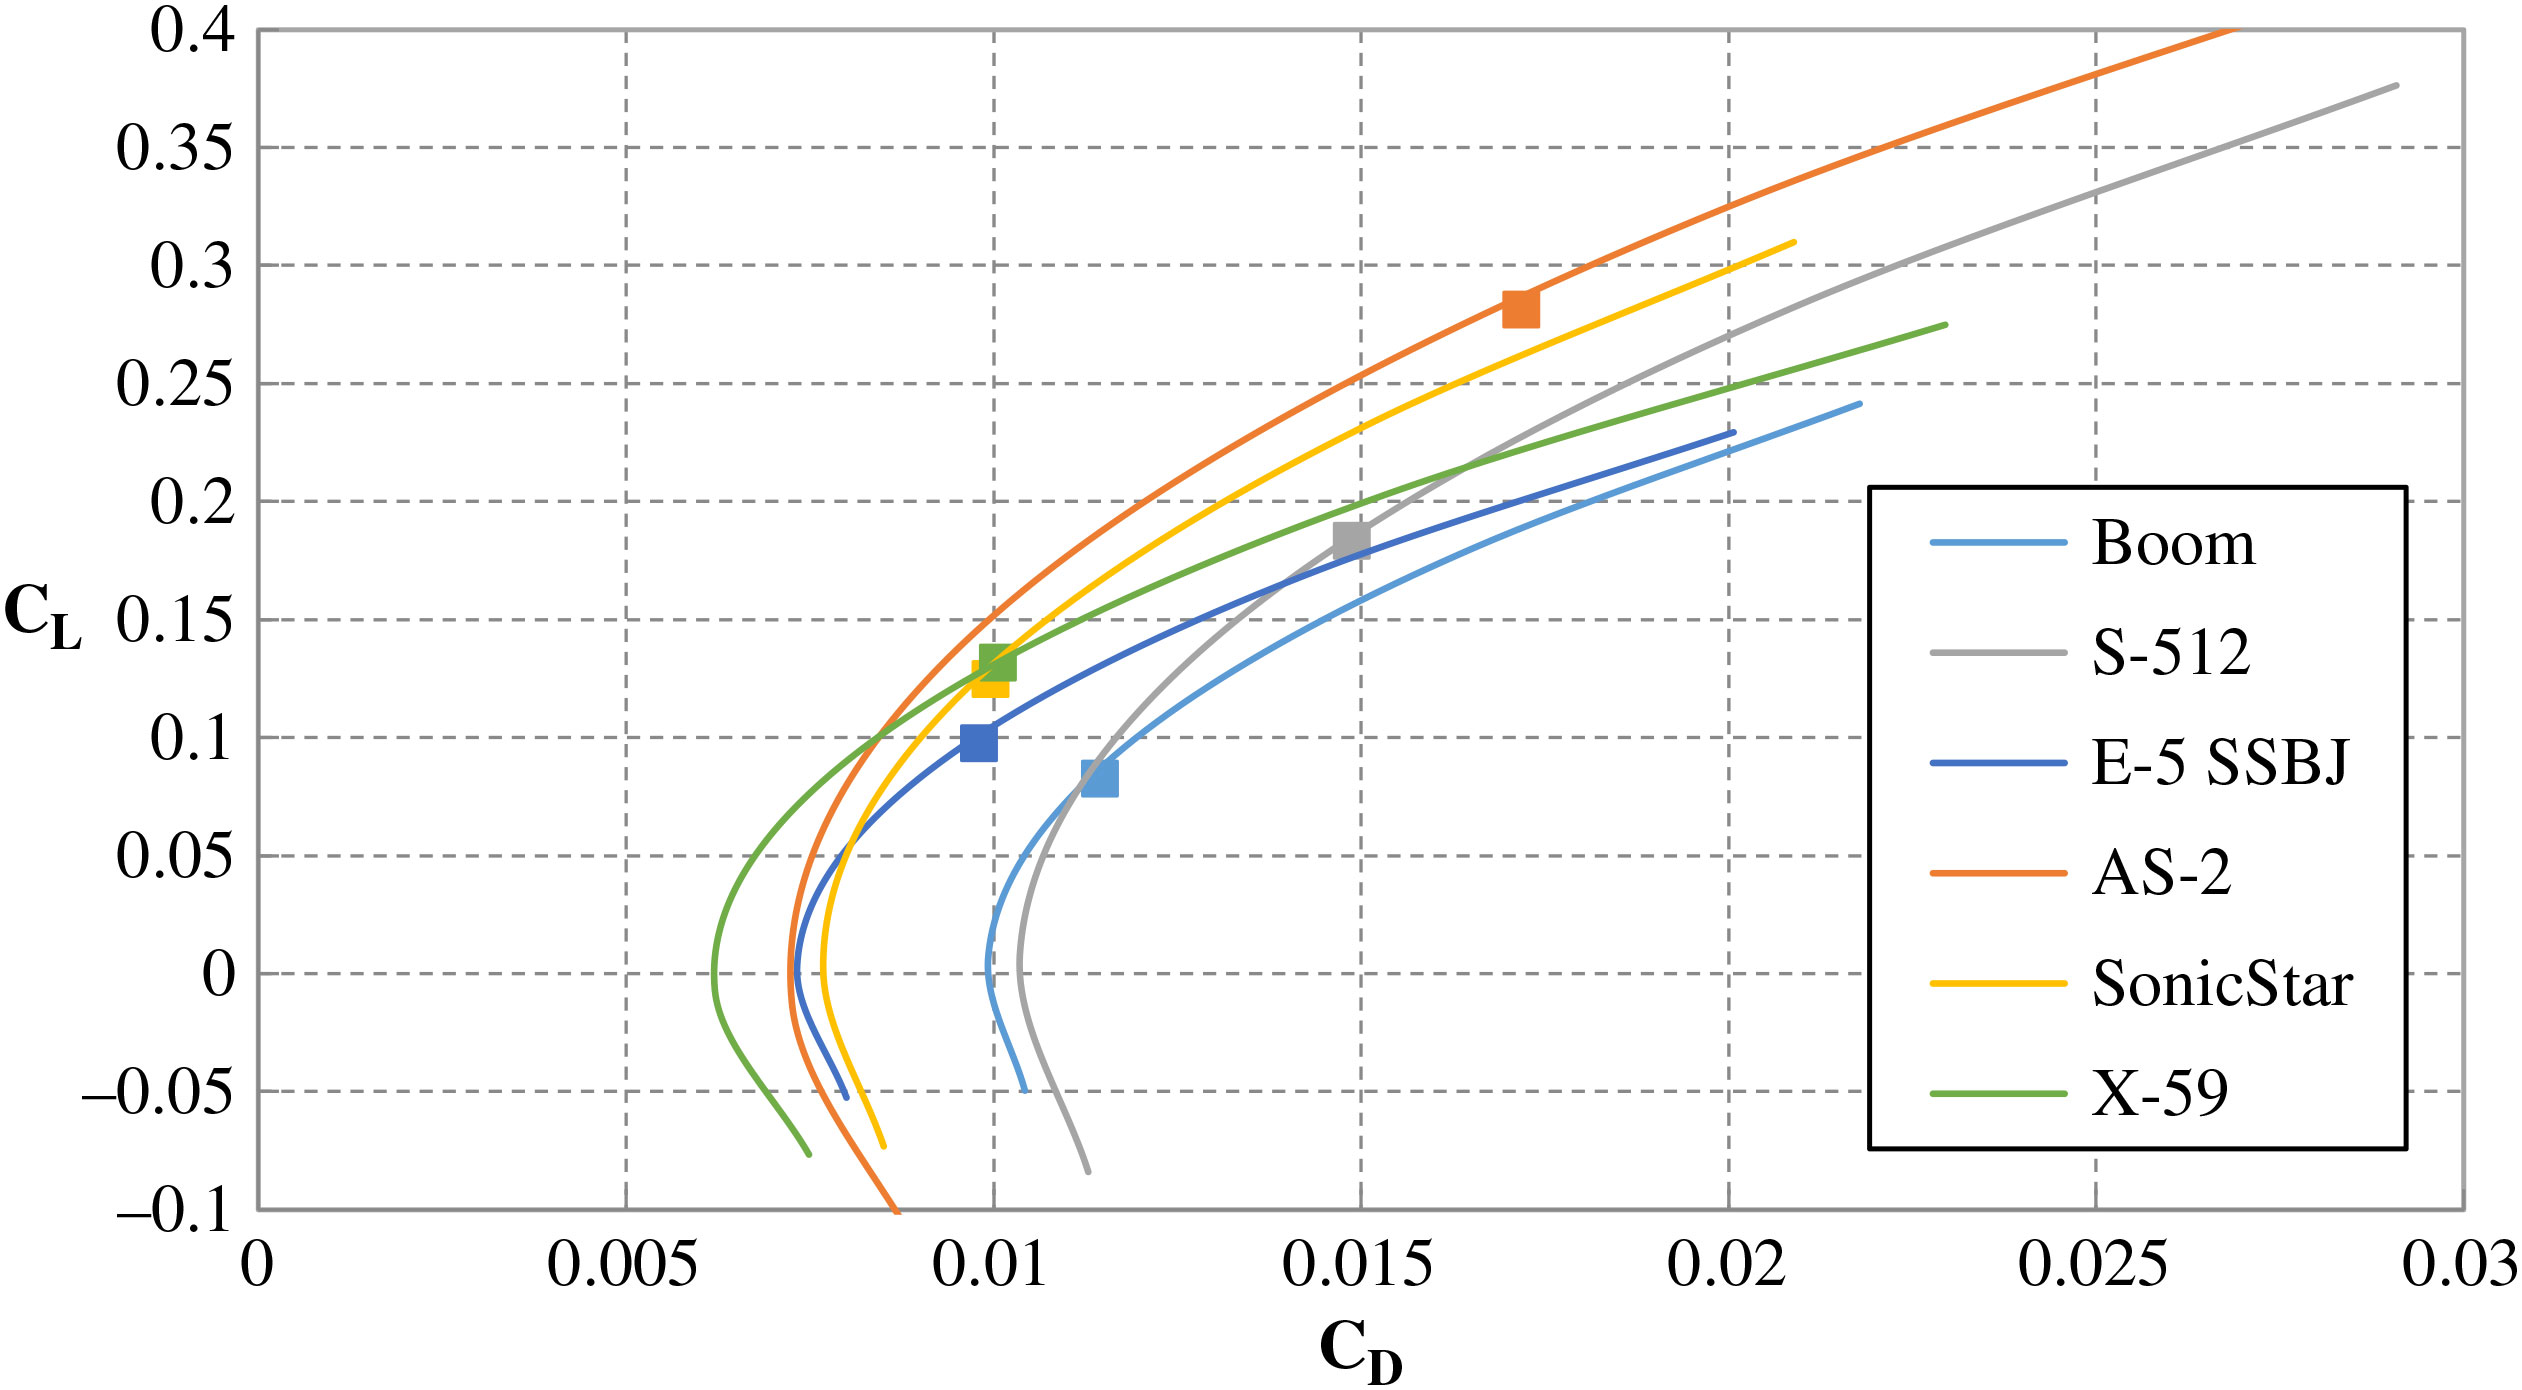
Fig. 8 plots the drag polar of each configuration from
 $-2{}^\circ$
to
 ${8}^\circ$
angle of attack at cruise Mach numbers. We can see that the AS-2 has the largest
 $\text{C}_{L}$
 $\text{(C}_{L} = 0.281\text{)}$
at cruise mainly because of the low cruise Mach number (Mach 1.4). The Boom airliner has the largest mass (77133kg), whereas the
 $\text{C}_{L}$
is the lowest
 ${(C}_{L} = 0.083\text{)}$
. This is due to both the high cruise Mach number (Mach 2.2) and large wing gross area
 $text{(227m}^{2}\text{)}$
. It can also be seen from Fig. 8 that the AS-2 has the largest lift curve slope as a result of the largest aspect ratio (2.579). X-59 QueSST has the lowest aspect ratio (1.408), thus the lowest lift curve slope.
Comparison of drag polar and cruise points.

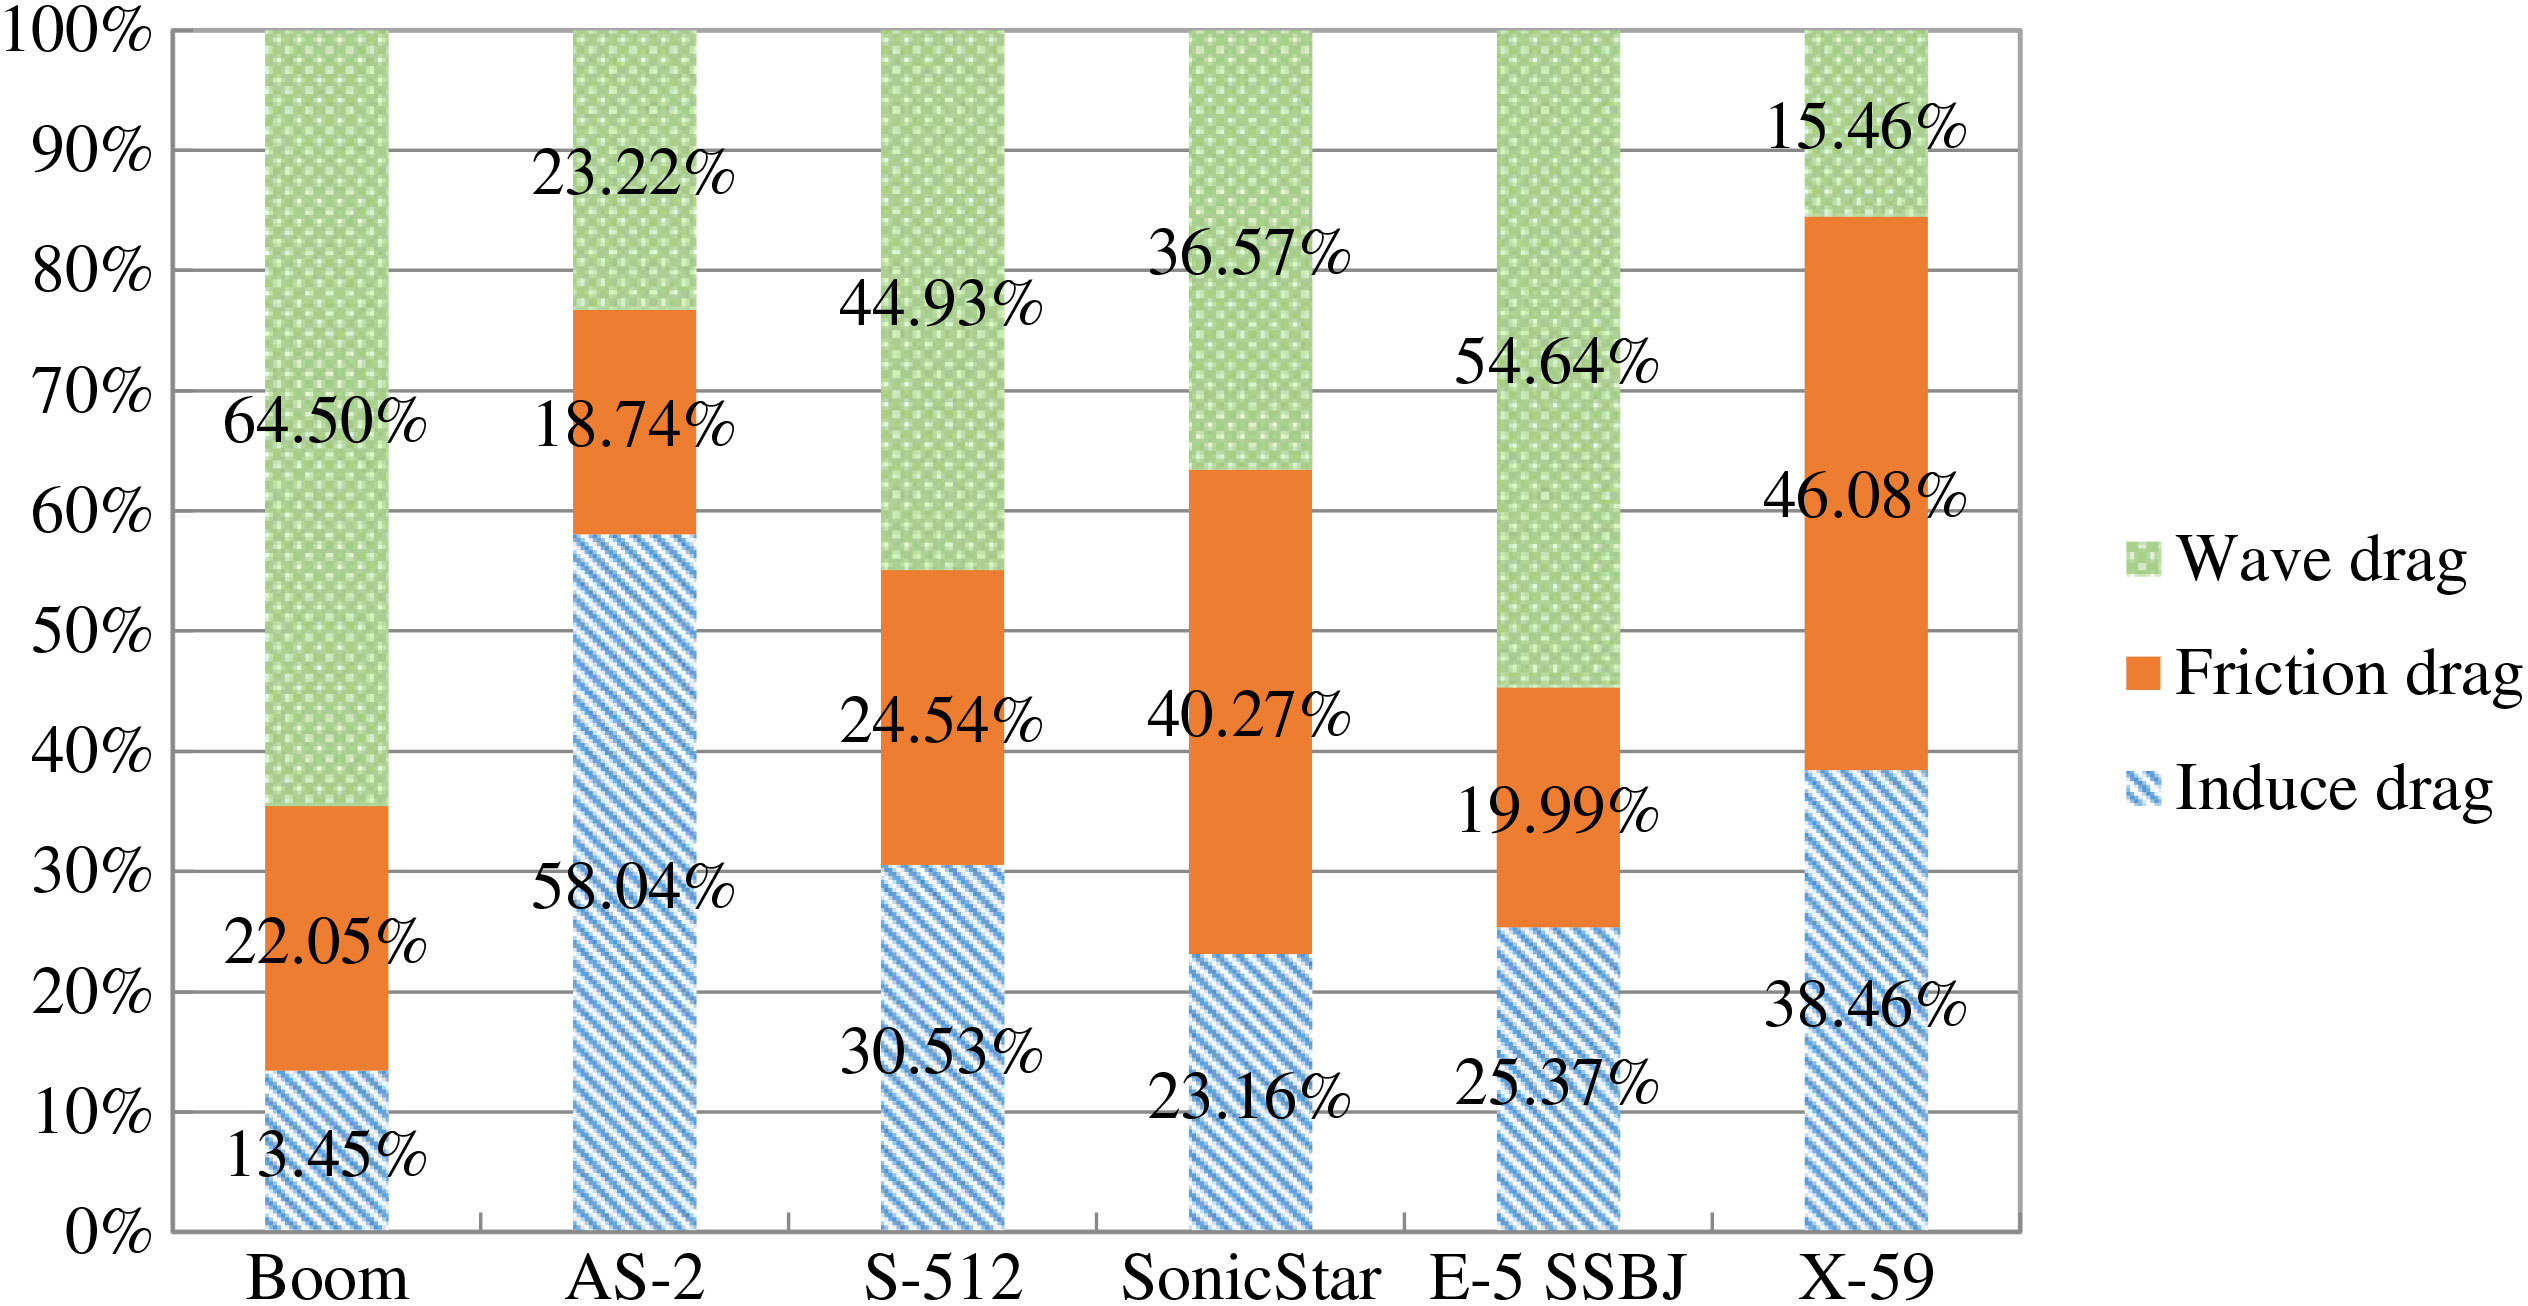
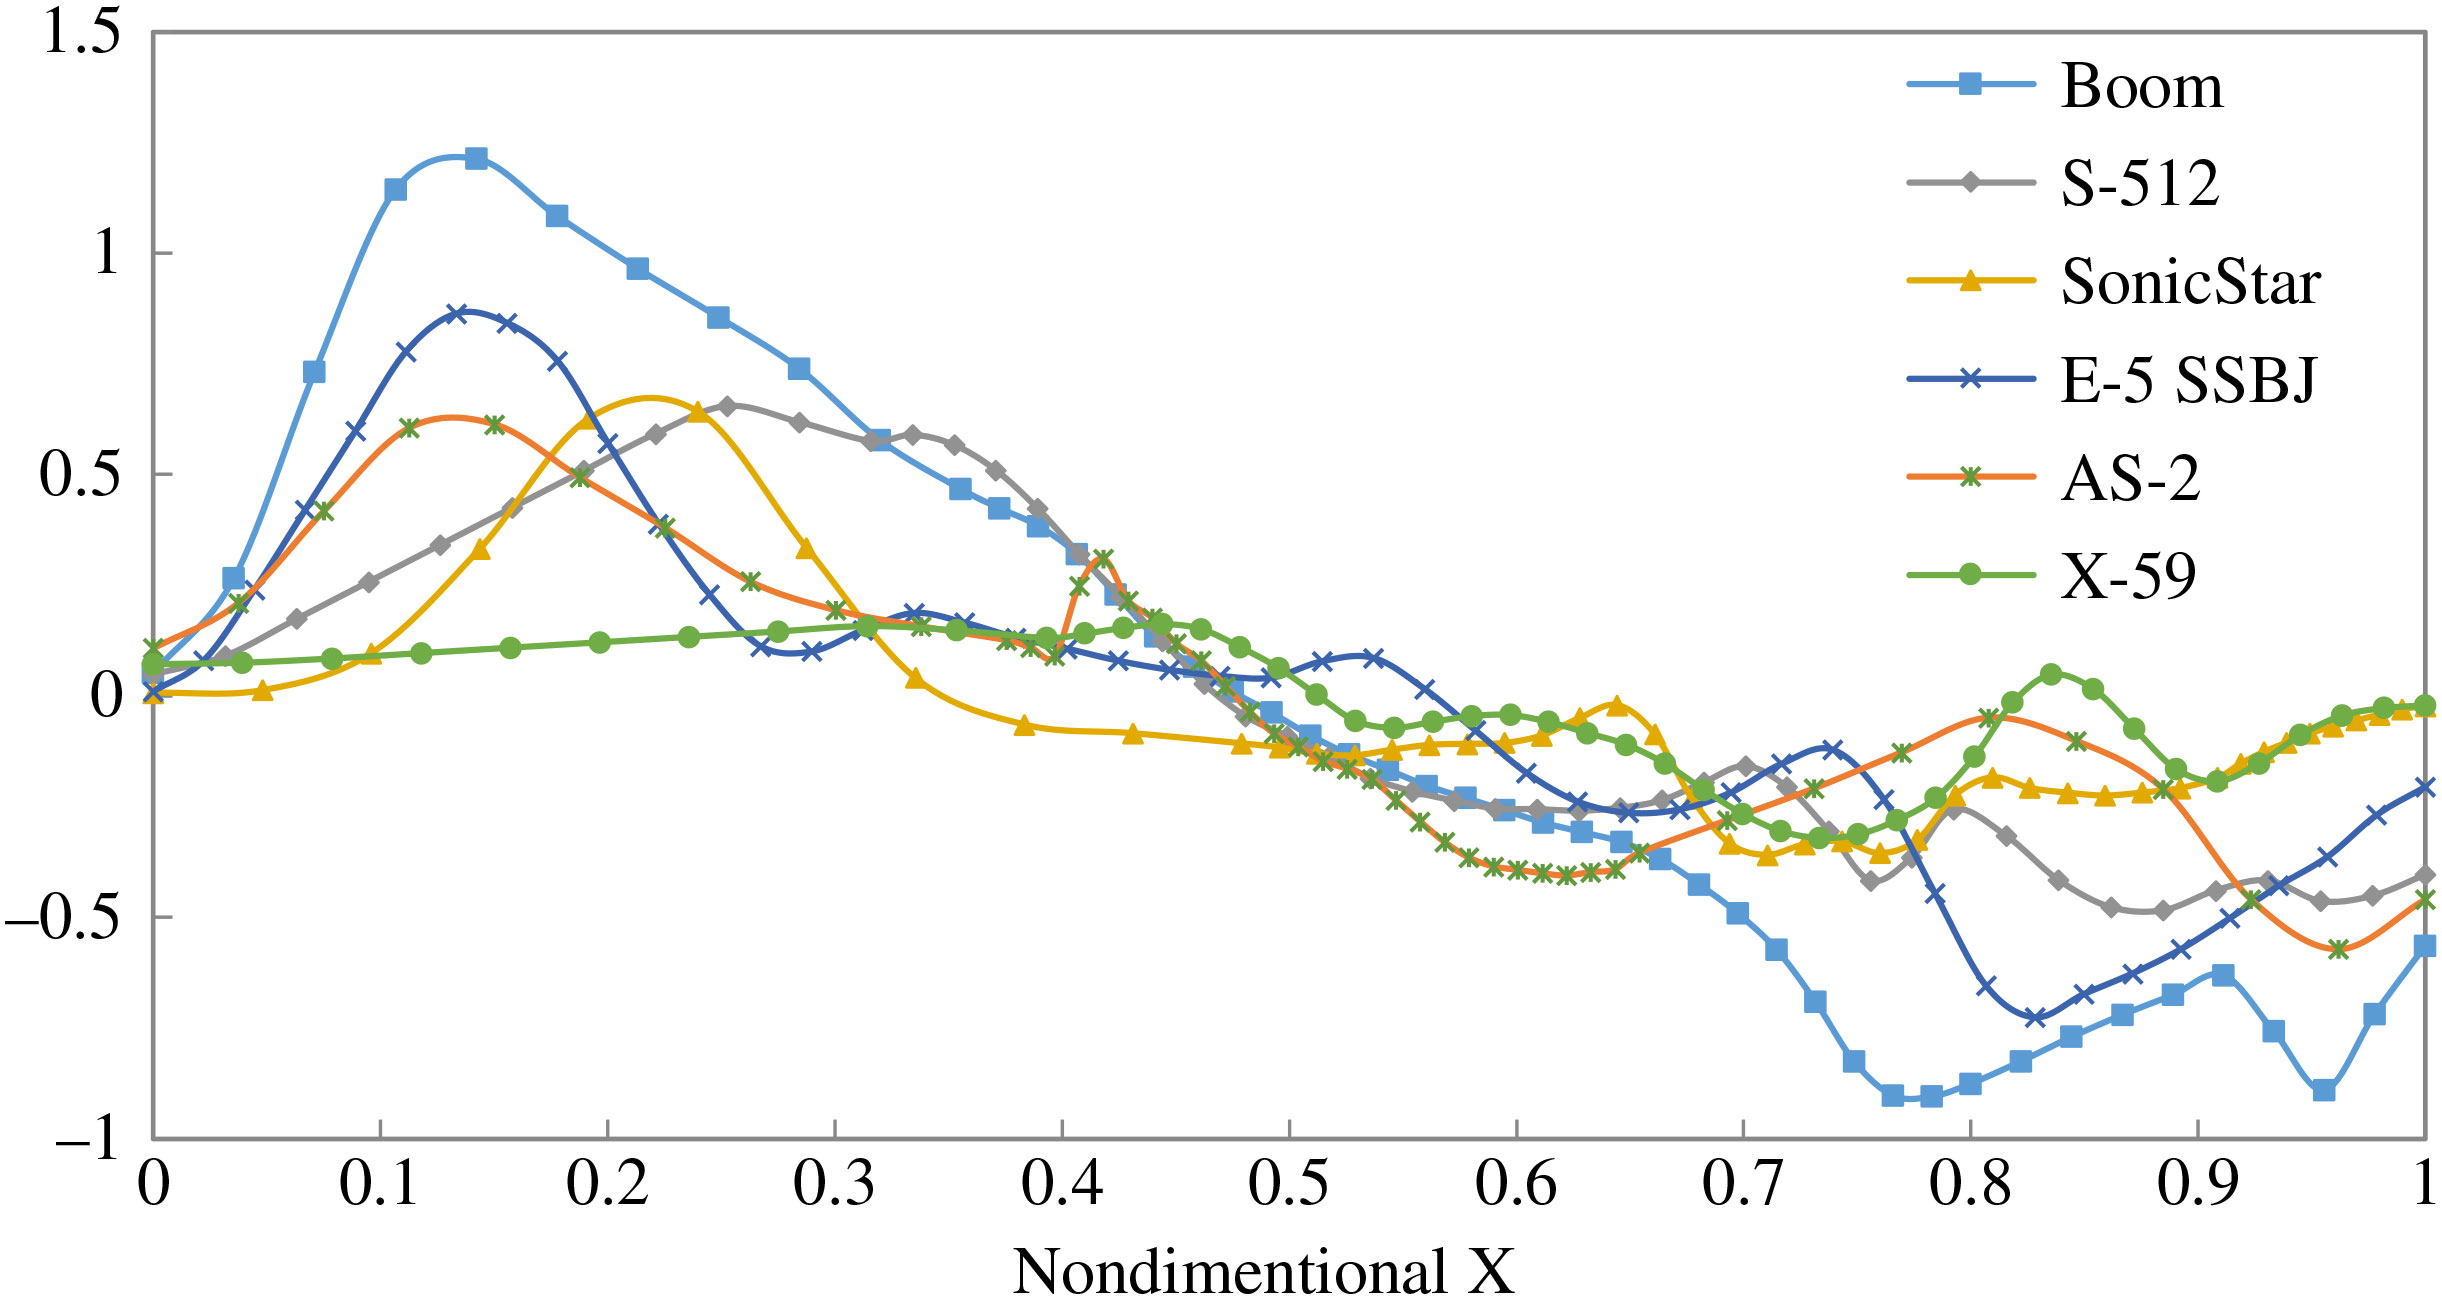
Another big difference we can see from Fig. 8 are the zero lift drag coefficients. The drag components of each configuration are compared in Fig. 9. The Boom airliner has the biggest wave drag proportion (64.50%). That is because the Boom airliner has the lowest fineness ratio (16.71). As we can see from the first derivative of volume distribution in Fig. 10, the Boom airliner has the largest volume change value. The NASA X-59 QueSST has the lowest value, thus the lowest wave drag proportion (15.46%). Therefore, the wave drag is proportion to the first derivative of the volume distribution.
Drag components of the configurations at cruise conditions.

Comparison of the first derivative of the volume distributions.

For the friction drag aspect, the NASA X-59 QueSST has the largest friction drag proportion (46.08%), because it has a much larger surface area to volume ratio (8.09) than all the other configurations. The friction drag of AS-2 is very low (18.74%) due to the supersonic natural laminar flow (SSNLF) wing, which is assumed to have a SSNLF fraction of 40%(Reference Sturdza14). The E-5 SSBJ has a low friction drag proportion (19.99%) due to the hybrid laminar control technology(Reference Stocking9).
6.2 Sonic boom evaluation
The sonic boom evaluation results are listed in Table 4. This table gives the maximum overpressure, maximum underpressure, time duration, and sonic boom intensity (
 $\triangle$
P). These results are used to help analyze the sonic boom of each configuration.
Sonic boom evaluation results of different configurations

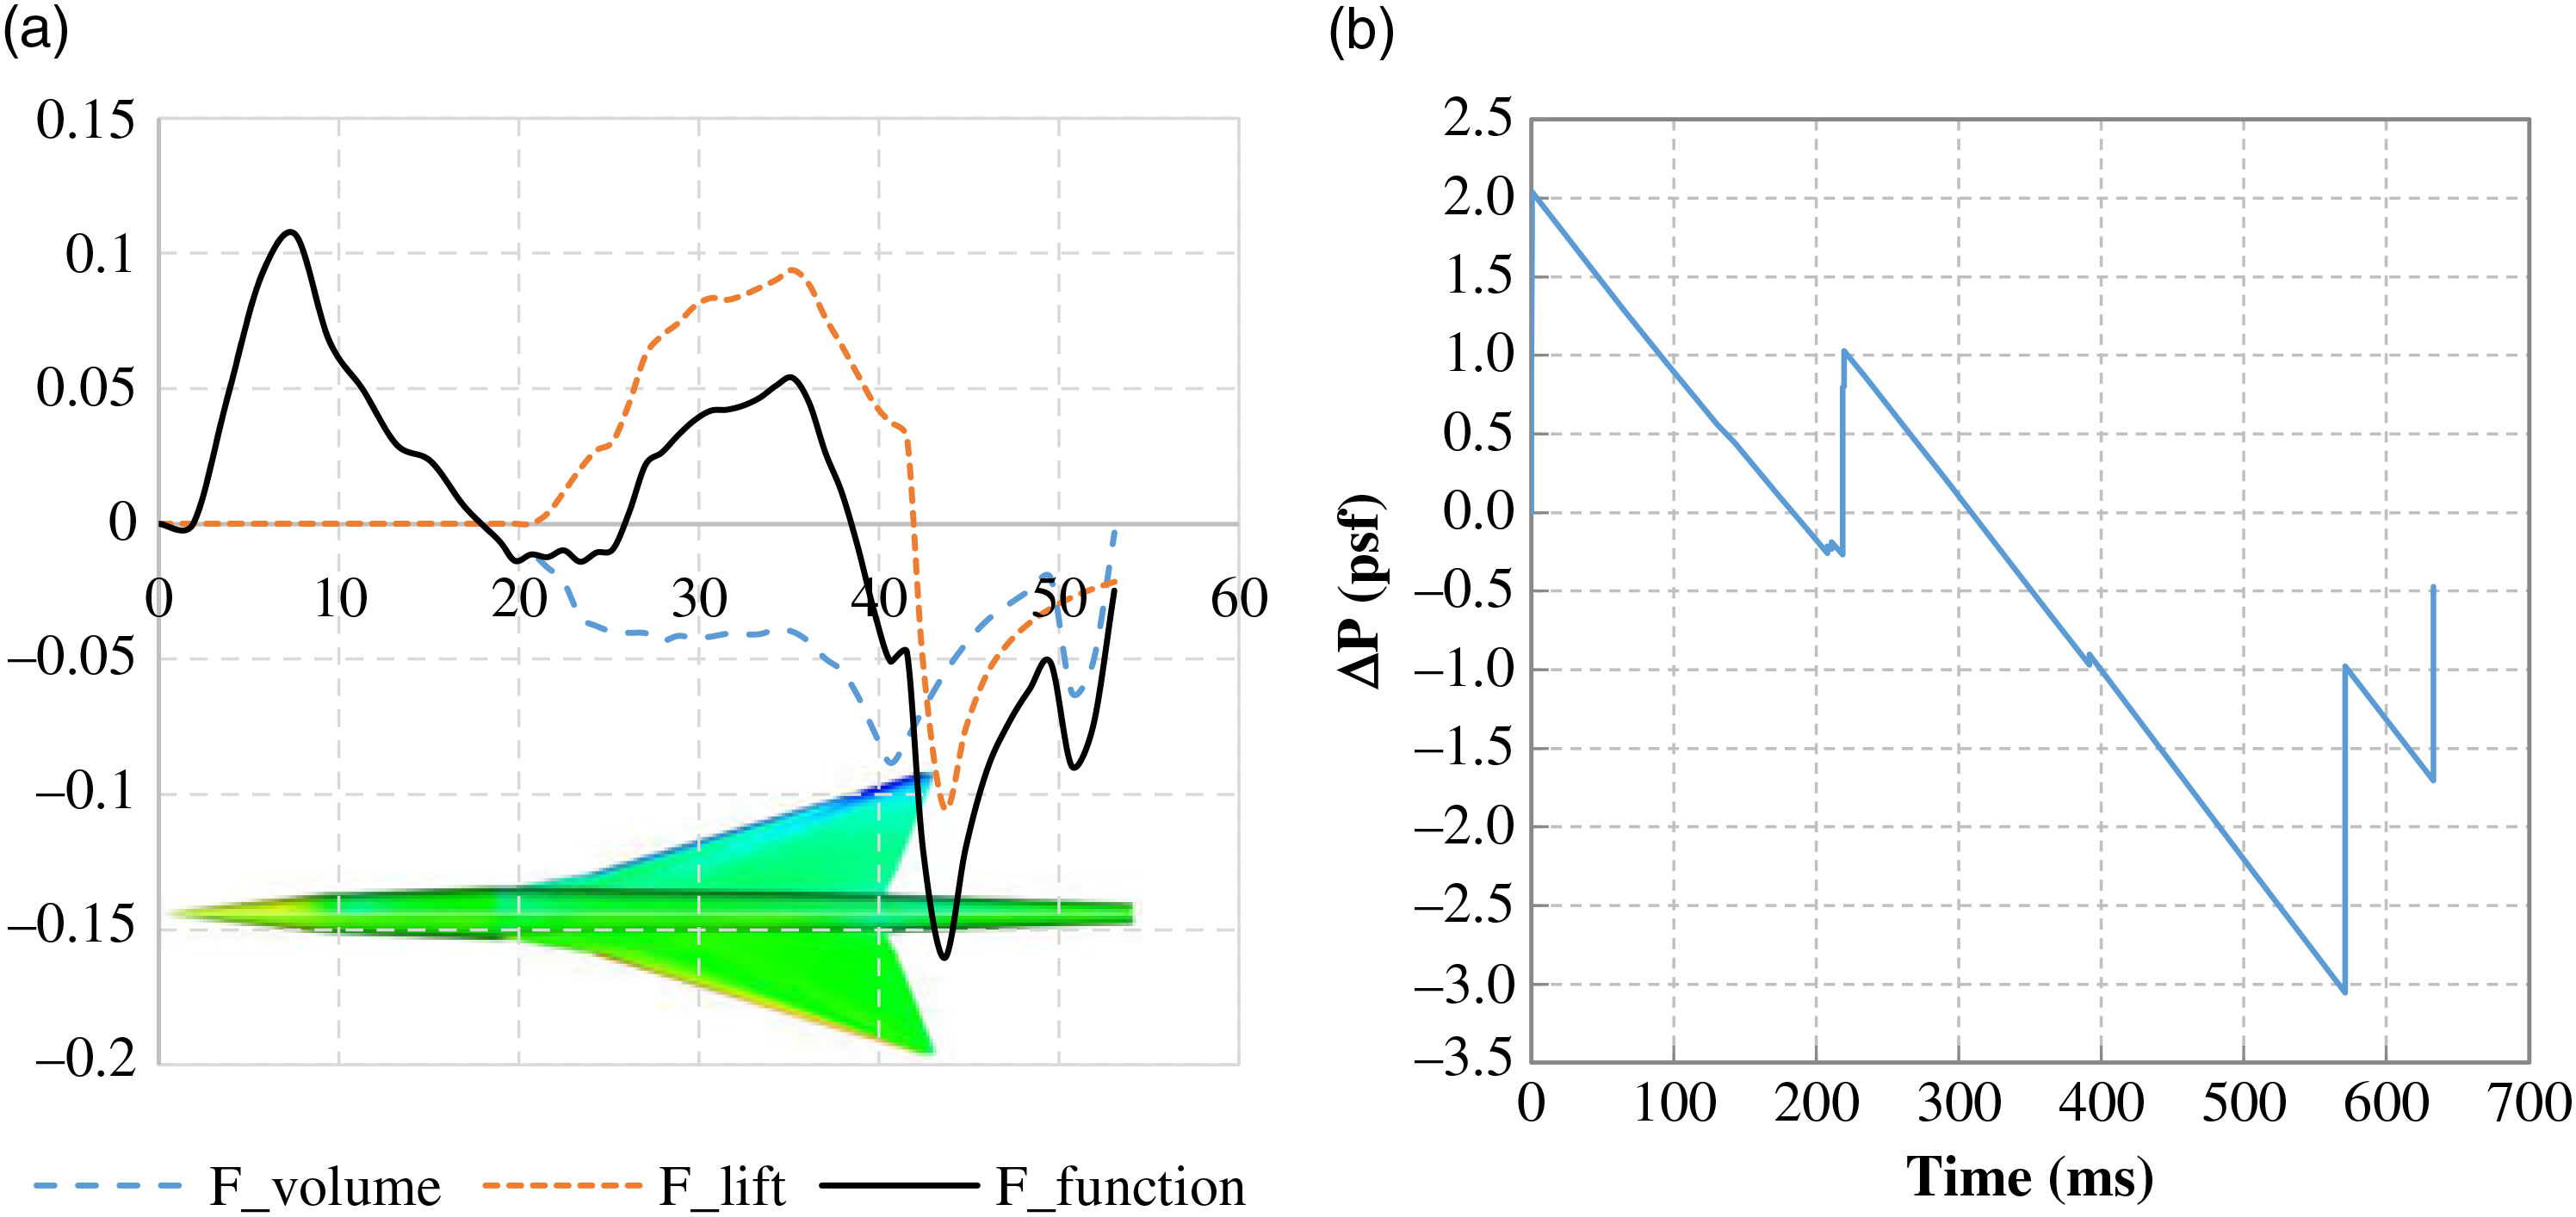
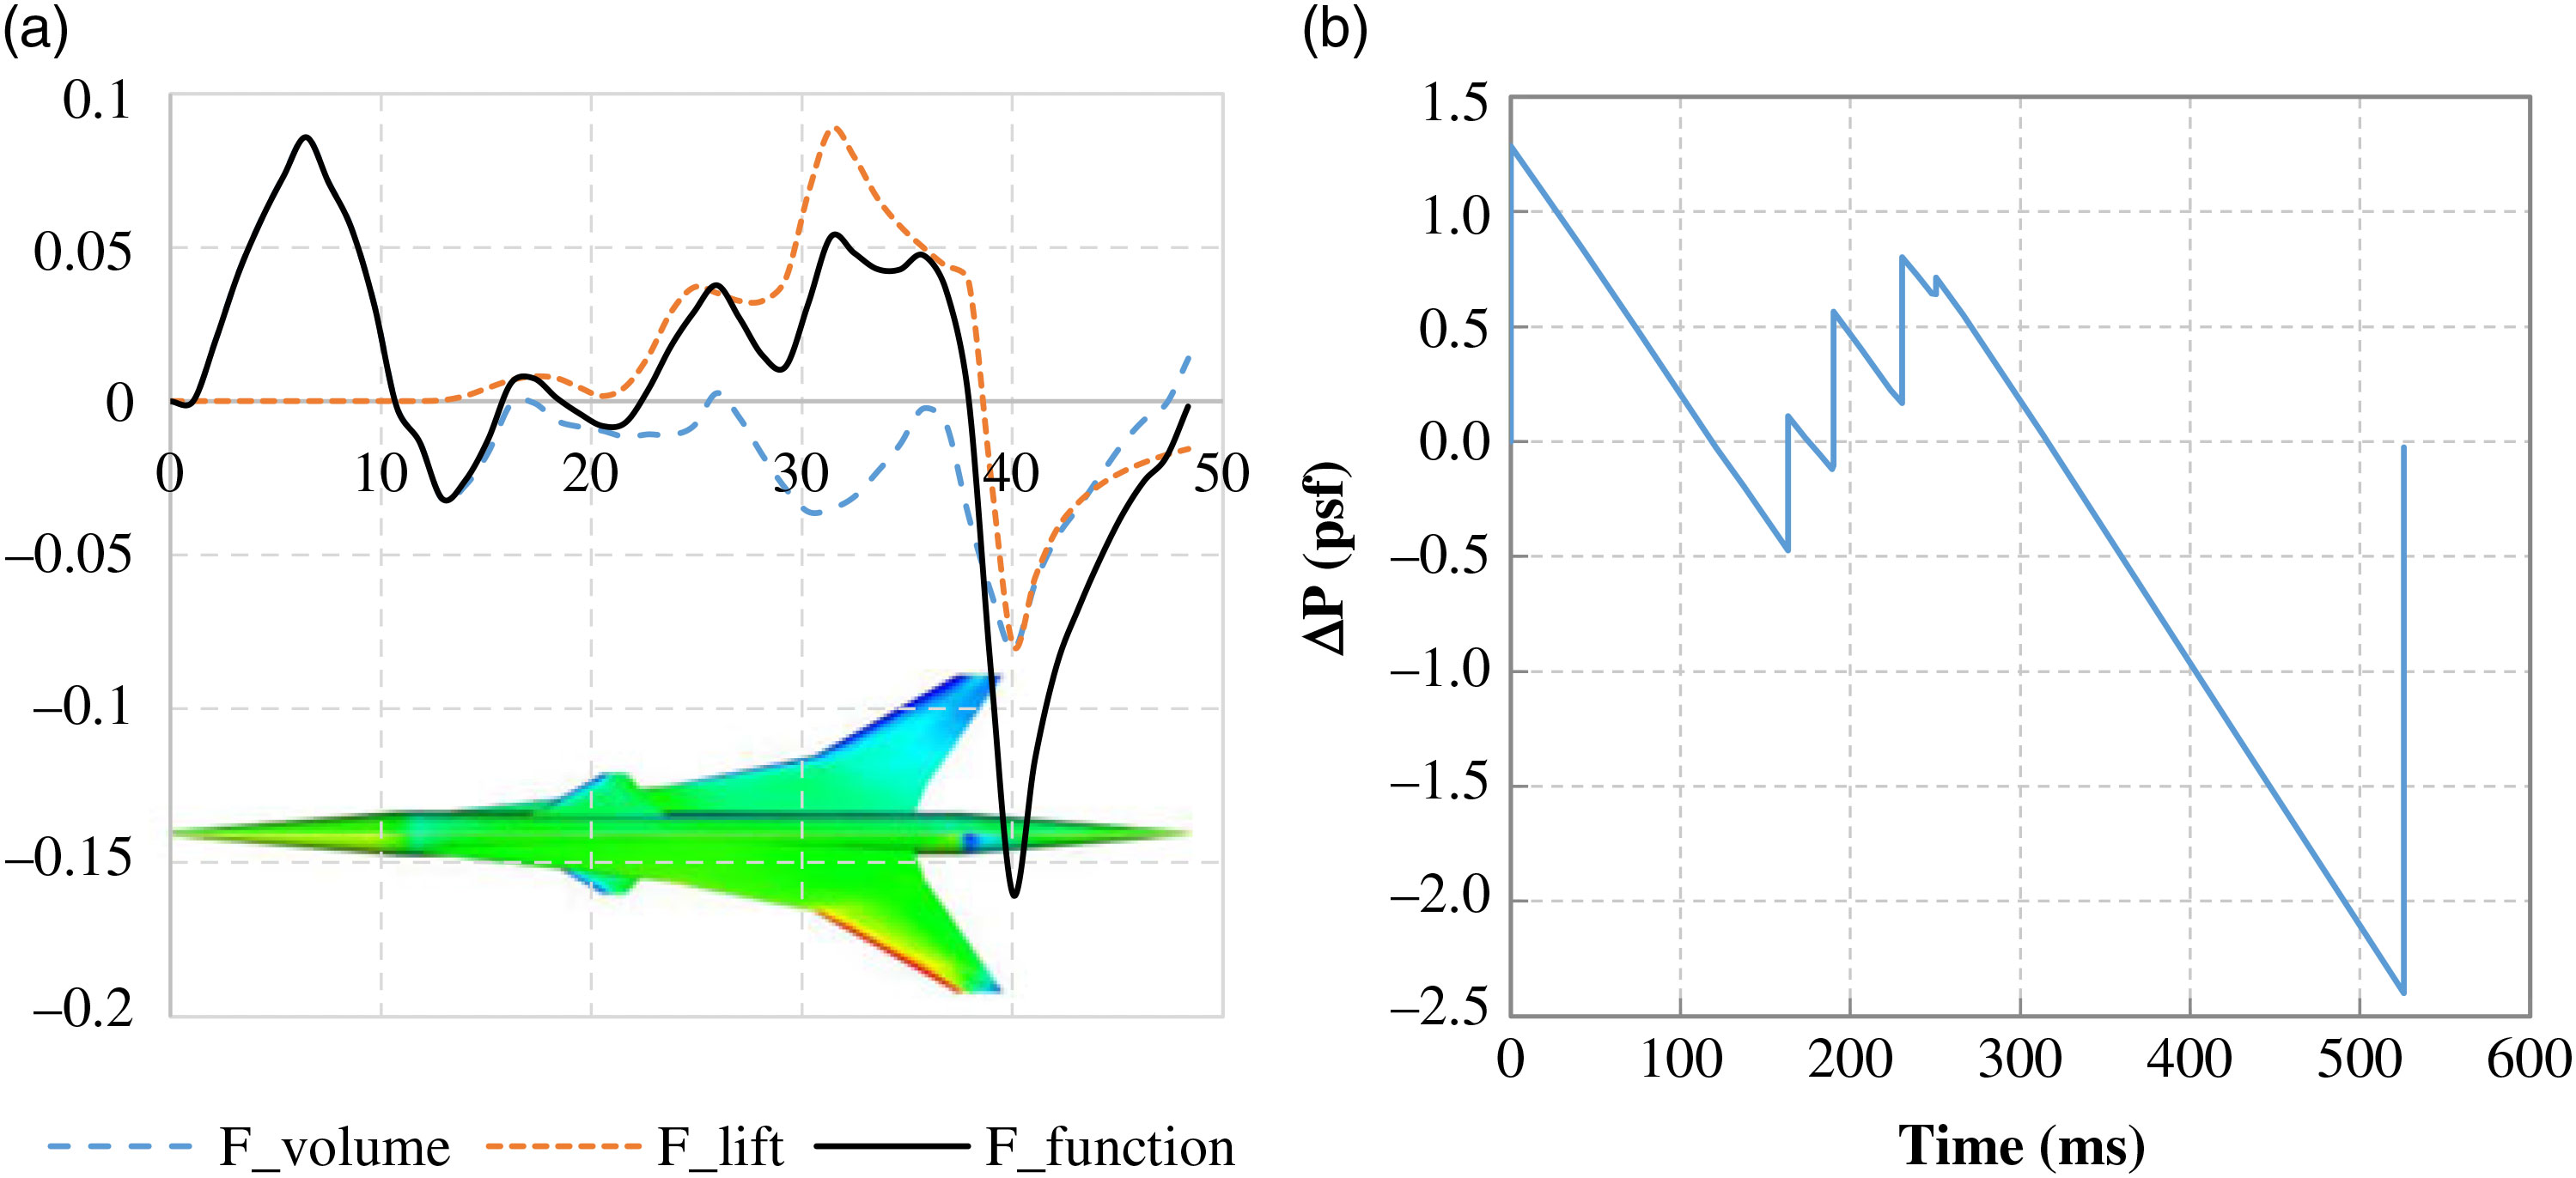
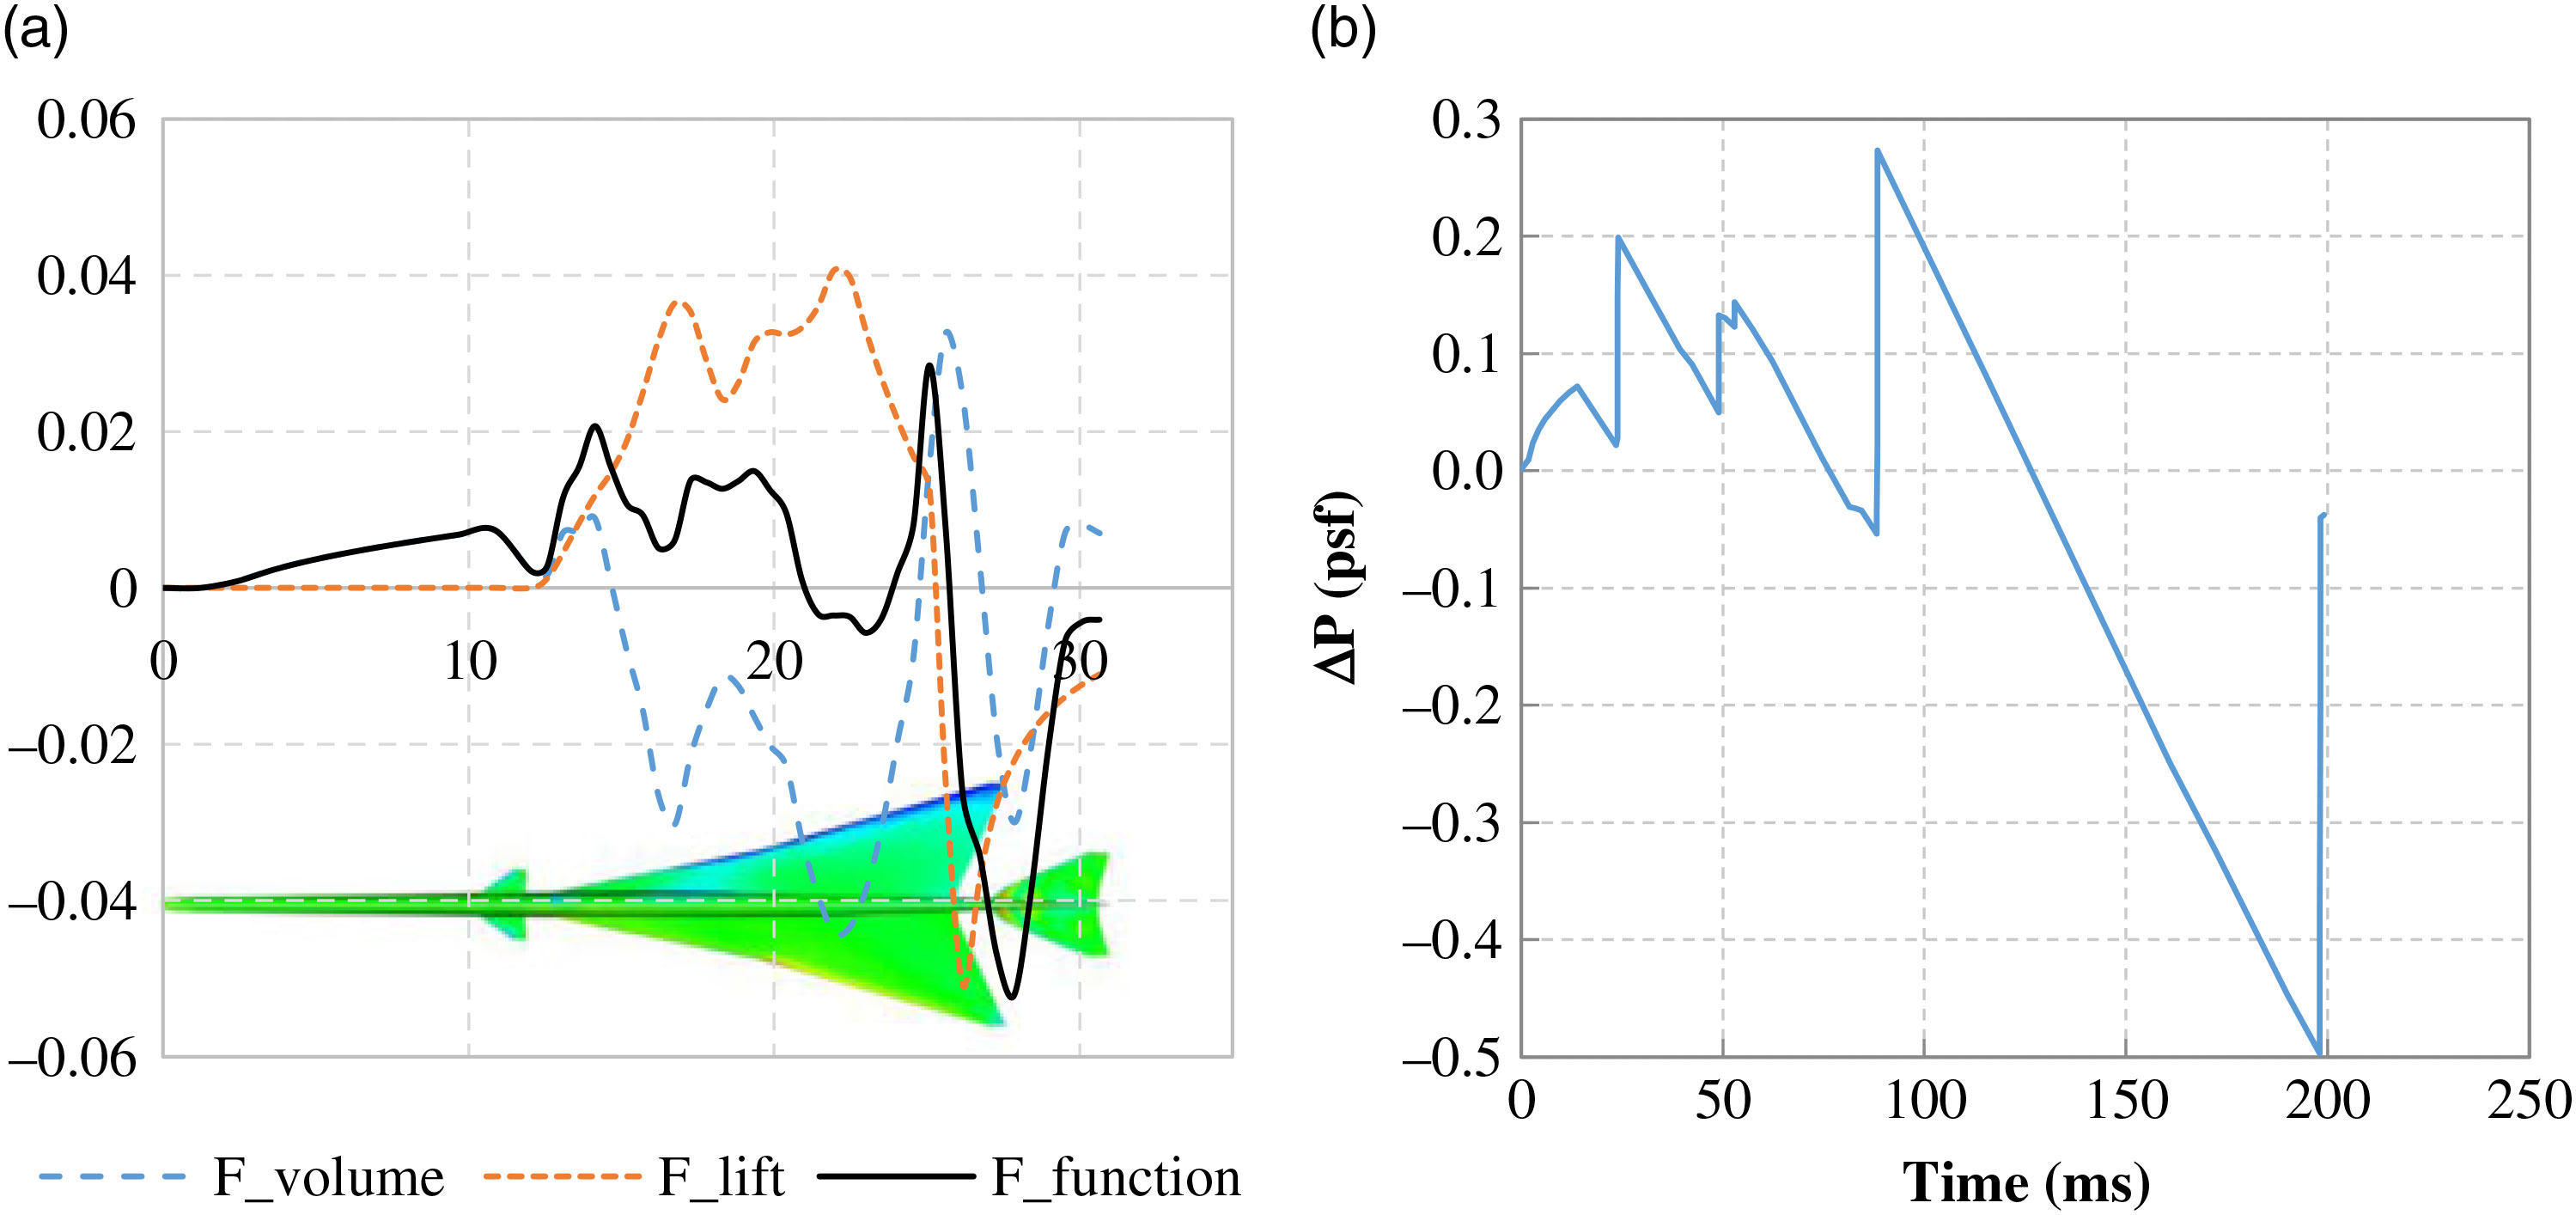
Figs. 11 to 16 give the near-field pressure and ground sonic boom signature of each configuration. For the near-field pressure is the same shape as the F-function signature as indicated in Equation (9). The F-function is decomposed to F-function due to volume and F-function due to lift, as indicated in Equation (8), to evaluate their individual impact. It can also be seen from Equation (8) that the F-function due to volume is a reflection of the first derivative of volume distribution and the F-function due to lift is a refelction of the lift distribution.
Near-field and ground signatures of Boom airliner (a) near-field pressure components and (b) ground boom signature.

The near-field and ground signatures of the Boom airliner model are plotted in Fig. 11. The maximum sonic boom intensity is 3.054psf. When comparing the near-field signature and the ground signature, the peaks in both plots are corresponding. The 3.054psf underpressure is due to the lift distribution peak overlap with the first derivative of volume distribution peak at 43.6m. This can be reduced by rearranging the wing and fuselage geometry to mismatch the peaks. The nose volume rate of change is a large value and so forms the maximum overpressure peak. This overpressure can be reduced by increasing the length of the conical nose.
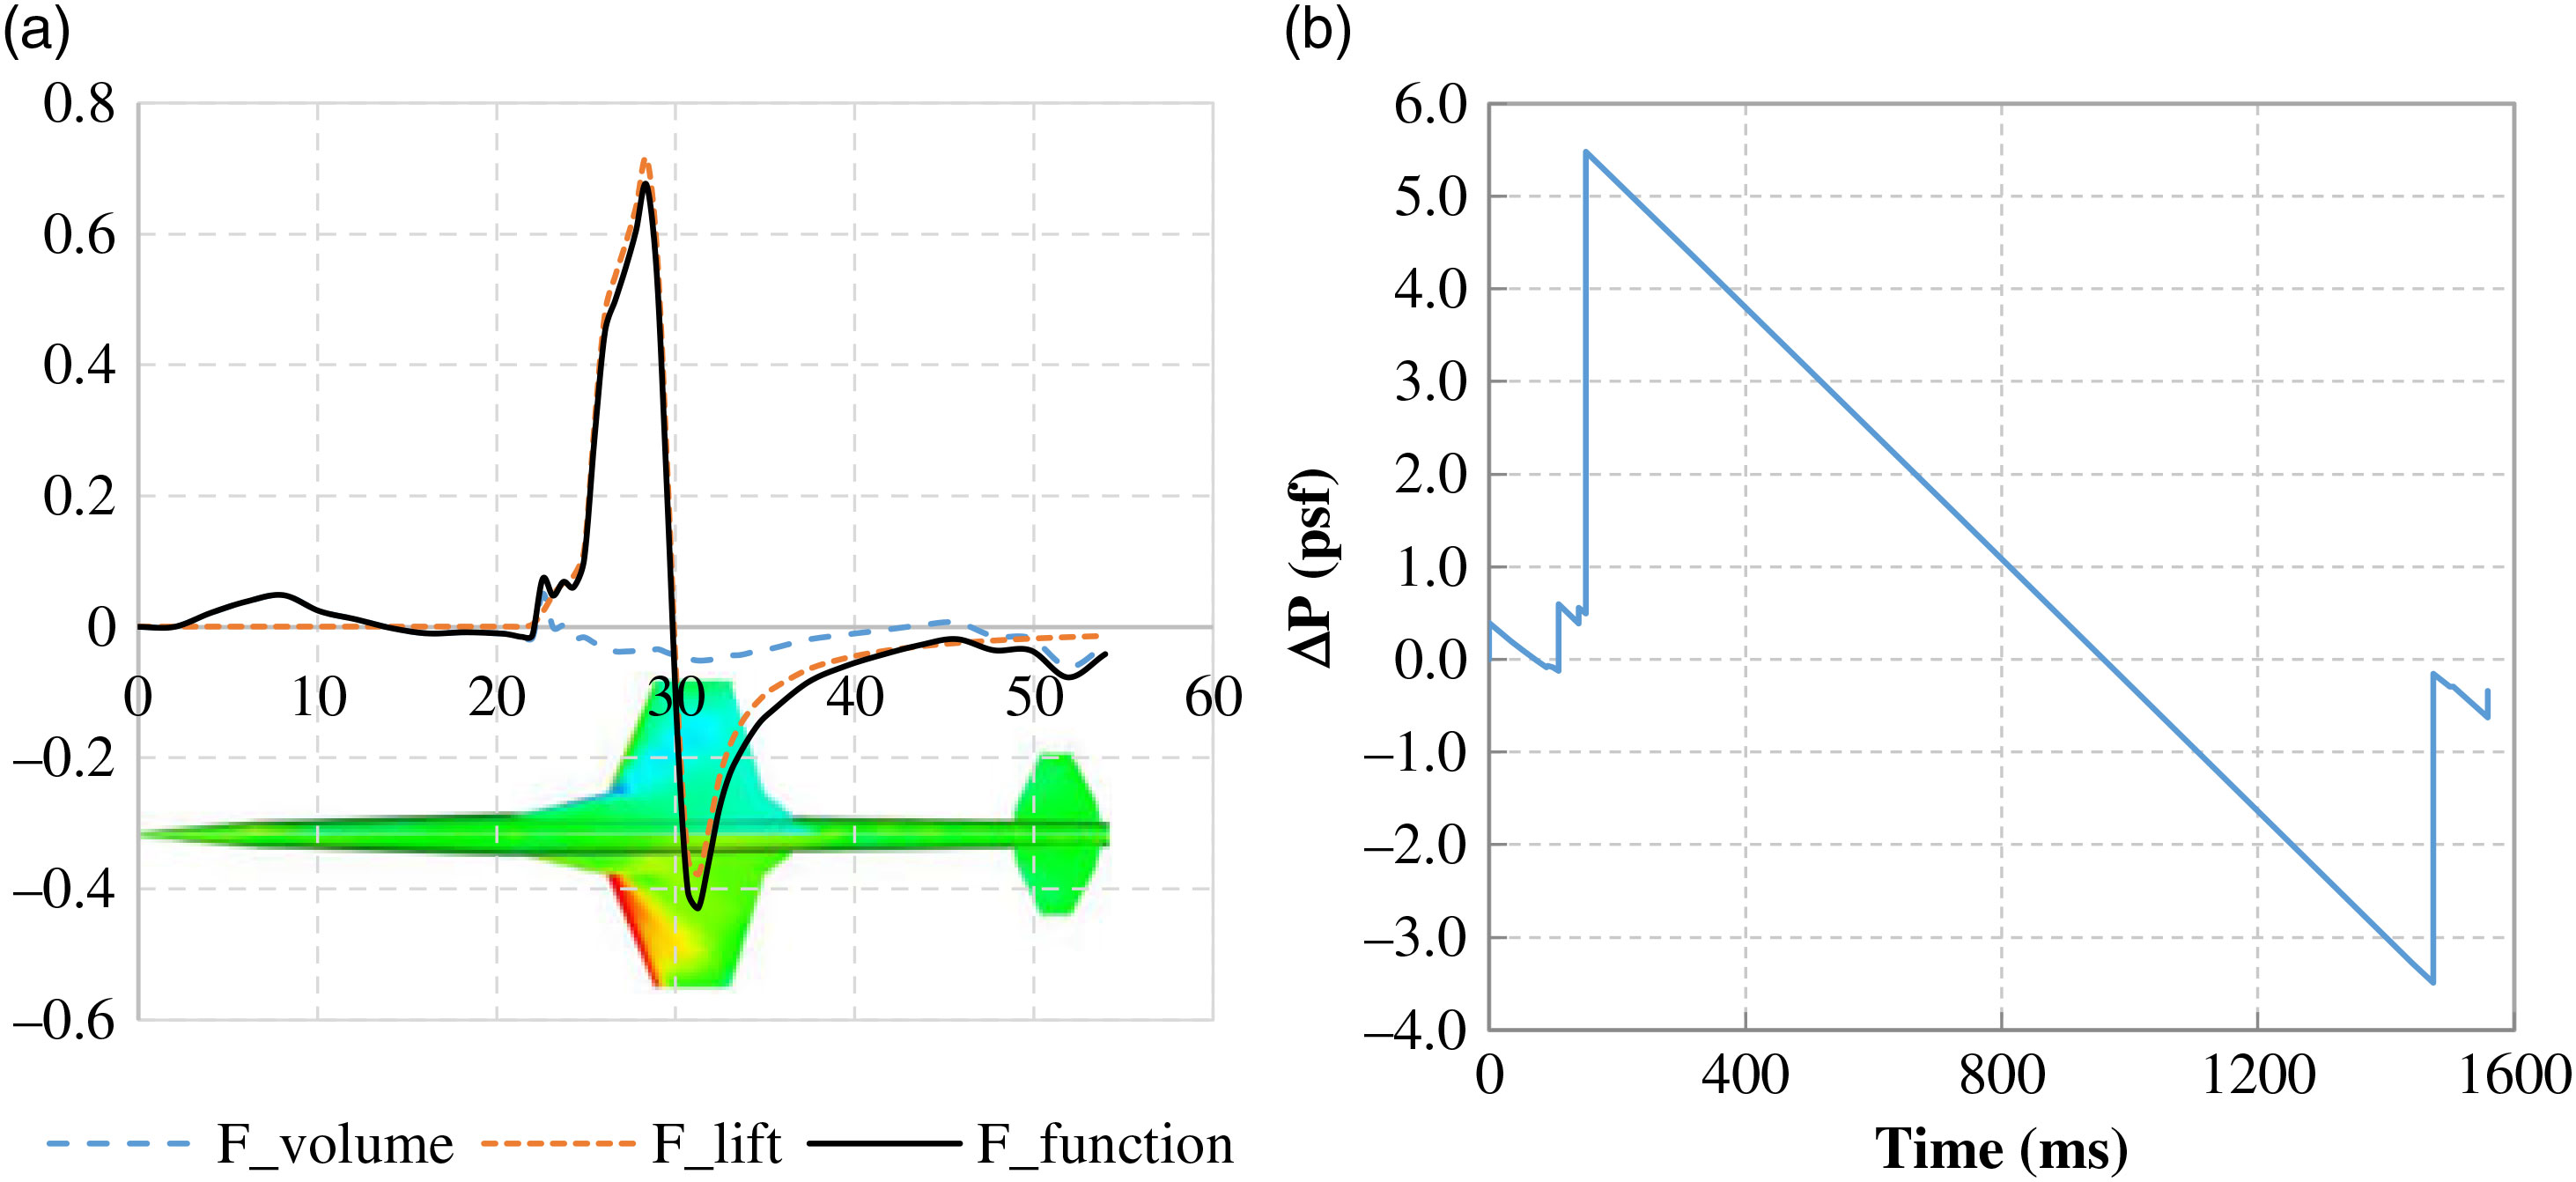
The near-field and ground signatures of Aerion AS-2 model are plotted in Fig. 12. It can be seen clearly from the near-field signature that the maximum overpressure of 5.483psf is due to the concentrated lift distribution. The short chord length of the configuration causes this problem. This configuration is designed to facilitate the natural laminar flow to reduce friction drag, which leaves little space for sonic boom mitigation.
Near-field and ground signatures of Aerion AS-2 (a) near-field pressure components (b) ground boom signature.

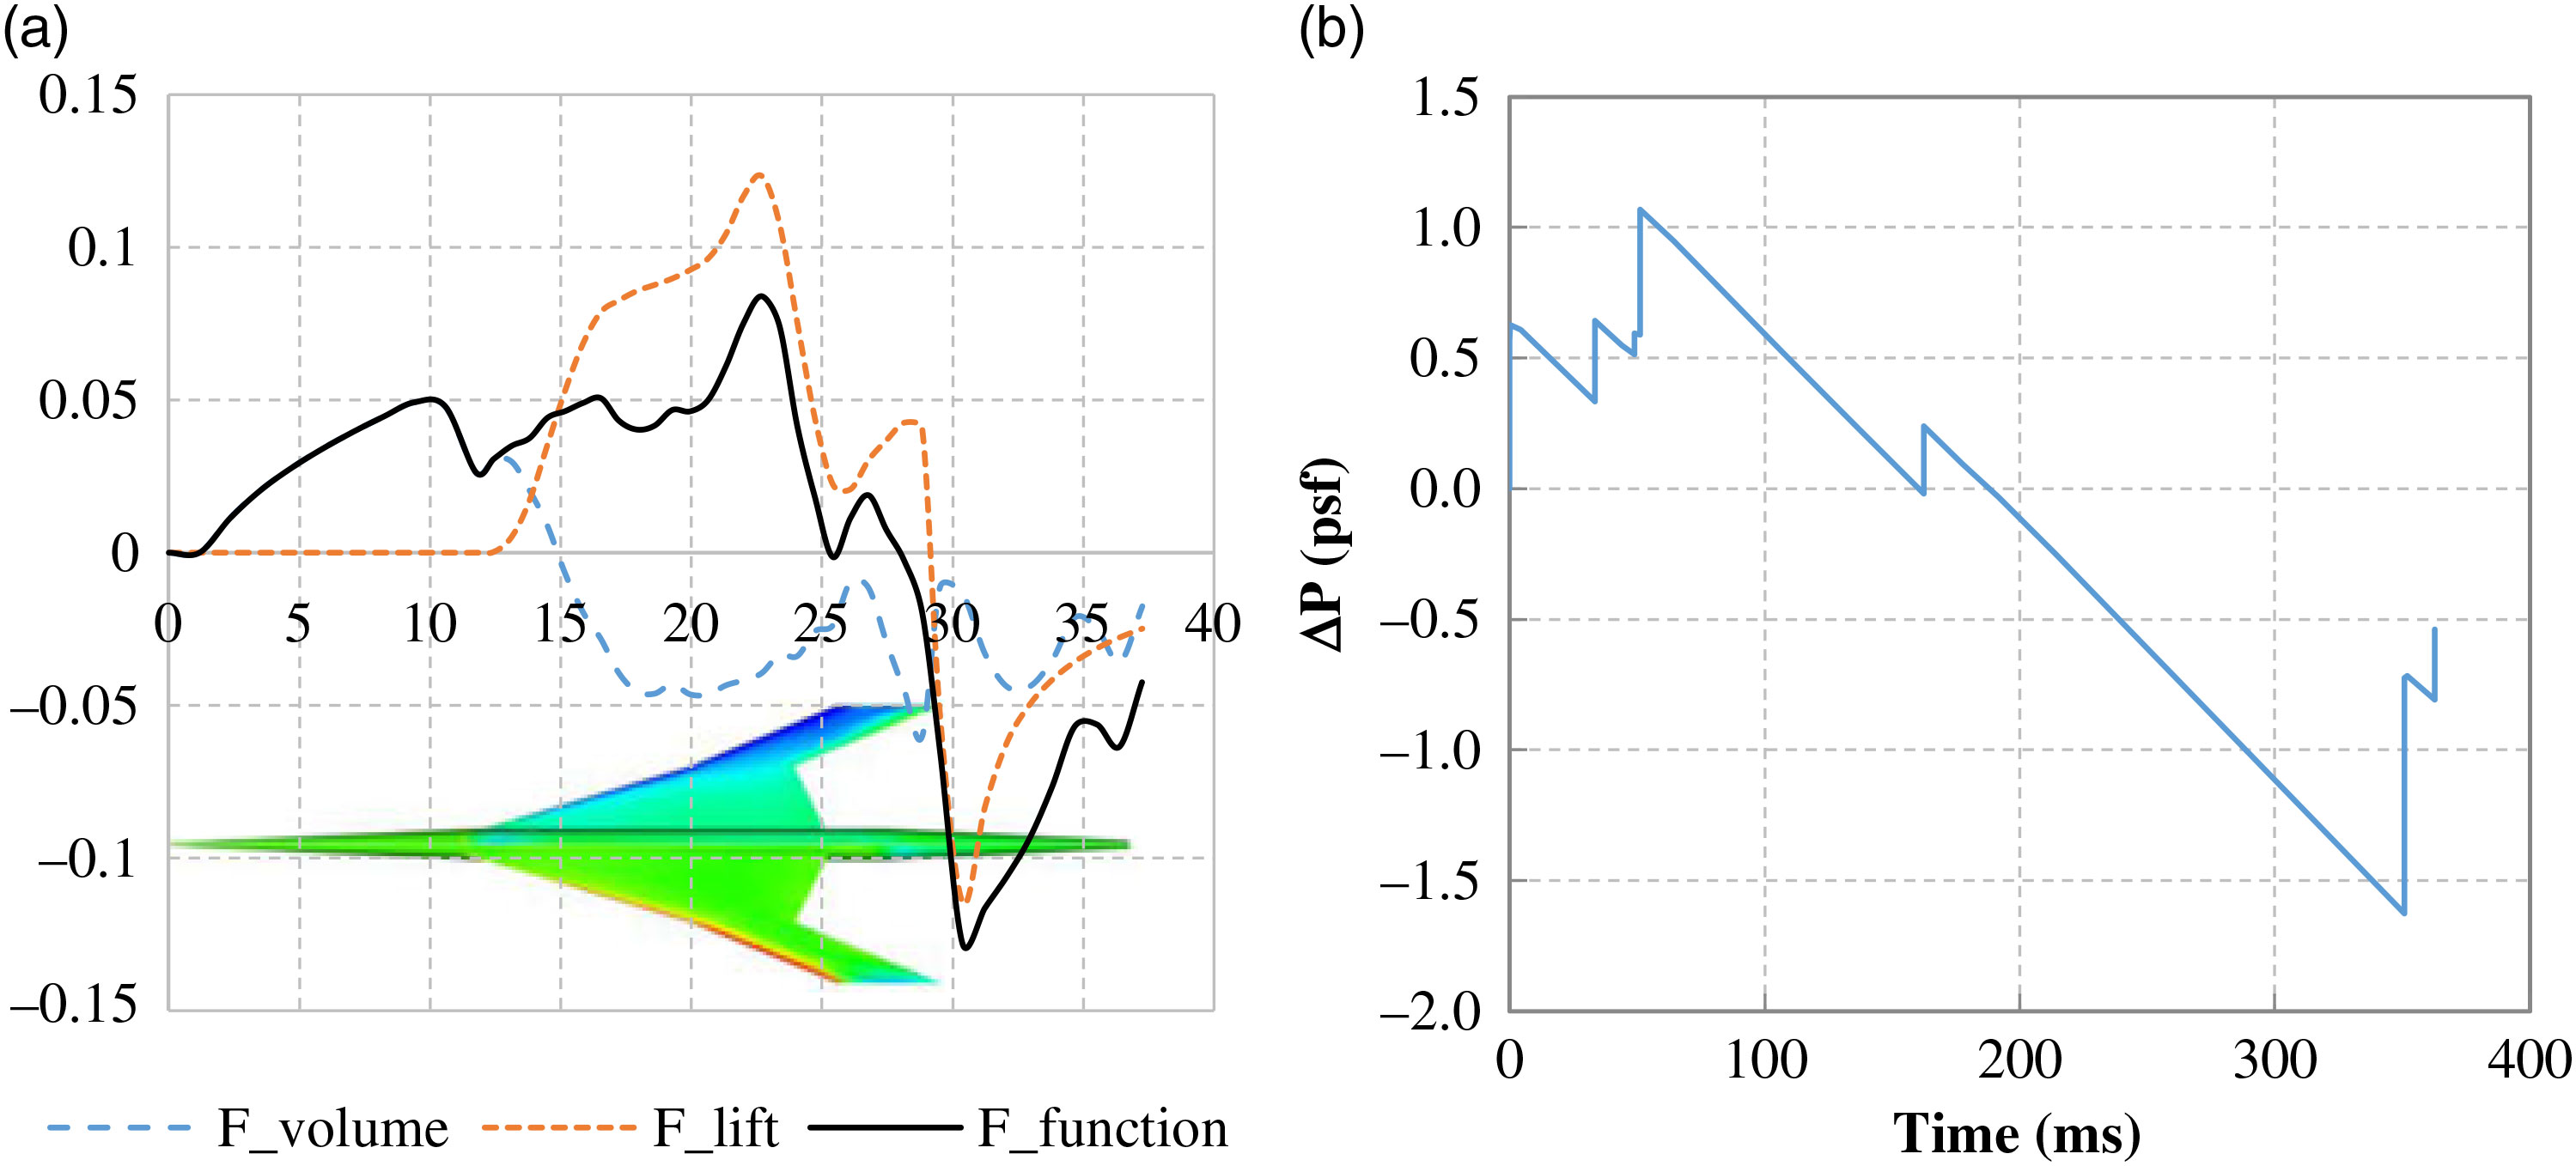
The near-field and ground signatures of Spike S-512 model are plotted in Fig. 13. The main peak comes from the peak of the lift distribution at 26m. This is because the vortex at the wingtip generates negative lift there. The maximum overpressure peak comes from the lift distribution peak. Through a wing geometry optimisation, it is possible to make the lift distribution more uniform to reduce the maximum overpressure.
Near-field and ground signatures of Spike S-512 (a) near-field pressure components and (b) ground boom signature.

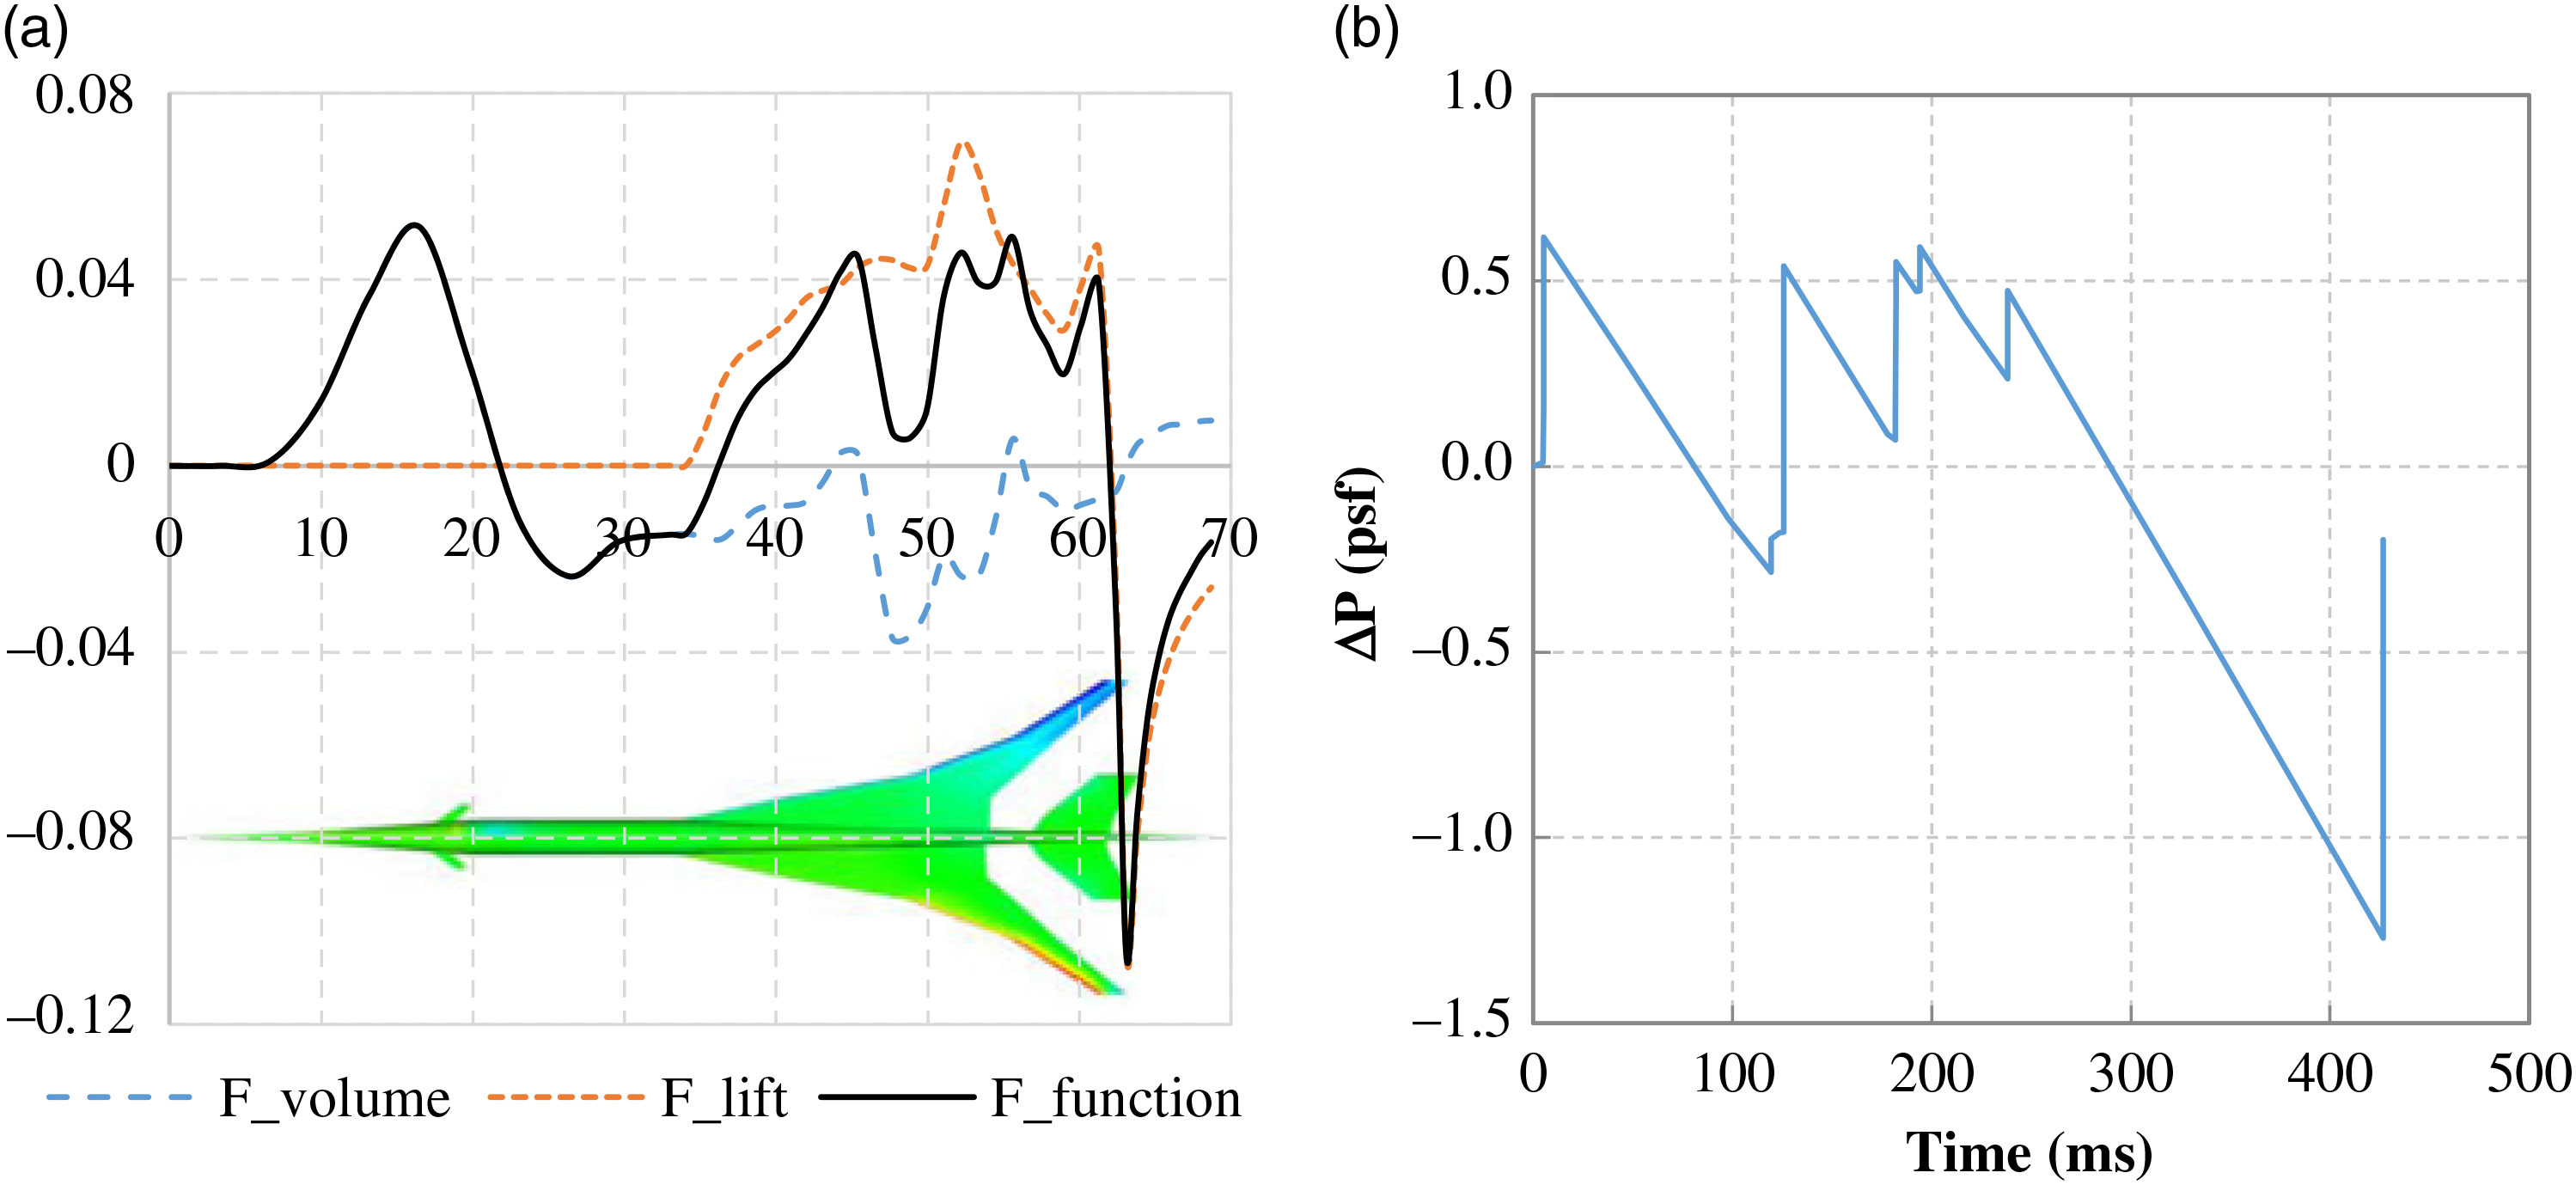
The near-field and ground signatures of HyperMach SonicStar model are plotted in Fig. 14. The main peak comes from the end of the lift distribution at around 63m. The nose volume rate of change forms an overpressure peak at 16.5m that is almost the same height as the lift distribution overpressure peak. To reduce the maximum overpressure, both the nose shape and wing geometry need to be modified. To reduce the maximum underpressure, the aft part of the wing needs to be modified. There is still space for this configuration to reduce sonic boom intensity.
Near-field and ground signatures of HyperMach SonicStar (a) near-field pressure components (b) ground boom signature.

The near-field and ground signatures of Cranfield University E-5 SSBJ model are plotted in Fig. 15. The ground signature indicates the maximum peak value comes from the aft part. In Fig. 15(a), the lift distribution peak and the first derivative of volume distribution overlap to form a high peak at around 41.5m. The canard on top of the wing has a big influence on the lift distribution. This is because the shock wave generated by the canard forms a high-pressure zone on the wing upper surface. Thus, the wing has a negative lift at the canard zone.
Near-field and ground signatures of Cranfield University E-5 SSBJ (a) near-field pressure components and (b) ground boom signature.

The near-field and ground signatures of NASA X-59 QueSST model are plotted in Fig. 16. This configuration is carefully designed to reduce sonic boom intensity. The maximum overpressure peak is almost the same height as the maximum underpressure peak. The lift distribution end peak mismatches with the volume distribution peak.
Near-field and ground signatures of NASA X-59 QueSST (a) near-field pressure components and (b) ground boom signature.

6.3 Overall evaluation
From the above analysis, we have known the design point aerodynamic performance and sonic boom signature of each configuration. However, it is unfair to compare them directly considering their different flight conditions. In fact, it is difficult to compare them under the same mission requirements. The plots of sonic boom intensity (
 $\Delta$
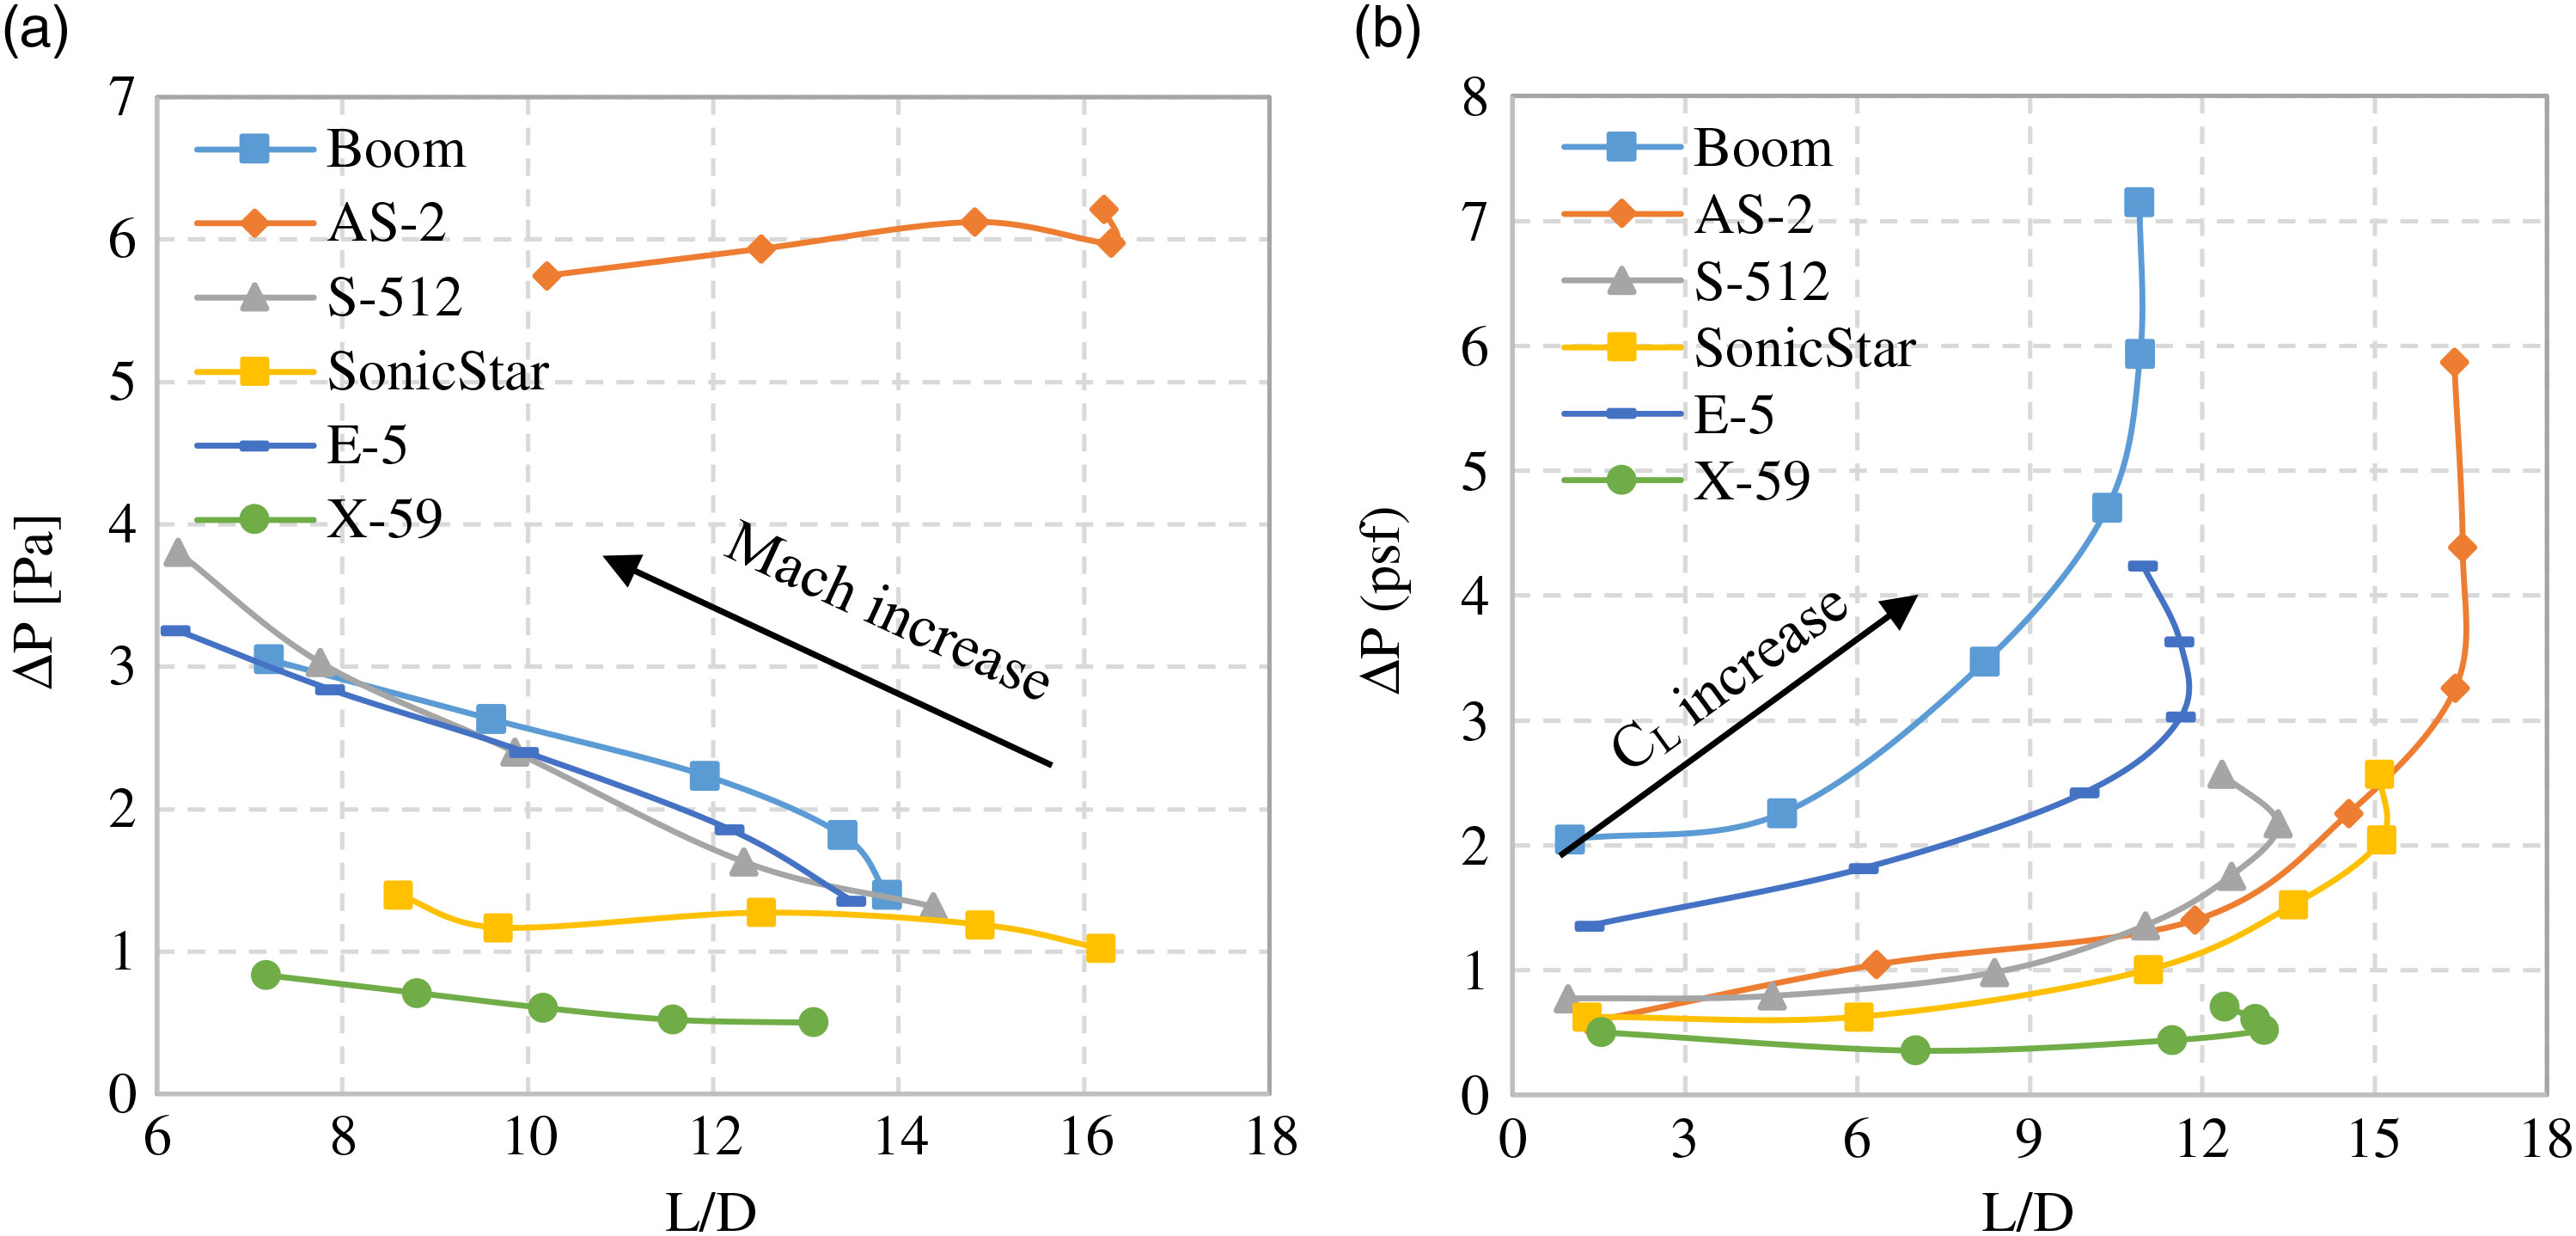
P) and L/D at different Mach numbers (Fig. 17(a)) and different lift coefficients (Fig. 17(b)) give a direct comparison between these configurations and indicate the low-boom low-drag design (bottom right corner of the plots).
Sonic boom intensity (
 $\triangle$
P) and L/D plots (a) Varying Mach number (Mach 1.4 to 2.2) and (b) Varying lift coefficient (
 $\text{C}_{L}$
0.01 to 0.25).

Fig. 17(a) shows that the AS-2 maintains high lift to drag ratio at different Mach numbers because of the supersonic natural laminar flow. However, its sonic boom intensity remains the highest at different Mach numbers. This is due to the concentrated lift distribution along the short wing chord. NASA had similar study(Reference Hunton, Hicks and Mendoza17) on AS-2 like configuration to support the conclusion. The sonic boom intensity of NASA X-59 QueSST remains very low along all Mach numbers. This is because the NASA Quiet Supersonic Technology, as well as the low mass (10,200kg) and the low design Mach number (Mach 1.4).
Fig. 17(b) shows that as the lift coefficient
 $\text{C}_{L}$
increases, the NASA X-59 QueSST is in the lowest sonic boom level whereas its maximum L/D is around 13. The AS-2 has the highest maximum L/D due to the supersonic natural laminar flow.
7.0 LOW-BOOM LOW-DRAG DESIGN PRINCIPLES
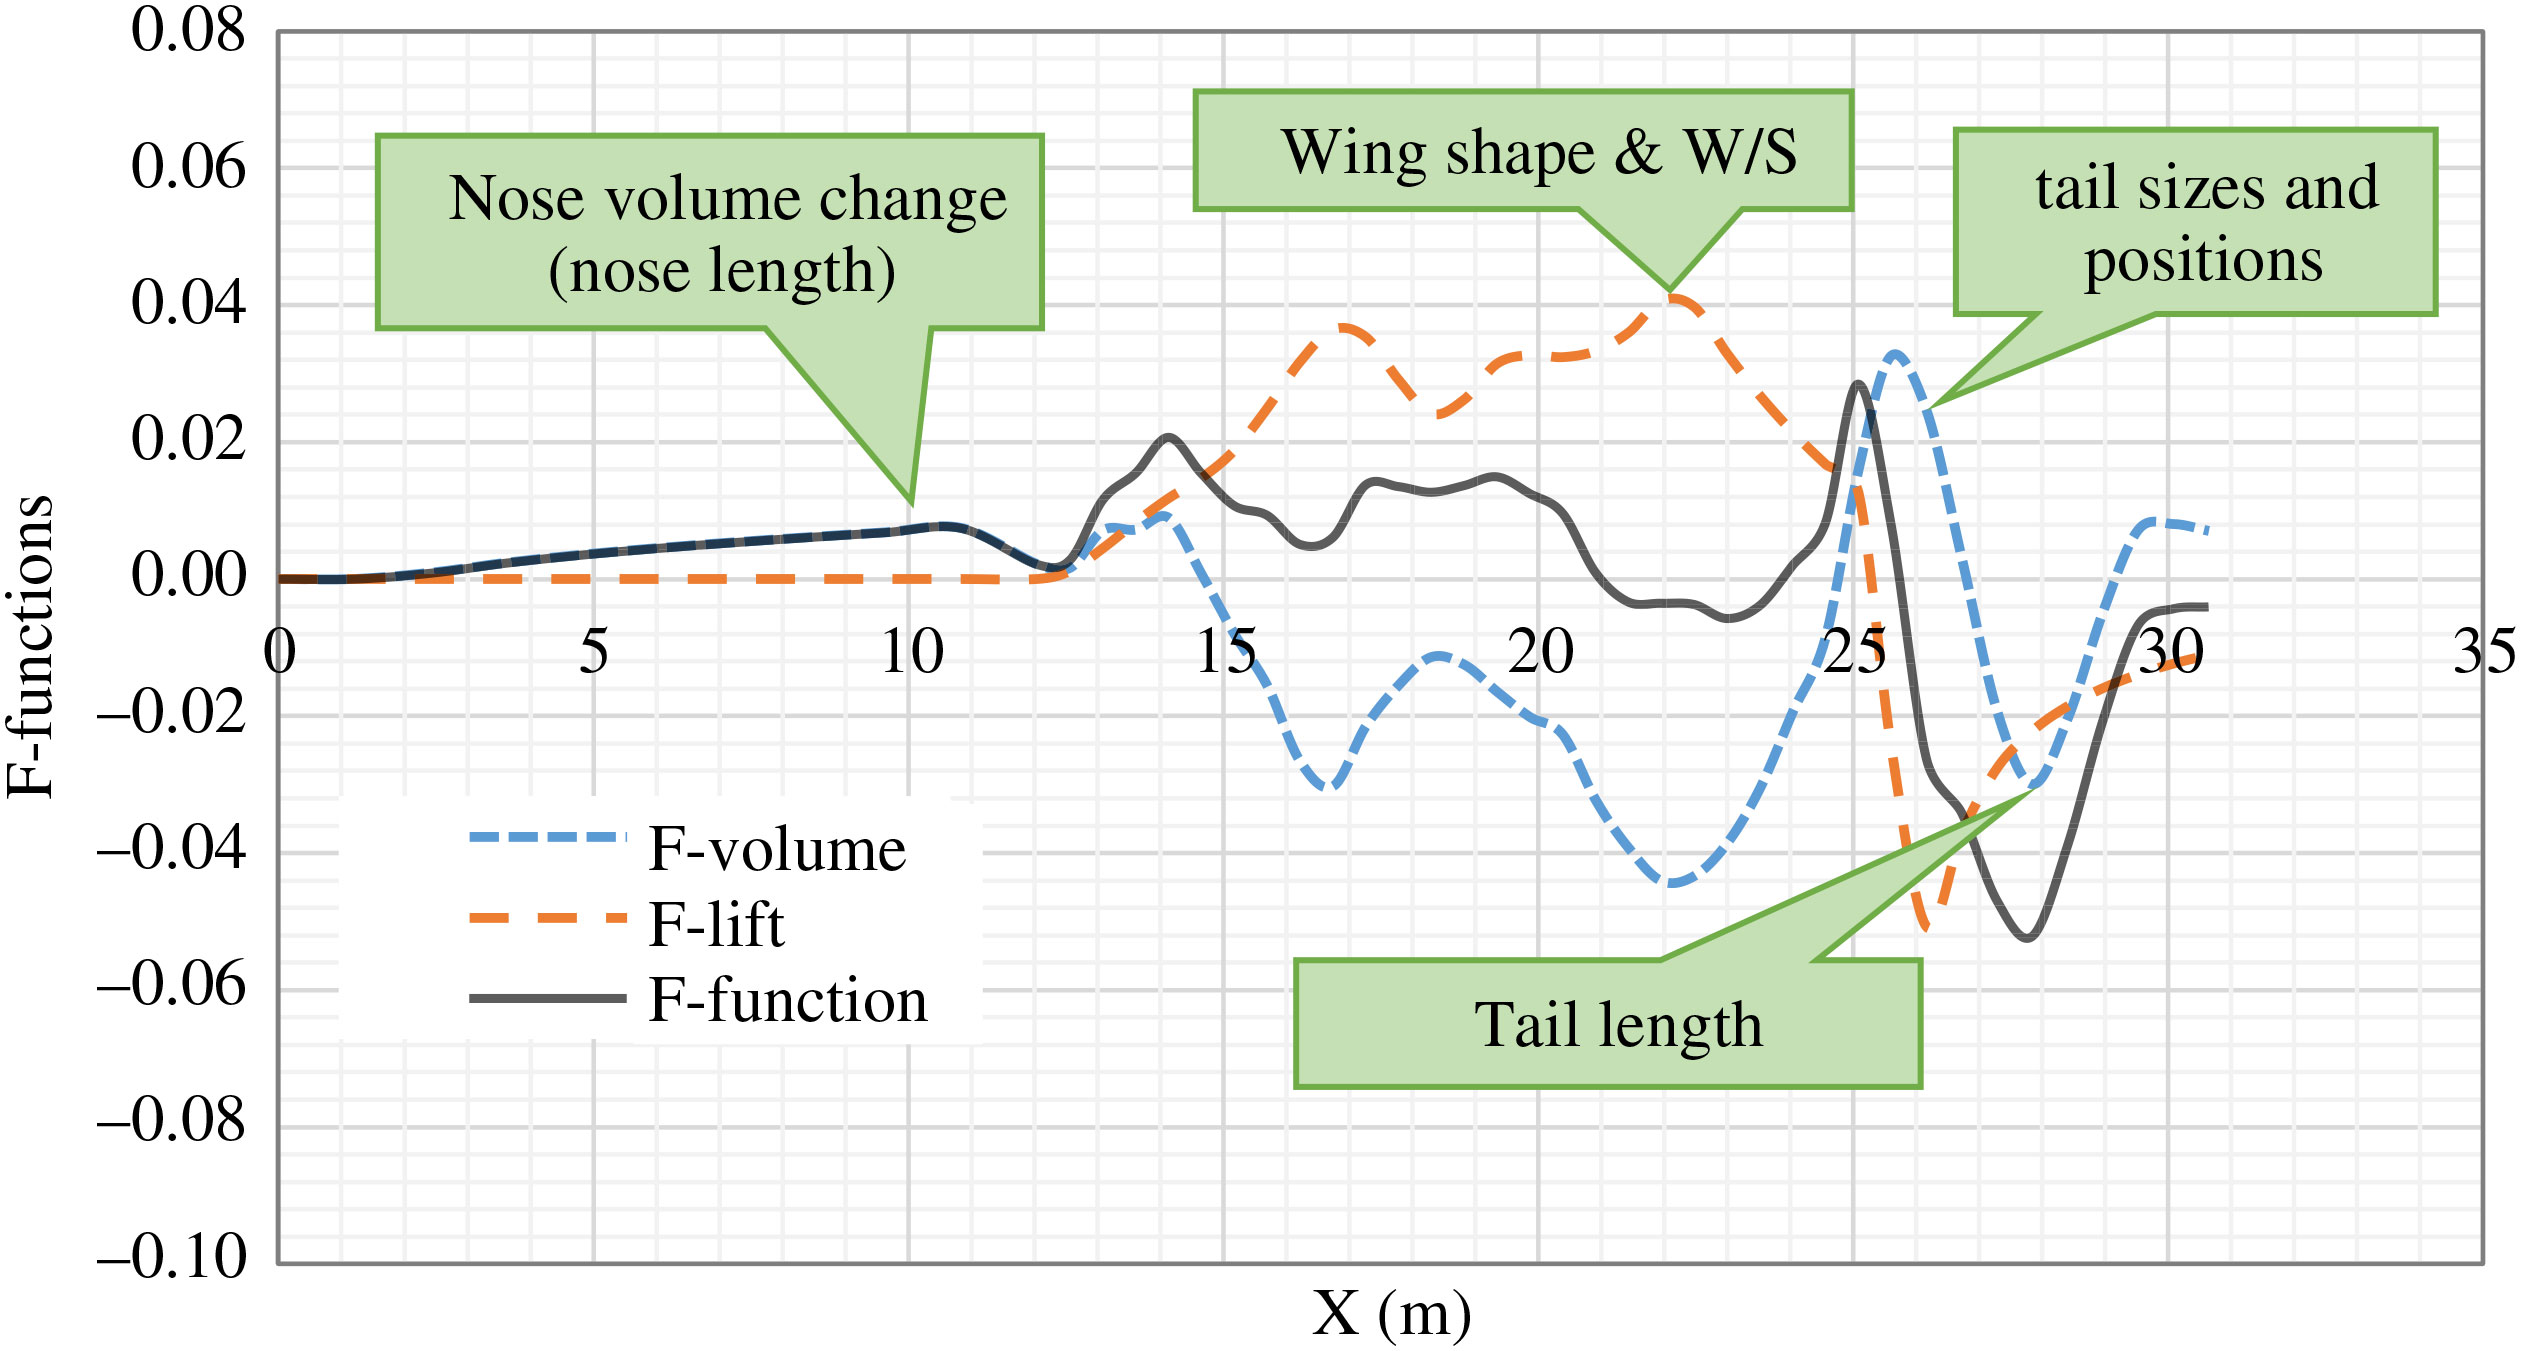
From the above analysis, the ground signature is proportional to the near-field pressure. The near-field pressure is a combination of the volume distribution and the lift distribution. Therefore, the sonic boom intensity can be reduced through the near-field pressure by change the volume distribution and lift distribution. Some design principles for low-boom configuration can be concluded (as illustrated in Fig. 18):
1. A long nose to reduce the volume change at the front
2. A large wing length along the fuselage to make the lift distribution more uniform
3. A long tail boom to reduce the volume change at the back
4. Properly arrange the empennage size and position to avoid the overlap of the peaks generated by the volume and lift separately.
Low-boom design influence factors.

The supersonic drag mainly comes from the friction drag, induced drag and wave drag. The friction drag can be reduced significantly by the supersonic natural or hybrid laminar flow technology. The induced drag is affected by the wing tip design. The wave drag is related to the first derivative of the volume distribution (as blue line illustrated in Fig. 18). Here are some design principles for low-drag design.
1. Hybrid laminar flow control technology to reduce friction drag
2. Properly wing design to reduce induced drag
3. A long nose to mitigate the volume change at the front
4. Aft fuselage shaping together with the empennage size and position to avoid the sharp change of the aft part.
8.0 CONCLUSION AND FUTURE WORK
In this research, we integrate the aerodynamic analysis and sonic boom prediction methods for SSBJ concepts evaluation. These methods are implemented into an MDAO environment called GENUS to facilitate design analysis. The results of these methods show a good match with experimental data and the NASA PCBoom program. Six supersonic airliner concepts are selected to be evaluated in the SSBJ MDAO environment.
Through the aerodynamic analysis, we have studied the aerodynamic coefficients and notice the influence of the mission requirements on the cruise point aerodynamic performance. The wave drag is proportion to the maximum value of the first derivative of the volume distribution. To reduce the wave drag, the aircraft has to be slender without severe volume change. The supersonic laminar flow technology can have an impact on the friction drag and help to improve the aerodynamic efficiency.
In the sonic boom analysis, we evaluate the sonic boom intensity by studying the near-field pressure and ground signatures. We decompose the near-field pressure to the effects of volume distribution and lift distribution and find that the change rate of volume and the lift distribution can influence the sonic boom intensity individually or mutually. We find that the supersonic natural laminar flow wing can result a very high sonic boom intensity due to the concentrated lift distribution.
The F-function method helps to get deep understanding of the volume distribution and lift distribution. Through this study, we conclude some principles for low-boom design and low-drag design, which are important for the development of the next-generation SSBJ and optimisation of current designs.
Future work would include developing a low-boom low-drag configuration based on the current and previous research. A CFD approach can be implanted for higher-fidelity validation of the near-field pressure.