I. INTRODUCTION
Porous materials have found important applications as filters, catalytic supports, and thermal insulators. With present day concerns of energy saving in high temperature industrial processes and buildings, the development of new thermal insulators has become the object of much recent research. Heat transfer through a solid material is essentially controlled by its thermal conductivity in the steady state and by a combination of thermal conductivity and specific heat capacity in transient situations.
Given the lower value of the thermal conductivity of air compared with a solid phase, the incorporation of porosity into a material decreases significantly its effective conductivity. The aim of this paper is to examine the effect of pore volume fraction on the effective thermal conductivity of a porous material composed of an assembly of joined particles such as crystallites.
When a porous nonmetallic solid is subjected to a thermal gradient, heat transfer involves vibrational conduction in the solid phase, conduction by colliding gas molecules in the pore phase, and radiation either through a semi-transparent solid phase or across large pores. For pore sizes less than 5 mm, corresponding to the materials discussed here, convection heat transfer can be neglected.Reference Schulle and Schlegel1 Taking the case of a polycrystalline ceramic material, the solid phase thermal conductivity depends on: (i) the intrinsic thermal conductivity of the grains and (ii) the thermal resistance due to interfaces called grain boundaries. In the temperature range of interest to the present discussion, 20 °C and above, heat is carried across the grain by lattice vibrations and limited by mutual interference in the form of phonon–phonon interactions. Related to the symmetry of the crystalline phase, the grain exhibits isotropic or anisotropic thermal conductivity. At the macroscopic scale, the latter case yields an isotropic response if the grains are randomly oriented in the matrix. However, texturing can result in significant differences in thermal conductivity according to direction. Propagation of lattice vibrations is also hindered by scattering at grain boundaries, where crystallites of different orientations meet. Smaller grain size, which increases the number of grain boundaries per unit length of heat path, decreases the thermal conductivity of the solid phase.Reference Smith, Fayette, Grandjean, Martin, Telle and Tonessen2 But this effect is less significant for highly insulating oxides such as zirconiaReference Yang, Bai, Thompson and Eastman3 or clay-based materials.Reference Michot, Smith, Degot and Gault4 It should also be noted that at high temperatures, grain boundaries attenuate radiation heat transfer through semi-transparent dielectric oxides.Reference Charvat and Kingery5 The choice of solid phase and control of microstructural characteristics are thus key factors in the development of thermally insulating materials.
The presence of porosity in a solid reduces the effective heat carrying cross-section. At the macroscopic scale, analytical relations based on the 2-phase mixture problem can be used to predict the effective thermal conductivity as a function of pore volume fraction. The appropriate choice of a model depends on the spatial distribution of the pore volume in the solid. Illustration is made with examples of porous tin oxide, alumina, and zirconia. We then explore candidate materials for thermal insulation. To obtain thermal conductivity less than 0.1 W/m/K, it is necessary to select a solid phase with an intrinsic thermal conductivity of 1 W/m/K or less combined with a pore volume fraction >90%. This is demonstrated by differences observed in measurements for kaolin-based foams, calcium aluminate foams, and silica aerogels. Though a detailed discussion of high temperature behavior relevant to refractory type applications is beyond the scope of the present paper, it is useful to remark that the 2-phase mixture approach remains valid provided the correct temperature dependences in values of conductivity for the solid and pore phases are known. In fact, many insulating materials (conductivity < 2 W/m/K) exhibit almost constant thermal conductivity or just weak variations from 0 to 1000 °C. However, in the case of the most insulating materials with large pores, the radiation component becomes significant (>5%) especially at higher temperatures and needs to be taken into account. As a final example, experimental results, obtained for a highly porous bioaggregate based on sunflower chaff, are compared with predictions made by numerical simulation with and without a radiation component. Numerical simulation can be used to describe the effect of the microstructure in finer detail than the simplified analytical models.
The paper is organized in the following way. A short discussion of preparation techniques for creating or maintaining porosity in a solid is given. Characterization techniques for the microstructure and the thermal conductivity are then briefly described. Starting from a classical treatment of heat conduction by vibrations in a solid, the modulation of intrinsic thermal conductivity by interfaces and pores is examined. The principal aspects of general behavior are examined with respect to specific examples of results obtained in our laboratory over the last 10 years. These are presented in an order of decreasing thermal conductivity at room temperature. Although concerned primarily with porous ceramic materials, much of the approach can be applied to other porous materials of organic or even metallic origin.
II. METHODS
A. Preparation methods
Different methods can be used (i) to generate porosity in the bulk of ceramic materials and (ii) to control the size, the amount, and the shape of pores. Each method can be used separately or combined with others. The simplest one consists of controlling the firing cycle of a powder compact (green body) obtained by uniaxial pressing. As the maximum temperature of sintering increases, the pore volume fraction decreases progressively with associated changes in the connectivity of the porous phase. In general, an almost completed sintering step exhibits residual closed pores (<5 vol%), whereas the typical pore volume fraction can range from 10 to 45% for incomplete sintering with an increase in the fraction of open pores. The pore volume fraction depends closely on the powder characteristics (particle size distribution, particle packing, nature and amount of sintering additive, morphology of grains, the magnitude of the green body compaction, …). To better control the size and morphology of pores, calibrated fugitive materials can be mixed with the ceramic powder. The removal of these pore former additives, as the temperature of thermal treatment increases, yields perfectly controlled voids. This method allows volume fractions of pores ranging from 35 to 65% to be obtained. To prepare highly porous materials (typically between 65 and 95%) while ensuring the continuity of the solid phase, freeze casting, replica, sacrificial, or direct foaming techniques can be used. For example, the last method has been used to make cellular kaolin-based materials with pore volume fractions >90%. In this case, the microstructure is typically composed of large cavities with thin walls containing windows (open cells). The size and number of these windows between adjacent cells can vary with the processing conditions such as thermal treatment temperature, determining the connectivity of the pore phase.
B. Characterization techniques
Prior to thermal conductivity measurements, pore volume fraction (νp) and morphology of pores (closed or connected) are essential parameters to be carefully determined. νp is usually deduced from (i) the measurement of the bulk or apparent density corresponding to the ratio between the dry weight of specimens (directly shaped or machined to obtain almost perfect geometry such as a cylinder or a parallelepiped) and (ii) the true density measured with a helium pycnometer on the solid phase powder which has been ground and sieved to 50 μm to open any residual closed porosity. Further information can be obtained with mercury porosimetry measurements to determine the size distribution of open porosity. Finally, recent improvements in x-ray tomography techniques (accuracy and data handling) give access to valuable information on the morphology of pores using 2 or 3 dimensional images.
Several experimental techniques have been used to determine the effective thermal conductivity (λ) of porous ceramic materials. Each measurement technique provides access to a range of thermal conductivity values. The choice of a technique has to be made according to the order of magnitude of the thermal conductivity of the porous material, which is controlled by the nature of the solid phase and microstructural factors. The pore size should also influence the choice of a measurement technique. Indeed to get a thermal conductivity value that represents the material, the probed thickness during the measurement must be large compared with the mean pore size. Possible anisotropy has also to be taken into account. Some techniques can give access to the thermal properties in different directions, whereas for others, an isotropic material is assumed. Experimental techniques are often distinguished according to the heat conduction conditions which are considered, steady state or transient state. Results presented in this paper concerning essentially room temperature thermal conductivity were obtained with three techniques: one is based on steady state conditions and the others are based on transient response. Temperature increases are of the order of 5 °C or less.
1. Experimental device operating in steady state conditions
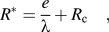
Similar to the guarded hot plate technique, a heat flow apparatus supplied by Captec (France), based on the use of the Fourier’s law in steady state conditions, was used to measure the thermal conductivity of insulating materials (λ < 1.5 W/m/K).Reference Bourret, Prudhomme, Rossignol and Smith6 A thermal gradient is imposed across the sample, which is in the form of square slab (30 × 30 mm), maintained between two copper plates. The upper plate contains a heat source. The temperature difference (ΔT) between the two copper plates and the heat flux density (φ) is obtained with thermocouple sensors in order to calculate the apparent thermal resistance (R*). This apparent thermal resistance for unit area is the sum of two contributions, the thermal resistance of the material, and the thermal contact resistances between the sample and the copper plates described by R c:
 $$R^* = {e \over {\rm{\lambda }}} + R_{\rm{c}} \quad ,$$
where e is the sample thickness. By measuring the apparent thermal resistance of several samples with different thicknesses from 1.5 to 6 mm, the thermal conductivity of a given material is calculated from the slope of the plot R* versus e. The measuring time of about 10 min per sample is long compared with transient techniques.
2. THW method
Another technique which was used to measure the thermal conductivity of insulating materials (λ < 1.5 W/m/K) is the transient hot wire (THW) method. In this technique, a thin metallic wire is placed between two blocks made of the material to be measured. The medium around the wire is thus considered to be infinite. The wire is used, first, as a linear heat source with the Joule effect and, second, as a sensor to monitor the temperature increase by measuring the electrical resistance of the wire. At t < 0, the solid is in thermal equilibrium at T = T 0. From time t = 0, an electrical current is imposed through the wire which generates a heat flux per unit length q. The evolution of the wire temperature depends on the thermal conductivity of the material. The solution of the heat equation considering a homogeneous and isotropic material was given by Carslaw and JaegerReference Carslaw and Jaeger7:
 $${\rm{\Delta }}T\left( t \right) =\, {q \over {4{\rm{\pi \lambda }}}}\,\ln \left( t \right) + K\quad ,$$
where ΔT(t) = T(t) − T 0, is the temperature increase of the wire, q is the heat flux per unit length generated by the wire, and K is a constant. The first part of the response is not linear due to thermal contact resistances.Reference Assael, Dix, Gialou, Vozar and Wakeham8 The thermal conductivity is then calculated from the slope of the linear portion of the curve: ΔT = f(ln(t)). The order of magnitude of the probing depth of heat penetration is 10 mm around the wire. Typical sample dimensions are 100 × 50 × 25 mm. The measuring time can be less than 1 min.
Thermal conductivity was also measured with a very similar technique based on the same principle but with a planar heat source. For this transient plane source technique a commercial device supplied by Hot Disk AB in Sweden was used. In this technique developed by Gustafsson, the probe comprised a nickel spiral sandwiched between two films of an insulating material is assimilated into a disk.Reference Gustafsson9
3. Laser flash method
The laser flash method can be used to measure the thermal diffusivity in the range from 10−7 to 10−3 m2/s. In our case, the flash source is a neodymium-glass laser operating at 1.053 μm. This laser, which delivers a standard pulse of 30 J in 450 μs, was used to heat up the front face of the cylindrical sample. The absorbed heat diffuses throughout the sample, and a liquid-nitrogen-cooled infra-red detector (Hg-Cd-Te) was used to monitor the evolution of the back face temperature. Samples were coated with a thin graphite layer to increase the emissivity of the receiving and emitting faces. Thermal diffusivity was calculated by using Degiovanni’s expressionsReference Degiovanni10 which take into account the heat losses from the sample during the experiment compared with the simpler Parker expression which only considers adiabatic conditions.Reference Parker, Jenkins, Butler and Abbott11 The calculation requires the thickness of the sample and times to reach a given fraction of the maximum temperature. Typically disk samples were used with 10 mm in diameter and a thickness between 1 and 3 mm. The thermal diffusivity (α) is measured in one direction, i.e., perpendicular to the disk faces. In the case of an anisotropic material, measurements could be performed in different directions by preparing samples accordingly. The measuring time is just a few seconds. The thermal conductivity was then calculated by using the relation:
 $${\rm{\lambda }} = {\rm{\alpha \rho }}c\quad ,$$
where ρ is the bulk density and c is the specific heat of the material.
Finally, the main characteristics of these three techniques are summarized in Table I to guide choice for a given material. For example, the laser flash technique is appropriate for a material with pore size <500 μm but the hot wire or hot disk techniques, using larger dimension test samples, are preferred for pore size >500 μm.
Principle characteristics of techniques used for thermal conductivity (λ) and thermal diffusivity (α) measurements.

III. HEAT CONDUCTION IN A POROUS SOLID
A. Intrinsic thermal conductivity
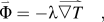
For a homogeneous isotropic medium subjected to a thermal gradient, the heat flow density  $(\mathord{\buildrel{\lower3pt\hbox{$\scriptscriptstyle\rightharpoonup$}}\over \Phi} )$ at a position (x, y, z) is described by Fourier’s law:
 $$\mathord{\buildrel{\lower3pt\hbox{$\scriptscriptstyle\rightharpoonup$}}\over \Phi} = - {\rm{\lambda }}\mathord{\buildrel{\lower3pt\hscale285%{$\scriptscriptstyle\rightharpoonup$}}\over {▽ T} }\quad ,$$
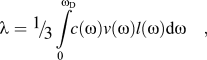
where λ is the thermal conductivity with units W/m/K and T is the temperature at (x, y, z). In the case of nonmetallic crystalline solids (majority of materials discussed in the present paper), it is the lattice vibrations often termed “phonons” which carry heat. By analogy with the kinetic theory of gases, the thermal conductivity, described as a phonon gas, is given by the expression:
 $${\rm{\lambda }} = {\raise0.7ex\hbox{$1$} \!\mathord{\left/ {\vphantom {1 3}}\right.\kern-\nulldelimiterspace}\!\lower0.7ex\hbox{$3$}}\mathop \int \limits_{\rm{0}}^{{\rm{\omega }}_{\rm{D}} } \!\!\!c\left( {\rm{\omega }} \right)v\left( {\rm{\omega }} \right)l\left( {\rm{\omega }} \right){\rm{d\omega }}\quad ,$$
where c(ω)dω represents the contribution to the heat capacity of vibrational modes with frequencies from ω to ω + dω,ν(ω) is the group velocity (speed of sound in the low frequency limit), l(ω) is the mean free path of the phonons and ωD is the Debye frequency.Reference Klemens12
As an example, in the temperature range from 50 to 800 K, starting at a high value, the thermal conductivity of a crystalline solid such as alumina decreases strongly with temperature due to the increase of mutual interference of lattice vibrations (or phonon–phonon interactions) which limit the mean free path.Reference Charvat and Kingery5,Reference Berman13 In contrast, the thermal conductivity of yttria-stabilized zirconia starts at a low value (approximately 2.2 W/m/K at 300 K) and only varies slightly with temperature.Reference Raghavan, Wang, Dinwiddie, Porter and Mayo14 This again can be explained by the mean free path, which for zirconia has been strongly reduced by the presence of oxygen vacancies acting as phonon scattering centers. The extreme case is of course a disordered solid such as silica glass, where the mean free path is essentially the interatomic distance and almost invariant with temperature.Reference Kittel15
In general, differences of intrinsic thermal conductivity between solids can be related to the crystalline or noncrystalline structures and evolution of mean free path, as well as the rigidity/elastic constants of the solid and atomic masses which control ν(ω). Similar principles will hold for organic solids.
B. Thermal resistance of interfaces
The microstructure of a ceramic material can be simplified to a 3-dimensional lattice of cubic cells. As a convenient approximation, all the grain boundaries can be grouped together as one resistance and all the crystallite cells can be grouped as another resistance. Such an approach (the brick layer model) is well known in a.c. impedance studies of polycrystalline ceramics.Reference Fleig and Maier16 The thermal conductivity (λs) can then be written
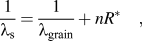 $${1 \over {{\rm{\lambda }}_{\rm{s}} }} = {1 \over {{\rm{\lambda }}_{{\rm{grain}}} }} + nR^* \quad ,$$
where λgrain is the grain (or crystallite) thermal conductivity, n is the number of grain boundaries per unit length of heat path and R* is the thermal resistance for a grain boundary of unit area. In practice, n can be estimated from micrographs with the linear intercept method. For a heat path of length L (straight line drawn on micrograph)
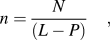 $$n = {N \over {(L - P)}}\quad ,$$
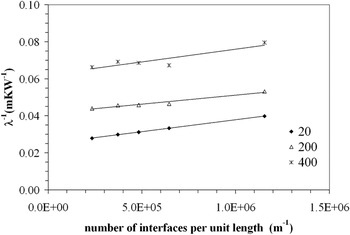
where N is the number of grains and P is the pore length crossed by the line. Samples of dense tin oxide were prepared with different average grain sizes by variation of the sintering temperature and time.Reference Smith, Grandjean, Absi, Founyapte Tonyo and Fayette17Figure 1 shows a plot of the inverse thermal conductivity values versus n for these samples of tin oxide at 3 different temperatures. These data sets confirm the validity of Eq. (6). The average grain boundary thermal resistance for a polycrystalline material can be calculated directly from the slope and in this case yields 1.3 × 10⁻⁸ m²K/W at 20 °C and after a small correction for porosity, 1.2 × 10⁻⁸ m²K/W. Furthermore, the grain boundary thermal resistance is essentially constant as a function of temperature consistent with a theoretical study.Reference Young and Maris18 Similar behavior is observed for alumina, and a value of 1.0 × 10⁻⁸ m²K/W for 100% dense material at 20 °C is obtained. Other workers have reported a value of 0.5 × 10⁻⁸ m²K/W for yttria-stabilized zirconia.Reference Yang, Bai, Thompson and Eastman3
Inverse thermal conductivity versus number of interfaces per unit length for dense tin oxide (0.5 wt% MnO2) at 20, 200, and 400 °C.

Consequently, variation of grain size controlling the number of interfaces along the heat path can significantly modulate the effective thermal conductivity of the solid phase (λs).
C. Effective thermal conductivity of porous solids
For the purposes of the present paper examining mostly room temperature values, in a first essential approach, radiation heat transfer is neglected and just relations describing heat conduction in the solid and gas phases are considered. Predictions of the effective thermal conductivity with the incorporation of the more insulating pore phase can be treated in terms of the classic two-phase mixture problem. Geometry in terms of pore shape and connectivity determines the choice of the most appropriate analytical relation. A useful review of two-phase models for cellular materials has been made by Collishaw and Evans.Reference Collishaw and Evans19 The simplest approach treats the solid and pore phases as thermal resistors in parallel with the relation
 $${\rm{\lambda }} = {\rm{\lambda }}_{\rm{s}} \left( {1 - {\rm{\nu }}_{\rm{p}} } \right) + {\rm{\nu }}_{\rm{p}} {\rm{\lambda }}_{\rm{p}} \quad ,$$
where λp is the pore thermal conductivity and νp is the pore volume fraction. Eq. (8) is also the rule of mixtures and fixes an upper limit to the combination of the two phases on the basis that they do not interact with each other and can be attributed with the same response at all length scales. If λp << λs, the simplification λp = 0 yields Loeb’s relation,Reference Loeb20
 $${\rm{\lambda }} = {\rm{\lambda }}_{\rm{s}} \left( {1 - \nu _{\rm{p}} } \right)\quad ,$$
and is often a very useful approximation for small (νp < 0.1) or, perhaps surprisingly, very high amounts (νp > 0.9) of porosity. More strictly, when the pore volume fraction is less than 15% in the form of closed pores dispersed uniformly in the solid matrix, the thermal conductivity can be described by the Maxwell–Eucken relation or equivalently the Hashin–Shtrikman upper boundReference Maxwell21,Reference Hashin and Shtrikman22
 $${\rm{\lambda }} = {\rm{\lambda }}_{\rm{s}} {{{\rm{\lambda }}_{\rm{p}} + 2{\rm{\lambda }}_{\rm{s}} + 2{\rm{\nu }}_{\rm{p}} \left( {{\rm{\lambda }}_{\rm{p}} - {\rm{\lambda }}_{\rm{s}} } \right)} \over {{\rm{\lambda }}_{\rm{p}} + 2{\rm{\lambda }}_{\rm{s}} - {\rm{\nu }}_{\rm{p}} \left( {{\rm{\lambda }}_{\rm{p}} - {\rm{\lambda }}_{\rm{s}} } \right)}}\quad .$$
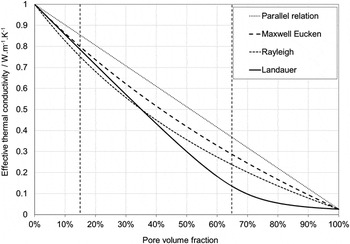
In fact, in this range (νp < 0.15), most relations—Maxwell–Eucken, Landauer, Rayleigh—give close results as shown in Fig. 2. The curve marked as Rayleigh refers to cylindrical obstacles with their axes placed perpendicular to heat flow.Reference Rayleigh23
Predicted values of effective thermal conductivity as a function of pore volume fraction according to the Maxwell–Eucken relation, the Landauer relation, and the Russell Rayleigh relation.

Compared with equiaxed closed pores, in the range νp = 0.15 to 0.65, connectivity of the pore phase (i.e., open porosity) leads to a stronger dependence of thermal conductivity on pore volume fraction. This has been described successfully by Landauer’s relation based on effective medium percolation theory,Reference Landauer24
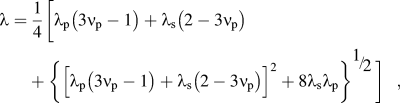 $$\!{\rm{\lambda }} = \,{1 \over 4}\left[ {{\rm{\lambda }}_{\rm{p}} \left( {3{\rm{\nu }}_{\rm{p}} - 1} \right) + {\rm{\lambda }}_{\rm{s}} \left( {2 - 3{\rm{\nu }}_{\rm{p}} } \right) + \left\{ {\left[ {{\rm{\lambda }}_{\rm{p}} \left( {3{\rm{\nu }}_{\rm{p}} - 1} \right) + {\rm{\lambda }}_{\rm{s}} \left( {2 - 3{\rm{\nu }}_{\rm{p}} } \right)} \right]^2 + 8{\rm{\lambda }}_{\rm{s}} {\rm{\lambda }}_{\rm{p}} } \right\}^{{\raise0.7ex\hbox{$1$} \!\mathord{\left/ {\vphantom {1 2}}\right.\kern-\nulldelimiterspace}\!\lower0.7ex\hbox{$2$}}} } \right] ,$$
or a simple exponential relation proposed by Pabst et al.Reference Ticha, Pabst and Smith25
Further increase of porosity (νp > 0.65) requires a continuous solid phase to be maintained in the material for acceptable mechanical strength. This condition becomes a limiting factor toward the improvement of thermal performance for insulation. It also implies changes in the geometry of appropriate physical models describing the effect of pore volume fraction. For example, Landauer’s expression implicitly assumes breaks in the solid pathways for νp > 0.7, which does not correspond to the physical reality of a porous material with mechanical strength. Consequently, for the present work, we focus again on the Hashin–Shtrikman upper bound to describe the effect of large spherical pores with thin walls and Russell’s relation,
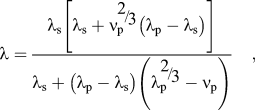 $${\rm{\lambda }} = {{{\rm{\lambda }}_{\rm{s}} \left[ {{\rm{\lambda }}_{\rm{s}} + {\rm{\nu }}_{\rm{p}}^{{\raise0.7ex\hbox{${\rm{2}}$} \!\mathord{\left/ {\vphantom {{\rm{2}} {\rm{3}}}}\right.\kern-\nulldelimiterspace}\!\lower0.7ex\hbox{${\rm{3}}$}}} \left( {{\rm{\lambda }}_{\rm{p}} - {\rm{\lambda }}_{\rm{s}} } \right)} \right]} \over {{\rm{\lambda }}_{\rm{s}} + \left( {{\rm{\lambda }}_{\rm{p}} - {\rm{\lambda }}_{\rm{s}} } \right)\left( {{\rm{\lambda }}_{\rm{p}}^{{\raise0.7ex\hbox{$2$} \!\mathord{\left/ {\vphantom {2 3}}\right.\kern-\nulldelimiterspace}\!\lower0.7ex\hbox{$3$}}} - {\rm{\nu }}_{\rm{p}} } \right)}}\quad ,$$
which is a parallel/series resistor approach used to describe the effect of a cubic pore in a matrix.Reference Russell26 These correspond to closed cellular structures, whereas for open cellular structures, AshbyReference Ashby27 has also proposed a simple relation based on the rule of mixtures assuming that one-third of the struts lie in the heat flow direction,
 $${\rm{\lambda }} = {1 \over 3}\left( {1 - {\rm{\nu }}_{\rm{p}} } \right){\rm{\lambda }}_{\rm{s}} + {\rm{\nu }}_{\rm{p}} {\rm{\lambda }}_{\rm{p}} \quad .$$
For a highly porous solid, comparison of predictions with Eq. (13) to those with Eq. (12) or Eq. (10) confirms that open cells are more insulating than closed cells.
The analytical relations predict the effective thermal conductivity of a porous solid according to different simplified pore geometries and only require the parameters λs, λp, and νp. Pore size has no specific role in Eqs. (8)–(13). However, two situations occur for which λp can take a modulated value. As a starting point, it can be noted that the values of thermal conductivity of air attributed to λp increase slightly with temperature from 0.026 W/m/K at 20 °C to 0.080 W/m/K at 1000 °C. In the first situation, these values decrease for small pores (<500 nm across) due to the Knudsen effect. In essence, the mean free path of the gas molecules is limited by collisions with the pore walls. Assuming a representative (average) pore size is determined, a modulated value of λp can be calculated using the Knudsen number.Reference Collishaw and Evans19, Reference Litovsky, Shapiro and Shavit28 As an example, at a gas pressure of 1 atmosphere, Litovsky’s relation yields a decrease of 10% in λp for a pore size of 500 nm. Though experimental data in literature is scarce concerning the Knudsen effect in porous materials with pore sizes in the range of 100–500 nm, results reported by Reichman et al.Reference Reichenauer, Heinemann and Ebert29 on fumed silica (average pore size = 300 nm) provide useful supporting evidence. For a highly porous material with very small pores (<100 nm) such as silica aerogel, a measured value of effective thermal conductivity = 0.014 W/m/K, at 1 atmosphere and 20 °C, can only be explained by a strongly reduced value of gas thermal conductivity.Reference Zeng, Stevens and Hunt30
The second situation where pore size has a role concerns radiation heat transfer across large pores (>100 μm). Such an additional contribution in parallel to gas conduction needs to be taken into account for thermal insulation when the overall thermal conductivity is very low <0.1 W/m/K and/or at higher temperature. Even if simplified, this can be understood through Loeb’s expression of an equivalent thermal conductivity due to radiation across the pore
 $${\rm{\lambda }}_{{\rm{p,\,rad}}} = 4{\rm{\varepsilon }}\gamma {\rm{\sigma }}dT^3 \quad ,$$
where ε is the emissivity, σ is the Stefan–Boltzmann constant, d is the pore dimension in the heat flow direction and γ is a pore shape factor.Reference Loeb20 For spherical pores, γ = 2/3. A very complete theoretical approach to radiation heat transfer in cellular solids has been developed by Baillis and Coquard.Reference Baillis and Coquard31
Though not all features of heat transfer through a porous solid with a complex microstructure are handled in a satisfactory manner, Eqs. (6)–(14) allow very useful calculations to be made, which can be sufficient for many purposes. A more detailed approach requires numerical simulation, using for example finite element analysis on an artificially generated microstructure. Specific examples are now used to illustrate the application of these various relations to predict thermal conductivity as a function of pore volume fraction in the range νp < 0.15, 0.15 < νp < 0.65, and νp > 0.65.
IV. SPECIFIC EXAMPLES
A. Porosity <65%
1. Tin oxide
For ceramics made with standard processing, the firing cycle conditions in terms of temperature and duration are generally chosen to achieve a maximum density for a minimum energy input. The residual pore volume fraction is usually less than 10% and closed; that is, dispersed inclusions. Equations (9)–(12) can all give useful predictions but the Maxwell–Eucken relation for spherical inclusions is often preferred. In fact, at the end of sintering, both densification and grain growth take place, and the latter process, inducing grain size variations, can affect the thermal conductivity of conducting ceramics more significantly than slight variations in pore volume fraction.
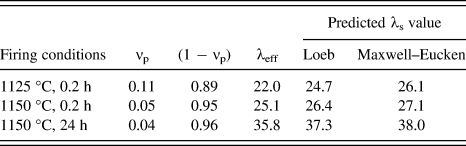
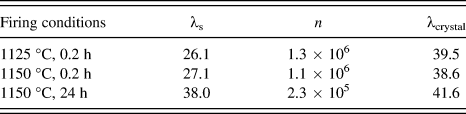
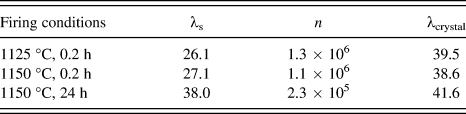
We illustrate this for the case of tin oxide ceramics which have been fired to almost full density with the addition of a sintering additive, 0.5 wt% MnO2. Table II gives the firing conditions, pore volume fraction, and the measured thermal conductivity values of the slightly porous ceramics.Reference Grandjean32 Loeb’s relation [Eq. (9)] and a simplified version of Eq. (10) (Maxwell–Eucken) obtained by putting λp = 0 have been used to calculate the equivalent thermal conductivity of 100% dense tin oxide ceramics. Results between the two relations differ by 5% or less. However, the variation between these samples due to grain size variation and the effect of grain boundary thermal resistance is much stronger. The last column in Table II gives 26.1 W/m/K for small average linear grain size (0.8 μm) to 38 W/m/K for larger average linear grain size (4.3 μm). Using the Maxwell–Eucken values from Table II, Table III gives an estimate of the crystallite thermal conductivity λcrystal based on Eq. (6) and assuming a grain boundary thermal resistance of 1 × 10⁻⁸ m²K/W. The values, close to 40 W/m/K, are consistent with work showing high values for single crystals.Reference Turkes, Pluntke and Helbig33
Pore volume fractions and room temperature thermal conductivity values of tin oxide ceramics containing 0.5 wt% MnO2. Predicted thermal conductivity values (λs) for 100% dense ceramics.

Extrapolated values of room temperature thermal conductivity for equivalent 100% dense tin oxide ceramics (λs). Number of grain boundaries per unit length of heat path (n). Estimation of crystallite thermal conductivity with Eq. (6).
2. Alumina
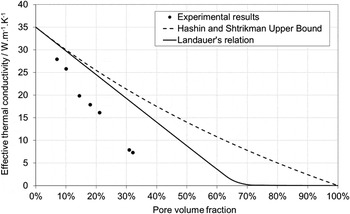
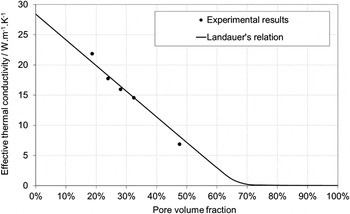
Another example of grain size effects in porous ceramics is given by alumina. Different firing cycles were used to generate pore volume fractions for 7–30%.Reference Smith, Fayette, Grandjean, Martin, Telle and Tonessen2 The corresponding thermal conductivity values, plotted in Fig. 3, are significantly lower than those predicted by Landauer’s relation [Eq. (11)] using a value of 35 W/m/K for λs. The apparently stronger dependence on pore volume fraction can be explained by variation in grain size from 0.6 μm for the most porous sample (30%) to 2 μm for the least porous sample (7%) associated with a grain boundary thermal resistance. In another set of samples, the alumina ceramics were made with starch casting by the ICT Prague group (Pabst et al.Reference Zivcova, Gregorova, Pabst, Smith, Michot and Poulier34), allowing variation of pore volume fraction to be achieved while maintaining the same firing cycle. Consequently, all samples had the same average grain size of 1.8 μm. Using Eq. (6) and a grain boundary thermal resistance of 1.2 × 10⁻⁸ m²K/W, a value for λs of 28.4 W/m/K is calculated for these alumina ceramics with up to 45% pore volume fraction. This yields a nice agreement between predicted and experimental values shown in Fig. 4.
Thermal conductivity at 20°C versus pore volume fraction for alumina ceramics compared with predicted values using Eq. (11).

Effective thermal conductivity at 20°C versus pore volume fraction for alumina ceramics with a fixed grain size of approximately 1.8 μm.

3. Zirconia (made with pore former)
Grain size effects should be less dramatic in more insulating solid phases such as zirconia or clay and these are the next examples that are examined.
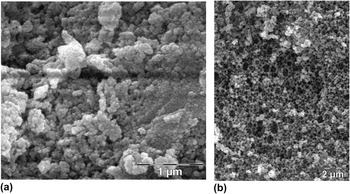
Two sets of zirconia samples were prepared with two different processes using pore-forming agents. In the first process described in Ref. Reference Nait-Ali, Haberko, Vesteghem, Absi and Smith35, an 8 mol% yttria-stabilized zirconia suspension was mixed with a polymer powder. Zirconia crystallites of about 6 nm form agglomerates with a mean size of 1 μm. The mean particle size of the polymer in water is between 1 and 5 μm depending on the dilution. After drying the mixture, samples were uniaxially pressed at 100 MPa and fired at different temperatures between 750 and 1100 °C to vary the pore volume fraction. These samples exhibit a heterogeneous microstructure with a bimodal pore size distribution, constituted by mesopores (below 50 nm) and macropores (above 50 nm). Macropores correspond to the removal of the pore-forming agent. In a second process, a hydrothermally synthesized monoclinic zirconia was mixed with a vinyl acetate base latex, following a heterocoagulation strategy. Zirconia and polymer particles have surface charges of opposite sign and a mean size of respectively 65 and 300 nm. As a result, polymer particles were surrounded by zirconia due to electrostatic attraction. Suspension mixtures were dried on a Mylar film and samples were fired at 1100 °C. Since polymer particles were used as a pore-forming agent, the arrangement of the voids is the result of the organization of both zirconia and the polymer particles in the mixture. These samples exhibit a monomodal pore size distribution and a well-organized porous structure. The final microstructures of these samples are shown in the micrographs in Fig. 5.
Scanning electron microscope observation of a fracture of porous zirconia materials. (a) Heterogeneous microstructure. (b) Cellular material obtained via heterocoagulation process.

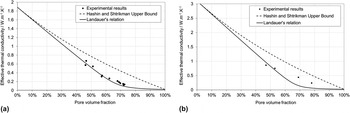
The measured effective thermal conductivity as a function of the pore volume fraction is compared with the predictions made from the analytical models in Fig. 6. For pore volume fraction below νp = 0.65, experimental results agree closely with values calculated with Landauer’s relation [Eq. (11)] for both the heterogeneous and the well-organized porous network. For pore volume fractions exceeding νp = 0.65, i.e., above the percolation threshold, the behavior of the thermal conductivity depends strongly on the microstructure. For the heterogeneous porous samples, experimental results are close to predictions of Eq. (11) but slightly above. A better agreement was obtained by taking into account the bimodal pore size distribution in a two-step calculation with Landauer’s expression.Reference Nait-Ali, Haberko, Vesteghem, Absi and Smith35 For samples with an organized porosity, experimental values lie between the Hashin and Shtrikman upper bound and Landauer’s relation. This can be explained by the geometric simplifications made in percolation theory. According to this approach applied to heat conduction, above the percolation threshold, νp > 0.65, there are breaks in the solid pathways due to the assumption of random grain positions. Consequently, heat diffuses with more and more difficulty through the material, and the effective thermal conductivity is governed by the gas phase. However, real cellular samples preserve continuous solid paths which carry heat and therefore the effective thermal conductivity values are high in comparison with predictions by Eq. (11).
Effective thermal conductivity as a function of the pore volume fraction for experimental measurements and analytical predictions. (a) Fully stabilized zirconia samples with a heterogeneous microstructure. (b) Monoclinic zirconia samples with a cellular arrangement.

B. Porosity >65%
1. Kaolin-based foams, calcium aluminate-based foams
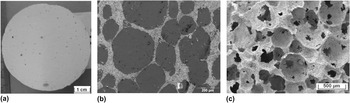
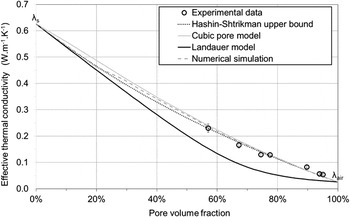
To examine the effect of a high pore volume fraction on thermal conductivity, kaolin-based cellular materials were prepared with a direct foaming method by mixing commercial clay containing 75% kaolinite with methylcellulose as a surfactant and waterReference Bourret, Tessier-Doyen, Nait-Ali, Pennec, Alzina, Peyratout and Smith36(Fig. 7). Before thermal treatment at 1100 °C, the foam is dried at 70 °C for 24 h. Thermal conductivity measurements on these foams in the form of cylinders (50 mm in diameter, 15 mm in height) have been carried out with a transient plane source technique operating at room temperature and supplied by Hot disk AB (Sweden). Experimental values were compared to calculated values using analytical models as well as numerical simulation considering the polyhedral pore shape as shown in Fig. 7(b).Reference Bourret, Tessier-Doyen, Nait-Ali, Pennec, Alzina, Peyratout and Smith36 For this last approach, finite element analysis was performed on an artificial microstructure generated with three-dimensional Voronoi mosaics.Reference Pennec, Alzina, Tessier-Doyen, Nait-Ali and Smith37 The required value for the thermal conductivity of the solid skeleton λs for these calculations is difficult to obtain experimentally. It was thus evaluated using the Hashin–Shtrikman upper bound expression from the value of the thermal conductivity of the foam with a pore volume fraction equal to 57%. A value equal to 0.63 W/m/K was obtained and can be related to poor heat conduction in metakaolin,Reference Michot, Smith, Degot and Gault4 a small amount of mullite, and a certain lack of cohesion between the particles in the pore walls (incomplete sintering). For high pore volume fractions, the values predicted by the Hashin–Shtrikman upper bound, the Russell model, and numerical simulation are within 10% of the measured values (Fig. 8). We deduce that approximating the pore shape to a polyhedron, a sphere, or a cube is more than satisfactory. It can also be noted that Landauer’s relation, as expected, predicts values that are significantly lower.
Macroscopic and SEM observations of foam samples. Flat sections.

Measurements of thermal conductivity at room temperature of kaolin-based foams as a function of the pore volume fraction. Comparison with the values calculated with the Hashin–Shtrikman upper bound, Landauer, and Russell expressions. Values calculated by numerical simulations are also included.

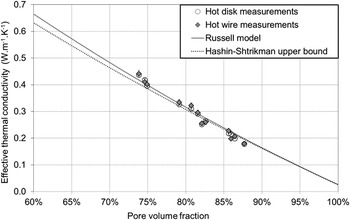
To determine if the predictions with these models are suitable for other highly porous materials, similar work has been made on calcium aluminate foams made at the EHT (Zürich).Reference Krauss Juillerat, Gonzenbach, Studart and Gauckler38 Such foams were created using another direct foaming approach based on stabilizing air bubbles with partially hydrophobized particles.Reference Gonzenbach, Studart, Tervoort and Gauckler39,Reference Gonzenbach, Studart, Tervoort and Gauckler40 Adsorption of propyl gallate to alumina and calcium aluminate renders the particles partially hydrophobic and allows for tailoring particle wettability, resulting in stable wet foams with controlled microstructures. Using a value of thermal conductivity for the solid phase equal to 2 W/m/K, predicted values calculated with the Russell and HS+ models were found to be very close to the measured values of thermal conductivity of the samples with pore volume fractions (νp) from 0.74 to 0.88 (Fig. 9). Associated with the study of kaolin-based foams, the results highlight a certain accuracy of these models for predicting the thermal conductivity of highly porous cellular materials.
Measurements of thermal conductivity at room temperature of calcium aluminate foams as a function of the pore volume fraction. Comparison with the values calculated with the Hashin–Shtrikman upper bound and Russell expressions using λs = 2.0 W/m/K.

2. Silica aerogels
Another remarkable example of an insulating material is given by silica aerogels. Samples were made by a sol–gel process involving a condensation reaction and supercritical drying in JFCC, Nagoya. The materials are characterized by a pore volume fraction >90%, pore size of approximately 24 nm across, and a grain size of 5.5 nm. Due to the dielectric nature of the solid phase and the fine pore size, such materials are optically transparent.
Several techniques were used to evaluate the thermal conductivity including the hot disc method, the hot wire method, and an adapted version of the laser flash method. Results were obtained in the range of 0.015–0.020 W/m/K, which is less than the thermal conductivity of air. The hot wire method was deduced to give the most reliable measurement made in Limoges yielding 0.017 W/m/K for a sample with νp = 0.93. Similarly, using the guarded hot plate method, the JFCC obtained a value of 0.012 W/m/K for this sample.
Estimates of these values can be made in the following way. Amorphous silica takes a value of thermal conductivity equal to 1 W/m/K at room temperature. Assuming each interface has a resistance of 10−8 m²K/W, this yields λs = 0.36 W/m/K using Eq. (6). The pore thermal conductivity is reduced due to the Knudsen effect giving λp = 0.005 W/m/K for 24 nm pores. Applying the Hashin–Shtrikman upper bound with these numbers gives λ = 0.022 W/m/K for νp = 0.93. Though not in perfect agreement, the result suggests the important role played by the small pore and grain size in the exceptionally low effective thermal conductivity of the silica aerogel. Ashby’s relation [Eq. (13)] gives an estimate of λ = 0.013 W/m/K. The two estimates almost enclose the experimental values and imply that the open/closed nature of the cellular structure has a significant effect.
3. Sunflower pith aggregate
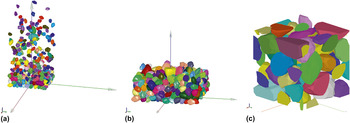
As a final example, work on a bioaggregate material is briefly described illustrating the interest of an approach with numerical simulation. The use of building materials, that comply with legislation and actual user requirements concerning environmental and health impact as well as thermal or hygroscopic comfort, is growing rapidly. These building materials are made from vegetable particles, obtained from grinding of plants which are not recycled by agriculture, renewable, and easy available, such as maize or sunflower. The particles are used as aggregates in combination with one biodegradable binder, from plant or animal origin. To optimize the thermal performances of these materials, several parameters such as the nature of the organic raw material and the organic binder, the particle shape, size and orientation of the particles, air and binder volume fractions must be taken into account. To evaluate the impact of these different parameters without carrying out substantially expensive experimental investigations, numerical methods are very useful. The discrete element method (DEM) is used to build representative volume elements (RVE) of a biocomposite. This technique is applied to simulate the filling of a container by plant aggregates. Figure 10 summarizes the different steps involved.
(a) DEM computation in process with vegetable particles, (b) DEM computation final step, and (c) determination of the RVE.

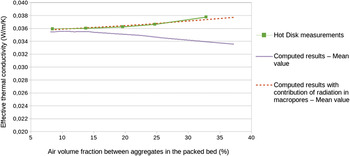
The effective thermal properties are estimated from the RVE coupled with a homogenization method. These properties are compared with those obtained experimentally.Reference Pennec, Alzina, Tessier-Doyen, Nait-Ali, Mati-Baouche, De Baynast and Smith41 The graph of Fig 11 shows the evolution of the effective thermal conductivity of a packed bed of aggregates as a function of the air volume fraction in the range of 8.0–37%. Whereas the measured thermal conductivity increases with the air volume fraction between aggregates, the predicted thermal conductivity by numerical simulation decreases for air volume fraction above 15%. This difference and inversion of trend can be explained by radiation heat transfer across the air cavities in the packed bed of aggregates,Reference Loeb20, Reference Litovsky, Shapiro and Shavit28 not taken into account in the initial numerical model.
Experimental and calculated values of effective thermal conductivity versus air volume fraction in the packed bed of sun flower pith aggregates.

The contribution of radiation in the effective thermal conductivity value of an air cavity can be considered in the following way. The air cavity is considered as a single phase with a pith wall as boundary, and the effective conductivity is expressed by superposition of both conduction and radiation in parallel:
 $${\rm{\lambda }}_{{\rm{cavity}}} = {\rm{\lambda }}_{{\rm{cond}}} + {\rm{\lambda }}_{{\rm{rad}}} \quad ,$$
with λcond = 0.026 W/m/K and λrad, which contains a size dependence. In this way, a second series of calculations with an increased value of the thermal conductivity of air has been carried out. The radiation component in a pore can be evaluated using Loeb’s expression [Eq. (14)]. Given that natural wood has an emissivity value between 0.9 and 0.95, a value of 0.9 has been attributed to ε. Setting γ = 1 as a simplification for nonspherical pores, the pore dimension (d pore) was varied from 0.6 to 2.3 mm. This takes into account the pith particle size and the air volume fraction in the packed bed. Therefore, the effective thermal conductivity of air at 21 °C has been increased linearly from 0.029 W/m/K for 8% of air volume fraction up to 0.038 W/m/K for 37% of air volume fraction. The computed results are given in Fig. 11 and show that contributions of conduction and radiation heat transfer in the packed bed have to be considered.
V. CONCLUSIONS
In this work, the effective thermal conductivity of porous materials containing pore volume fractions (νp) from 0.04 to 0.95 has been studied. In order that a representative value of thermal conductivity is obtained, the choice of a suitable measurement technique is guided by the comparison of pore size to overall test sample dimensions.
We propose a toolbox of analytical relations, reduced to the essentials, to describe the effective thermal conductivity of a porous material. The key parameters are the solid phase thermal conductivity (λs) including the effect of interfaces, the pore thermal conductivity (λp) and the pore volume fraction (νp). The spatial distribution of the pore phase is taken into account by the geometric simplifications associated with a chosen model. For νp < 0.15, the pores are mostly closed and dispersed in the solid matrix. Most relations (Maxwell–Eucken, Landauer, and Loeb) predict rather similar values of effective thermal conductivity in this range. In fact, for relatively conducting ceramics such as alumina or tin oxide, because of grain boundary thermal resistance, variations in grain size can have more significant effects on thermal conductivity than variations in pore volume fractions by 5–10%. For many ceramic materials with νp > 0.15, the porosity becomes connected, termed open, and blocks the heat flow through the material more efficiently. This is illustrated by the divergence of the predicted curve using Landauer’s relation (open pores for νp > 0.15) with that from the Maxwell–Eucken relation (closed pores) and confirmed with experimental data for alumina ceramics and zirconia ceramics.
However, in a general case, Landauer’s relation is no longer suitable for porous materials with νp > 0.65 because it assumes random grain and pore positions, implying breaks in the solid pathways. The physical reality of the microstructure of a highly porous material made, e.g., by a foaming technique does not correspond to such a situation. In the range νp > 0.65, the Hashin–Shtrikman upper bound (equivalent to the Maxwell–Eucken relation for spherical pores), a closed cubic pore model (Russell’s relation) and numerical simulation on polyhedral-shaped pores have given good agreement to experimental data. A kaolin-based foam with νp = 0.95 yielded a thermal conductivity of 0.054 W/m/K, which is slightly greater than a predicted value of 0.047 W/m/K. If the structure of the cellular material is more open, that is connected between pores, then Ashby’s relation can be considered as in the case of silica aerogels exhibiting an experimental value of 0.017 W/m/K for νp = 0.93. This is less than that of air in an unrestricted enclosure (0.026 W/m/K at 20 °C), explained partly by the Knudsen effect for very small pores.
A final example illustrates the potential of numerical simulation on artificially generated microstructures to predict the effective thermal conductivity of a complex porous granular material.