


Many countries are undergoing rapid population aging. One of the most pressing policy challenges arising from this demographic shift is ensuring the financial security of older adults, especially during the post-retirement years when they are no longer earning salary income. The challenge is made more acute given the global transition from traditional defined benefit (DB) pension plans – which provide a guaranteed income for life – to defined contribution (DC) plans, in which benefit amounts typically rely on contributions by workers and their employers, as well as investment returns (Gruber and Wise, Reference Gruber, Wise, Gruber and Wise1999). This transition from DB to DC pension schemes reduces accrual risk for employers (Martin and Rafsky, Reference Martin and Rafsky2007),Footnote 1 but shifts a substantially greater responsibility onto individuals to ensure the adequacy of their retirement income.
DC pension plans also typically differ from traditional DB plans in terms of their investment decision-making. In traditional government-sponsored or corporate DB plans, investment management is handled by the employer or designated professionals. In such schemes, individuals rarely control the investment portfolio. This contrasts with DC retirement savings plans in which the plan participant, not the sponsors, takes on some or all of the responsibility and control of making investment decisions for his or her account balance. Such plan accounts, where participants exercise a degree of independent control over the investment of their accounts, are commonly referred to as participant-directed accounts or self-directed accounts. Key examples include self-directed accounts in 401(k) plans or individual retirement accounts (United States),Footnote 2 self-invested personal pensions (United Kingdom), an investment scheme within the national Central Provident Fund (CPF) system (Singapore), and self-managed superannuation funds (Australia).
In self-directed investment schemes within DC pension plans, participants can choose when and where to invest their money (Poterba, Reference Poterba2004). For instance, some self-directed accounts allow investment in higher-risk or non-traditional asset classes, including precious metals (e.g., gold or silver ingots), real estate, tax liens, or cryptocurrency (Bergstresser and Poterba, Reference Bergstresser and Poterba2004; Tretina, Reference Tretina2022). Another benefit is that these self-directed accounts give individuals greater agency and flexibility over both the contribution rates and asset allocation (Bird et al., Reference Bird, Foster, Gray, Raftery, Thorp and Yeung2018; Fong and Mitchell, Reference Fong and Mitchell2025), moving beyond a one-size-fits-all conservative investment model. Another potential benefit is enhanced retirement financial security and asset accumulation, particularly in aging societies: By enabling higher-risk/higher-return investment options, policy-makers offer individuals opportunities to achieve greater retirement wealth than what is possible through traditional pension schemes (Van Rooij et al., Reference Van Rooij, Kool and Prast2007). Nonetheless, self-directed accounts also carry risks. Beyond the typical accrual risks associated with all contribution-based schemes (i.e., determining contribution amounts, frequency, and initial claiming timing) as outlined in the extant literature (Behaghel and Blau, Reference Behaghel and Blau2012; Coe et al., Reference Coe, Khan and Rutledge2013; Goda et al., Reference Goda, Levy, Manchester, Sojourner and Tasoff2015; Lee and Rao, Reference Lee and Rao2025), self-directed accounts within DC plans introduce additional risks related to investment choice. Lai (Reference Lai2006) identifies possible efficiency losses of portfolio choices under self-directed plans compared to default schemes, with investors who have long investment horizons and high risk-seeking tendencies being particularly vulnerable.
Since self-directed accounts in DC pension schemes entail both potential benefits and risks – and uptake is typically voluntary – not all individuals will choose to participate. In this paper, we examine the determinants of individuals’ participation in the self-directed CPF Investment Scheme (CPFIS) in Singapore, focusing on the role of ‘financial trust’. The CPFIS provides an ideal setting for our investigation since it has over a million enrolled members as of the second quarter of 2025. This is equivalent to about a quarter of the total membership base (CPFB, 2025a). Yet, little is known about what drives participation in this scheme and whether trust in the pension provider and/or financial institutions prompts greater participation. Following the literature (e.g., Burke and Hung, Reference Burke and Hung2021), we define financial trust as comprising trust in banks/financial institutions and trust in stock brokerages. To empirically investigate factors correlated with scheme participation, including trust in the pension provider and financial trust, we apply a probit model drawing on microdata from the 2020 World Values Survey for Singapore. Since the trust variables are potentially endogenous (Mangan et al., Reference Mangan, Mastrogiacomo, Hochguertel and Goedkoop2025), we perform additional analysis using a two-stage control function approach (Wooldridge, Reference Wooldridge2015). Overall, our empirical estimates show that financial trust is positively and significantly associated with the likelihood of participating in the self-directed investment scheme. This finding remains robust when potential endogeneity and alternative empirical specifications are considered.
Exploring the potential causal relationship between financial trust and participation in self-directed plans is vital in the context of this study. Endogeneity may arise if individuals develop trust in financial institutions through prior experience with self-directed plans – or through reverse causality between investment behavior (our outcome) and financial trust (our endogenous explanatory variable). We address this by instrumenting financial trust with generalized trust at the individual level, following several prior studies (Calcagno and Monticone, Reference Calcagno and Monticone2015; Calcagno et al., Reference Calcagno, Giofré and Urzì-Brancati2017; Fong and Lee, Reference Fong and Lee2023). Generalized trust is a suitable instrument since it measures the extent of respondents’ social capital in general (trust toward people) without any reference to financial institutions such as banks, so it is not expected to influence self-investment of pension monies vis-à-vis prior relations with the financial system or financial advisors.Footnote 3
Our paper makes two main contributions. First, it advances the literature on motivations for participating in the self-directed retirement plans.Footnote 4 Prior studies show that individuals are drawn to such schemes due to a desire for more agency (Bird et al., Reference Bird, Foster, Gray, Raftery, Thorp and Yeung2018) and for higher yields, achievable through higher-risk/higher-return investments than those in default pension schemes (Hemmasi et al., Reference Hemmasi, Lesch and Graf1992). Another reason is asset diversification, as reflected in the rise of self-directed plans alongside American workers’ increasing reliance on private securities such as mutual and index funds (Tucker, Reference Tucker2013). We extend this discourse by examining an underexplored driver, which is the role of individuals’ trust in their nation’s financial systems and financial instruments. Together with Agnew et al. (Reference Agnew, Szykman, Utkus and Young2012) and Ricci and Caratelli (Reference Ricci and Caratelli2017), we are among the first to analyze financial trust as a determinant of participation in the context of DC pension schemes. Whereas these studies focus on both the auto-enrolment (opt-out) and voluntary-enrolment (opt-in) settings as appropriate to DC plan participation in the United States and Italy, we focus on the drivers of voluntary ‘opt-in’ behavior into self-directed investment accounts given compulsory participation in a DC scheme.
Second, our study expands the geographic scope of the existing literature, which has largely emphasized the role of trust in the DC pension plans in Western developed countries. We provide new evidence on CPFIS enrollment patterns as a case example of self-directed accounts in national DC pension schemes, a topic which has been relatively underexplored in the literature. Established in 1995, the CPF is one of the world’s oldest occupational DC schemes, and coverage is almost universal. More importantly for our purposes, the CPF system features a long-running self-directed investment scheme. The CPFIS was first launched in the 1980s, and its investment menu has progressively expanded over time (Fong, Reference Fong2020). Today, CPF members may invest a portion of their pension accumulations into a wide variety of financial instruments including insurance products, unit trusts, fixed deposits, bonds, and shares offered by commercial providers. In the context of occupational pension systems, individuals generally welcome more choice and flexibility; for instance, Fernandez et al. (Reference Fernández, Gonzales, James and Wiß2026) noted that individuals might be more inclined to increase their pension contributions when they have a choice between different investment strategies. Having a self-directed account within the DC plan effectively provides such choice and flexibility. Nonetheless, individuals must weigh this increased flexibility and freedom in investing against the additional risks assumed under CPFIS, and their participation decisions may depend on financial acumen, foresight, and confidence in the nation’s financial systems.
We organize the study as follows. The next section describes the role of trust in retirement savings and investment behavior and the evolution of Singapore’s self-directed pension schemes. The Data and methods section presents the data, outcome variables, and covariates, while the Estimation section details the empirical strategies used. The Results section provides descriptive statistics of our sample and reports findings on the role of financial trust in the uptake of self-directed retirement accounts. The Discussion section evaluates the implications of our results and offers policy recommendations.
1. Literature review and context
1.1. The role of trust in the pension context
Existing literature shows that trust is an essential component of contractual relationships that drive various financial decision-making processes. A substantial body of work finds that financial trust encourages individuals to seek and adopt professional financial advice (Lachance and Tang, Reference Lachance and Tang2012; Georgarakos and Inderst, Reference Georgarakos and Inderst2014; Burke and Hung, Reference Burke and Hung2021; Fong and Lee, Reference Fong and Lee2023), increased household savings (Beckmann and Mare, Reference Beckmann and Mare2017), and take up insurance products (Cole et al., Reference Cole, Giné, Tobacman, Topalova, Townsend and Vickery2013; Koh et al., Reference Koh, Mitchell and Fong2021). There is also extensive evidence that trust predicts investment behavior, including participation in stock markets (Guiso et al., Reference Guiso, Sapienza and Zingales2008; Cui and Zhang, Reference Cui and Zhang2021; Fisch and Seligman, Reference Fisch and Seligman2022; Asgharian et al., Reference Asgharian, Liu and Lundtofte2024), real estate investments (El-Attar and Poschke, Reference El-Attar and Poschke2011; Gholipour et al., Reference Gholipour, Tajaddini and Arjomandi2025; Tajaddini et al., Reference Tajaddini, Gholipour and Arjomandi2025), and non-traditional financial markets such as cryptocurrency markets (Jalan et al., Reference Jalan, Matkovskyy, Urquhart and Yarovaya2023; Baeckström et al., Reference Baeckström, Jalan and Matkovskyy2025). Regarding the stock market participation, Guiso et al. (Reference Guiso, Sapienza and Zingales2004), using data from the Bank of Italy Survey on Household Income and Wealth 1989–95, showed that higher-trust individuals were less likely to hold cash, invest more in the stock market, and have greater access to institutional credit. Subsequent studies – including Guiso et al. (Reference Guiso, Sapienza and Zingales2008), Pasini and Georgarakos (Reference Pasini and Georgarakos2009), Cui and Zhang (Reference Cui and Zhang2021), and Fisch and Seligman (Reference Fisch and Seligman2022) – demonstrated that trust encouraged direct stock market participation and higher allocations to risky assets. While Asgharian et al. (Reference Asgharian, Liu and Lundtofte2024) similarly found that trust significantly affects stock market engagement, they identified only a small mediating role of trust in the relationship between institutional quality and stock market participation. Even though these studies examine investment behaviors at different stages of the life course, their insights nonetheless bear relevance for retirement financial security – which is a function of lifetime wealth accumulation.
Several studies have linked trust with pensions and retirement savings. Taylor-Goodby (Reference Taylor‐Gooby2005) compared trust in state and private pensions using the 2002 British Social Attitudes Survey. The authors found that less-educated, lower-income working-class respondents were more likely to trust both pension types than their higher-income counterparts – leading to greater reliance on state pensions. Agnew et al. (Reference Agnew, Szykman, Utkus and Young2012) found a positive and significant impact of financial trust on participation in employer-sponsored 401(k) pensions in the United States, while Bird et al. (Reference Bird, Foster, Gray, Raftery, Thorp and Yeung2018) found that more trusting attitudes toward financial professionals were associated with greater participation in the self-managed superannuation fund sector in Australia. Ricci and Caratelli (Reference Ricci and Caratelli2017) documented that greater financial trust was positively associated with auto-enrolling into private pension schemes and allocating severance pay to such schemes. Maurer et al. (Reference Maurer, Mitchell, Rogalla and Schimetschek2018) studied pension claiming behavior near retirement and found that individuals with greatest confidence in the social security system – termed ‘political trust’ – were less likely to prefer lump sum benefits and less likely to forego an attractive deferred annuity. Beckett et al. (Reference Beckett, Hewer and Howcroft2000) and Vickerstaff et al. (Reference Vickerstaff, Macvarish, Taylor-Gooby, Loretto and Harrison2012) showed that trust shapes individuals’ willingness to absorb the complexity of pension systems (e.g., understanding eligibility rules and investment options), with implications for investment performance and long-term retirement security. Mangan et al. (Reference Mangan, Mastrogiacomo, Hochguertel and Goedkoop2025) investigated the determinants of trust in one’s pension fund and its effect on the decision to build up additional retirement savings. Notably, the authors acknowledged that trust is potentially endogenous to savings in financial markets. Thus, using an instrumental variables approach, Mangan et al. (Reference Mangan, Mastrogiacomo, Hochguertel and Goedkoop2025) showed that trust had a positive effect on additional pension savings.
This present study builds on this literature and augments it in several ways. Both Agnew et al. (Reference Agnew, Szykman, Utkus and Young2012) and Ricci and Caratelli (Reference Ricci and Caratelli2017) examined the role of financial trust on individuals’ behavior in predominantly auto-enrollment contexts and highlighted that low trust results in a higher likelihood of opt-out in DC pension plans. Complementing these studies, our paper also focuses on DC pensions but emphasizes ‘opt-in’ behavior into self-directed accounts that potentially offer higher risk/higher return investment options, given mandatory plan participation. Our work also extends a line of research that has focused quite specifically on trust and investment behaviors in pension settings. For instance, Butt et al. (Reference Butt, Donald, Foster, Thorp and Warren2015) and Deetlefs et al. (Reference Deetlefs, Bateman, Dobrescu, Newell, Ortmann and Thorp2019) found that individuals who trusted financial managers were more likely to remain in default investment plans, whereas lower trust levels encouraged participation in self-directed, non-default investment schemes. Koh et al. (Reference Koh, Mitchell and Fong2021) found that trust in CPF officials was positively and significantly associated with CPFIS participation, while trust in financial advisors (e.g., stock brokers, financial counselors) was not associated with participation.
Nonetheless, these aforementioned studies focused on associations and did not account for potential endogeneity of trust. In contrast, our study employs an instrumental variable estimation framework to determine the unbiased impact of financial trust on the decision to voluntarily participate in self-directed accounts. In the same vein as Mangan et al. (Reference Mangan, Mastrogiacomo, Hochguertel and Goedkoop2025) and Ricci and Caratelli (Reference Ricci and Caratelli2017), we explicitly recognize that financial trust is potentially endogenous to investing in financial markets since prior interactions and experiences with financial institutions, banks, and stock brokerages may influence one’s trust in the financial sector, which then affects future investment-related decisions.
1.2. Singapore’s CPF investment scheme
The CPF in Singapore is a national DC pension scheme, funded by mandatory contributions from both workers and employers. It was established in 1955. The CPF covers 4.30 million members and 161,000 contributing employers as of June 2025. Contribution amounts are calculated as a fixed percentage of employees’ total monthly earnings. Current contribution rates range from 37 percent of wages (17% by employers and 20% by employees) for young working adults aged 35 and below, to 12.5 percent of wages for those aged above 70, as of 1 January 2026 (CPFB, 2025b). The CPF system consists of three main accounts designed to help citizens accumulate funds for housing, healthcare, and retirement needs. The ordinary account (OA) primarily supports general retirement finances as well as housing, insurance, and investments. The Medisave Account is reserved for hospitalization expenses and medical insurance. The special account (SA) is designated for retirement-related financial products. When individuals turn 55, a Retirement Account is created, transferring savings from the OA and SA to provide monthly retirement benefits (CPFB, 2025c). Members can begin receiving monthly payouts at the payout eligibility age, currently 65 but deferrable until age 70.Footnote 5
First launched in 1986, the CPF Investment Scheme is a self-directed account which allows CPF members an option to invest their CPF savings from the OA and SA accounts in the financial instruments of their choice, once they have retained the minimum balances of SGD $20,000 in OA and $40,000 in SA.Footnote 6 There are about 1.03 million members voluntarily enrolled in CPFIS-OA and 221,000 enrolled in CPFIS-SA in 2025, which constitutes at least 24 percent of the total membership base. Since the SA balances are earmarked for long-term retirement, CPFIS-SA gives access to lower-risk or more conservative assets than those offered through CPFIS-OA (CPFB, 2025a). The range of investment options under the CPFIS is broad, including insurance products, equities traded on the Singapore Stock Exchange, unit trusts, fixed deposits, government-endorsed bonds, corporate bonds, Treasury bills, property funds, exchange-traded funds, fund management accounts, and gold. Participation in CPFIS is optional, and individuals unwilling to assume investment risks may leave their balances in the OA and SA to earn legislated, risk-free returns of 2.5 percent (OA) and 4.0 percent (SA) in 2025 (CPFB, 2025c).
Despite the wide range of investment choices, CPFIS investment performance has varied considerably. Fund managers overseeing CPFIS unit trusts and mutual funds have reported challenges in delivering consistent returns over time (Koh et al., Reference Koh, Mitchell and Fong2010). As of 2021, 443,000 members (83% of the CPFIS-OA participants) earned returns exceeding the default OA interest rate of 2.5 percent. However, 40,000 members (approximately 8%) earned returns equal to or below the default OA rate, and 49,000 members (9%) included total losses. Between FY 2014–21, 453,000 members (69% of participants) made profits exceeding the default OA interest rate, while one-tenth earned profits at or below the default rate, and one-fifth incurred total losses (CPFB, 2021). Certain demographic and behavioral factors are associated with higher CPFIS balances: being male, being in one’s 50s (compared to older ages), having higher financial literacy, higher education, experience managing household finances, and prior stock investment outside the pension system (Fong, Reference Fong2020). These patterns suggest that the risks and opportunities inherent in CPFIS may attract specific types of individuals to join the self-directed scheme. In this paper, we argue that a key determinant of individuals’ decisions to participate in CPFIS is trust – specifically, trust in CPF and trust in broader financial institutions.
2. Data and methods
2.1. Sample data
We use data from the 2020 wave of the World Values Survey (WVS) conducted in Singapore. The WVS is the largest global survey of public attitudes – spanning more than 80 countries – that seeks to measure people’s values and beliefs, their stability or change over time and their impact on social and political outcomes in different countries of the world (Inglehart et al., Reference Inglehart, Basanez, Diez-Medrano, Halman and Luijkx2000). For the Singaporean WVS 2020 survey, a general population sampling frame comprising 3,000 randomly generated household addresses and contact details was obtained from the Singapore Department of Statistics (Mathews et al., Reference Mathews, Key, Tay and Wang2021). The response rate was approximately 66 percent, and a total of 2,012 adults aged 21 years and above were interviewed. The demographic profile of the WVS sample closely approximates that of Singapore’s resident population in terms of age cohort, gender, and race (Mathews et al., Reference Mathews, Key, Tay and Wang2021).
Trained interviewers conducted face-to-face interviews at respondents’ homes from November 2019 to March 2020. Respondents received grocery vouchers as compensation. The WVS dataset provides rich information on socio-demographics, social values and attitudes, social capital, trust in people and organizations, political interest and culture, economic values, and related domains. Central to the present study is a special module we fielded in the Singaporean WVS 2020 survey on retirement behavior and financial trust. In addition to the standard WVS trust measures, we collated information on trust levels in the national pension system (CPF), commercial banks, and stock brokerages. We also asked respondents whether they self-invest their pension savings through the CPFIS program. There was no missing data for any of the trust variables. However, a small number of survey participants did not answer the CPFIS question (38 persons). Excluding these persons, our final analytical sample consists of N = 1,974.
2.2. Dependent variable
The dependent variable is whether a respondent ever participated in the CPFIS, which is the self-directed account in Singapore’s national DC pensions. WVS respondents are asked: ‘The CPF Investment Schemes (CPFIS) give you an option to invest your CPF Ordinary Account (OA) and CPF Special Account (SA) savings in a range of investment products after setting aside $20,000 in your OA, or after setting aside $40,000 in your SA. This includes products such as unit trusts, investment-linked insurance products, Singapore Government Bonds, shares and gold. Have you ever participated in the CPF Investment Schemes?’ The short description at the beginning of the question provides necessary context, which is helpful in a lengthy survey such as the WVS. The question is deliberately worded to be as inclusive as possible such that it captures both current CPFIS participants and those who have done so in the past.
To explore motivations underlying CPFIS participation, we fielded a follow-on question to respondents who replied ‘Yes’ to ever participating. The question reads: ‘What was your main reason for participating in the CPF Investment Schemes?’ Respondents were given four options: (1) I believe I can earn a higher return than the CPF-OA interest rate, (2) I prefer making my own financial decisions, (3) I want to have greater control over my CPF savings, and (4) I do not trust the CPF. For flexibility, we also allow respondents to answer in open-text format if they so wish, and such responses are captured in a fifth category (Others).
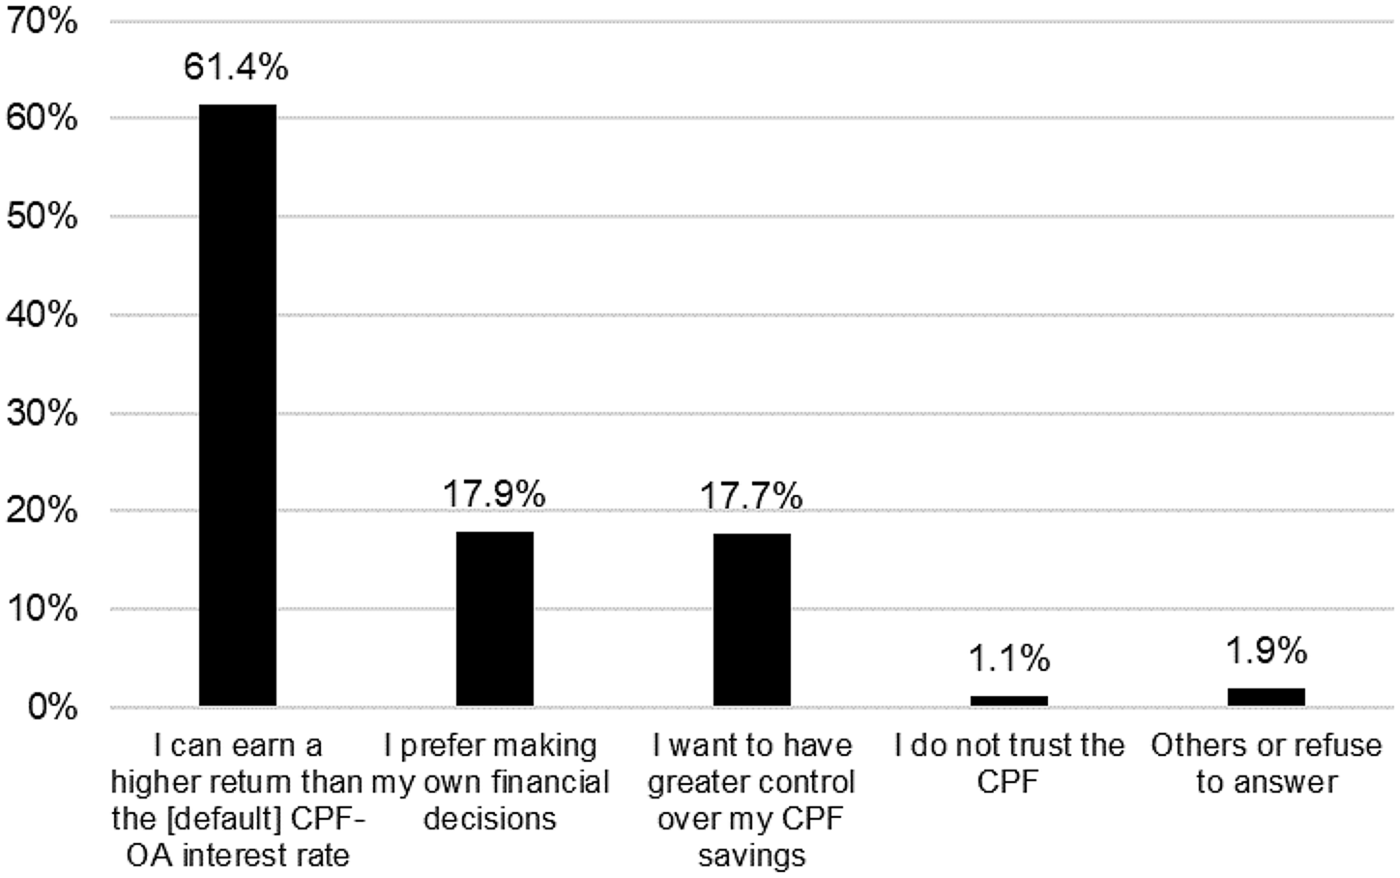
In our sample, 28.4 percent of respondents (or 560 persons) report having ever utilized the CPFIS. This is a non-trivial proportion and broadly mirrors national aggregate statistics. For example, the percentage of CPF members with CPFIS accounts was about 24 percent as of end-2022.Footnote 7 While reasons for the self-investment of pension monies are diverse, the most prevalent reason cited by participants is to earn higher returns: 61.4 percent of CPFIS participants stated that they believe they can achieve higher returns than the default CPF-OA interest rate of 2.5 percent per annum (see Figure 1). This 2.5 percent rate is the risk-free return provided to members who leave their savings in OA accounts. Other popular reasons for participating in the CPFIS are a preference for making one’s own financial decisions (17.9 percent), and a desire for greater control over one’s CPF savings (17.7 percent). Only 1.1 percent of participants indicated that they self-invest because they do not trust the CPF. These patterns suggest that trust – or mistrust – in the national pension system is unlikely a primary motivation for self-investment, a point relevant for later regression analyses.
Reasons cited by pension plan participants for self-investment.

2.3. Independent variables
Our key explanatory variables relate to ‘trust in the CPF’ and ‘trust in the financial sector.’ Respondents are asked how much confidence they have in these respective entities: the CPF pension system, commercial banks, and stock brokerages. Response categories for each item are none, not very much, quite a lot, and a great deal of confidence. Using these responses, we construct three continuous variables each ranging from 1 to 4, where 1 represents ‘none’ and the maximum score of 4 represents ‘a great deal of confidence’. Since banks and stock brokerages are primary providers of financial products in Singapore and are representative of the financial sector, we derive a composite measure of financial trust by taking the arithmetic average of trust in banks and trust in stock brokerages.
We also include a set of covariates that may independently influence participation in self-directed pension plans (Agnew et al., Reference Agnew, Szykman, Utkus and Young2012; Fisch and Seligman, Reference Fisch and Seligman2022). Controls include age, sex, marital status, employment status, education, wealth, and ethnicity/race. Binary indicators are used for sex (1 = female); marital status (1 = married); and current employment (1 = employed). Age is grouped into the following bins (20–29, 30–39, 40–49, 50–59, 60–69, and 70+) to capture age-based differences. For instance, individuals nearing retirement may have accumulated more pension wealth or time to manage investments – potentially increasing their likelihood of self-investing. Educational attainment is classified into three categories: (1) secondary education or less (reference group), (2) post-secondary education, or (3) bachelor’s degree and higher.
The WVS also includes a subjective socioeconomic status measure, where respondents classify themselves as working class, middle class, or upper or lower class (Inglehart et al., Reference Inglehart, Basanez, Diez-Medrano, Halman and Luijkx2000; Donnelly and Pop-Eleches, Reference Donnelly and Pop-Eleches2018). We thus construct four wealth-proxy binary indicators: lower class, working class, middle class, and upper-middle/upper class. We also control for occupational groups, as it is possible that persons working in finance-related sectors may be more inclined to invest. WVS respondents may choose from a total of nine broad occupational categories such as professional, clerical, service, unskilled, and farm workers, or indicate they never had a job. For instance, the professional category includes examples like doctor, teacher, engineer, artist, accountant, and nurse. The service category includes restaurant owner, police officer, waitress, barber, and caretaker. Since it is not apparent that any of these raw occupational categories can be directly classified as finance-related, we decide to streamline the occupation variable using four major categories as follows: (1) never had a job, (2) white-collar workers: professional and administrative, (3) white-collar workers: sales and services, and (4) blue-collar workers.
As for ethnicity, Singapore is a multi-racial and multi-ethnic Asian society in which about three-quarters of the resident population are ethnic Chinese, although Malays are recognized as the indigenous community. We control for ethnicity/race using four categories: Chinese (reference group), Malay, Indian, and Others (mostly Eurasians). Beyond standard sociodemographic characteristics, the WVS dataset includes variables on respondents’ frequency of accessing information and news, which we opine may proxy for financial and investment knowledge.Footnote 8 Respondents are asked to indicate whether they obtain information, respectively, from newspapers and television news, including the frequency that they do so. Responses are recorded on a scale from 1 (‘never use’) to 5 (‘daily’). Since these variables are non-standard in the literature, we include these two information variables as additional confounders in subsequent sensitivity analyses.
2.4. Empirical strategy
Statistical analysis proceeds as follows. We begin with some descriptive analysis that broadly supports the notion that institution-based trust is associated with greater participation in self-directed retirement investment in pension plans. Summary statistics for our sample are also reported. To examine the relationship between trust and investment behavior in pension schemes, we estimate the relations by means of the control function approach (Wooldridge, Reference Wooldridge2015). Also known as two-stage residual inclusion, control function is a statistical method to correct for endogeneity problems by modeling the endogeneity in the error term. Fitted residuals from the first stage are included in the second-stage regression as additional regressors. Standard error correction is achieved by bootstrapping the relevant equation estimation (Wooldridge, Reference Wooldridge2010).
The issue of potential endogeneity of financial trust (as well as trust in CPF) arises because while those who trust the financial sector (or pension system) more may be more inclined to participate in the self-directed investment scheme, investors may also increase their trust in the financial sector (or pension system) if they had good experience investing via CPFIS in the past. Thus, the positive relationship between trust and participation in CPFIS may be biased due to reverse causality, through favorable prior experiences, information acquisition, or learning. In this present study, we adopt the empirical strategy of using generalized trust as an instrumental variable for financial trust (or trust in CPF). This mirrors the approach undertaken in past studies by Calcagno and colleagues who utilize generalized trust as an instrumental variable for trust in financial advisors (Calcagno and Monticone, Reference Calcagno and Monticone2015; Calcagno et al., Reference Calcagno, Giofré and Urzì-Brancati2017). More recently, a study by Fong and Lee (Reference Fong and Lee2023) also validates the usefulness of generalized trust as an instrumental variable for trust in financial institutions in the context of financial advice markets.
Generalized trust in the WVS dataset is measured using responses to the question: ‘Generally speaking, do you think that most people can be trusted or that you have to be very careful in dealing with people?’ The generalized trust measure takes the value of 1 if the response is ‘I think that most people can be trusted’ and 0 if the response is ‘You cannot be too careful in dealing with people’. Generalized trust is a suitable instrument for our purposes since it gauges respondents’ trust toward people in general without any reference to financial institutions, banks, stock brokerages, or the pension system. Because generalized trust measures the extent of respondents’ social capital in general, it can be correlated with other dimensions of trust but is not expected to affect the decision whether to participate in self-directed programs in pension plans.
3. Results
3.1. Descriptive analyses and sample characteristics
Table 1 offers summary statistics for our sample. It also compares our two trust variables of interest. We find that the mean values of both institution-based trust measures are slightly above neutral (the mid-point score of 2.5 on the 1–4 scale reflecting a level of confidence that is between ‘not very much’ and ‘quite a lot’). Nonetheless, the level of trust in the CPF pension system is higher (mean of 2.94) than trust in the financial sector (mean of 2.65).Footnote 9 To cross-validate these measures and our sample’s ability to report attitudes consistently across different frames and contexts, we further extract the average trust scores for trust in major companies (2.61), in the civil service (2.94), and in the government (3.01). We find some concordance in trust scores: respondents exhibit about similar levels of trust in the (private) financial sector as that in major companies. Also, on average, the degree of trust in the CPF is similar to that for the civil service and, more broadly, that for the government sector.Footnote 10
Sample characteristics

Table 1 Long description
Mean values with standard deviations are reported for trust measures and selected controls, and percentages are reported for categorical characteristics. Trust in CPF was 2.94 with a standard deviation of 0.74, and trust in the financial sector was 2.65 with a standard deviation of 0.54. Age ranged from 21 to 91, with a mean of 47.8 and a standard deviation of 16.2. Age group percentages were 16.5% for 20 to 29, 18.2% for 30 to 39, 19.2% for 40 to 49, 19.4% for 50 to 59, 16.4% for 60 to 69, and 10.3% for 70 and over. Female was 54.1%, married was 60.3%, and currently employed was 64.4%. Education was 35.6% secondary education or less, 31.2% post secondary education, and 33.2% bachelors degree or higher. Wealth groups were 7.1% lower class, 37.9% working class, 34.9% lower middle class, and 20.2% upper middle or upper class. Occupational groups were 7.6% never had a job, 49.2% white collar workers professional and administrative, 27.1% white collar workers sales and services, and 16.1% blue collar workers. Ethnic groups were 77.0% Chinese, 11.8% Malay, 9.3% Indian, and 1.9% others. Access to information or news ranged from 1 to 5, with a mean of 3.43 and a standard deviation of 1.22.
Notes: SD = standard deviation; CPF = Central Provident Fund; CPFIS = CPF investment scheme.
Source: 2020 World Values Survey.
Figure 2 highlights the relationships between our two trust measures and the dependent variable of interest. The gray bars illustrate the distribution of responses to the respective trust question, while the black line shows the percentage of respondents who self-invest via CPFIS across these subgroups. In the top panel, we do not observe a clear correlation between trust in the CPF pension system and rates of participation in the self-directed investment scheme. The black line is relatively flat across three of the four subgroups, implying relatively similar rates of participation regardless of the extent of trust in the CPF system. In the bottom panel, however, we find a rather clear positive correlation between financial sector trust and participation in the self-directed investment scheme. Specifically, 36.4 percent of those respondents who have a great deal of confidence in financial institutions ever utilize the CPFIS, as compared to just 12.5 percent among those who have no trust in the financial sector.
Patterns of trust and self-directed retirement investment.

Figure 2 Long description
A bar chart with an overlaid line. The horizontal axis label reads, Trust in CPF pension system. The left vertical axis label reads, percent of respondents, with tick labels 0 percent to 70 percent. The right vertical axis label reads, percent self invest pension savings, with tick labels 0 percent to 50 percent. Bar categories and values are: None, 4.5 percent; Not very much, 17.3 percent; Quite a lot, 58.2 percent; Great deal of confidence, 20.1 percent. The line starts near 35 percent at None, drops near 25 percent at Not very much, rises near 30 percent at Quite a lot and ends near 28 percent at Great deal of confidence. The image B showing a bar chart with an overlaid line. The horizontal axis label reads, Trust in financial sector, with tick labels: 1 minus None; 1.5; 2; 2.5; 3; 3.5; 4 minus Great deal of confidence. The left vertical axis label reads, percent of respondents, with tick labels 0 percent to 40 percent. The right vertical axis label reads, percent self invest pension savings, with tick labels 0 percent to 50 percent. Bars are highest at 2.5 and 3 and lower at 1 minus None, 1.5, 3.5 and 4 minus Great deal of confidence. The line starts near 10 percent at 1 minus None, rises near 25 percent at 1.5, stays near 22 percent at 2 and 2.5, rises near 28 percent at 3, drops near 22 percent at 3.5 and rises near 35 percent at 4 minus Great deal of confidence. Across the two images, the line varies within a narrower range in the trust in CPF pension system graph and rises to a higher value at the highest trust level in the trust in financial sector graph.
3.2. Multivariate probit regression results
Table 2 presents the marginal effects estimates from probit regressions evaluating the effect of trust on self-directed retirement investment behavior. A comparison is made between the two trust measures. In Model I, we use individual-level trust in the national pension system. In Model II, we use instead individuals’ trust in the financial sector (as represented by banks and stock brokerages). The results are striking. We see that financial trust in Model II is strongly and positively associated with making self-directed pension investments. A one-unit increase in financial trust on the 1–4 scale increases the probability of participating in the CPFIS program by 4.2 percentage points (p < 0.05). In contrast, results in Model I show that trust in the CPF pension system is not significantly correlated with the outcome. The negative sign on the estimated effect for CPF trust, nonetheless, is reasonable. It indicates that people are less inclined to invest their pension monies in private financial instruments (via CPFIS) as their trust in the CPF system increases, although as noted in the empirical estimation, this effect is not statistically significant after controlling for other confounders.
Trust and participation in self-directed investment scheme (probit)

Table 2 Long description
Marginal effect estimates are reported for two separate probit models, Model I and Model II, with robust standard errors shown in parentheses. Model I includes trust in CPF with an estimate of minus 0.011 and standard error 0.013, while Model II includes trust in financial sector with an estimate of 0.042 with two stars and standard error 0.018. Age groups use age 20 to 29 as the reference: 30 to 39 is 0.223 with three stars in Model I and 0.221 with three stars in Model II, 40 to 49 is 0.370 with three stars and 0.365 with three stars, 50 to 59 is 0.408 with three stars and 0.402 with three stars, 60 to 69 is 0.396 with three stars and 0.388 with three stars, and 70 and over is 0.213 with three stars and 0.203 with three stars, with standard errors ranging from 0.037 to 0.050. Female is minus 0.043 with two stars in both models, with standard errors 0.020 and 0.019; married is minus 0.023 and minus 0.025, both with standard error 0.021; currently employed is 0.052 with two stars and 0.055 with two stars, both with standard error 0.023. Education uses secondary or less as the reference: post secondary education is 0.115 with three stars and 0.113 with three stars, both with standard error 0.028; bachelors degree or higher is 0.151 with three stars and 0.152 with three stars, both with standard error 0.031. Wealth groups use lower class as the reference: working class is 0.065 and 0.060 with standard error 0.046; lower middle class is 0.108 with two stars and 0.099 with two stars with standard error 0.047; upper middle or upper class is 0.097 with one star and 0.085 with one star with standard error 0.050. Occupational groups use never had a job as the reference: white collar professional and administrative is 0.163 with three stars and 0.158 with three stars with standard error 0.047; white collar sales and services is 0.113 with two stars and 0.110 with two stars with standard error 0.048; blue collar workers is 0.066 and 0.065 with standard error 0.052. Ethnic groups use Chinese as the reference: Malay is minus 0.040 and minus 0.042 with standard error 0.033; Indian is minus 0.085 with two stars and minus 0.093 with three stars with standard error 0.035; others is minus 0.153 with two stars in both models with standard errors 0.078 and 0.077. Sample size is 1,974 in both models, and pseudo R2 is 0.136 for Model I and 0.139 for Model II.
Notes: Marginal effect estimates from separate probit regressions are shown. Robust standard errors in parentheses.
Source: 2020 World Values Survey.
*** p < 0.01, **p < 0.05, *p < 0.10.
Despite the varied effects of different trust measures on pension investment behavior in Models I and II, the two sets of results demonstrate consistency in terms of the other factors associated with the outcome. Specifically, the likelihood of self-directed retirement investment significantly increases with age, education level, and wealth level. The age effects are particularly notable in terms of significance and magnitude in Model II. First, the marginal effects for all age groups are statistically significant at the 1 percent level. Second, the sizes of the independent age effects (20–40 percentage points) are larger than those observed for education and wealth groups (10–15 percentage points). For example, persons aged 40–49 and 50–59 are about 37 percentage points and 40 percentage points (both p < 0.01), respectively, more likely to have self-invested through the CPFIS program than younger persons aged 20–29 (reference group), all else equal.
The results also show that individuals who are currently employed are more likely to utilize pension monies to self-invest as compared to those not employed, as are males compared to females. As compared to persons who never had a job, white-collar workers, including those in the professional, administrative, sales, and services industries, are significantly more likely to participate in the CPFIS. Minority ethnic groups, including Indians and Eurasian (others), are less likely to self-invest via the CPFIS as compared to their Chinese counterparts. The higher pseudo-R 2 value (0.132) obtained in Model II indicates that better goodness of fit is achieved in that model as compared to Model I (0.129). Importantly, trust in the financial sector is statistically significant in predicting the behavioral outcome, whereas trust in CPF is not. Thus, in subsequent estimations and our test for the presence of endogeneity between trust and CPFIS utilization, we focus squarely on the role of trust in the financial sector.
3.3. Potential endogeneity of financial trust
In estimating the relationship between financial trust and self-investment of pension savings, we must consider the possibility that measured financial trust is in fact endogenous. Does financial trust lead to participation in the CPFIS, or does utilizing the self-investment scheme lead to higher levels of trust? Indeed, it is possible that individuals may have developed trust in banks and stock brokerages because they had utilized the CPFIS program to purchase financial instruments such as mutual funds, individual stocks, and insurance-linked products from these institutions in the past and were satisfied with the products purchased. Moreover, endogeneity may also arise from unobserved factors such as risk preferences driving both the willingness to self-invest one’s pension funds and the acquirement of financial trust.
To address the potential endogeneity issue, we implement the control function approach (Wooldridge, Reference Wooldridge2015). This approach is suitable since our endogenous explanatory variable is linear and the outcome variable is binary.Footnote 11 In the estimation, fitted residuals from the first stage are included in the second stage as additional regressors. As mentioned before, our instrumental variable for financial literacy is generalized trust following the approach by Calcagno et al. (Reference Calcagno, Giofré and Urzì-Brancati2017) and Fong and Lee (Reference Fong and Lee2023). Additionally, we bootstrap the relevant equation estimation using 500 repetitions to derive standard errors that are robust to heteroskedasticity (Wooldridge, Reference Wooldridge2010). We estimate Model II again by allowing for potential endogeneity via the control function approach.
Results are shown in Table 3. In the first-stage linear regression, the generalized trust variable (instrument) is strongly and positively correlated with financial trust (p-value <0.01). In the second stage, even after instrumenting, the coefficient of the instrumented financial trust variable is positive and statistically significant. Specifically, a one-unit increase in financial trust increases the probability of participating in the CPFIS by about 45 percentage points, controlling for other covariates. Consistent with the probit results earlier, being older, more educated, and a white-collar worker prompts voluntary participation in the CPFIS, whereas being a member of minority ethnic groups reduces the propensity of doing so. Based on this set of instrumented estimations, the predicted probability of ever utilizing the pension self-investment program is just 0.01 for a person with zero trust in the financial sector, about 0.26 for someone with a middle level of trust (between ‘not very much’ and ‘quite a lot’), and approximately 0.84 for an individual with a great deal of confidence in both banks and stock brokerages.
Control function estimates of financial trust on participation in self-directed investment scheme

Table 3 Long description
Control function approach reports first stage estimates for Financial trust and second stage estimates for 1 if participate in self directed investing, 0 else. In the second stage, Trust in financial sector is 0.454 with two stars, standard error 0.230. Age groups relative to age 20 to 29 are positive in the second stage: 30 to 39 is 0.209 with three stars, 40 to 49 is 0.343 with three stars, 50 to 59 is 0.385 with three stars, 60 to 69 is 0.366 with three stars, and 70 and over is 0.139 with two stars. Female is minus 0.055 with three stars, Married is minus 0.032, and Currently employed is 0.050 with two stars. Education relative to Secondary or less is 0.113 with three stars for Post secondary education and 0.175 with three stars for Bachelors degree or higher. Occupational groups relative to never had a job are 0.174 with three stars for White collar workers, Professional and admin, 0.120 with two stars for White collar workers, Sales and services, and 0.086 for Blue collar workers; ethnic groups relative to Chinese are minus 0.052 for Malay, minus 0.117 with three stars for Indian, and minus 0.114 for Others. In the first stage, Generalized trust is 0.081 with three stars, constant is 2.512 with three stars, and age 70 and over is 0.158 with three stars; N is 1,974 in both stages, R squared is 0.019 for the first stage, and Pseudo R2 is 0.139 for the second stage.
Notes: In the second stage, marginal effect estimates from the control function estimation are shown. The endogenous regressor Financial Trust is instrumented by Generalized Trust (see text). Bootstrapped standard errors (500 repetitions) that are robust to heteroskedasticity are reported in parentheses.
Source: 2020 World Values Survey.
*** p < 0.01, **p < 0.05, *p < 0.10.
In interpreting the results from the causal estimation, it is useful to inspect the strength of the instrumental variable in our current dataset. A weak instrument may result in inaccurate estimates of the coefficient on the endogenous regressor. In particular, a common rule of thumb for models with one endogenous regressor is that the F-statistic (against the null that the excluded instruments are irrelevant) in the first-stage regression should be close to or greater than 10 (Stock et al., Reference Stock, Wright and Yogo2002). Statistical tests reveal that the F-statistic in our analysis is 10.17 (p-value = 0.001). Moreover, the Wald test for exogeneity from the control function estimation indicates that the financial trust measure is endogenous. Nonetheless, we interpret this causal evidence with caution as the F-statistic is not particularly high, and the endogenous explanatory variable is not truly linear in nature. Overall, these empirical results mainly verify the findings presented in Table 2; namely, that respondents who are more trusting of the financial sector are more likely to self-invest their pension monies in commercial financial instruments rather than stick to the government-provided default pension fund.
3.4. Robustness checks
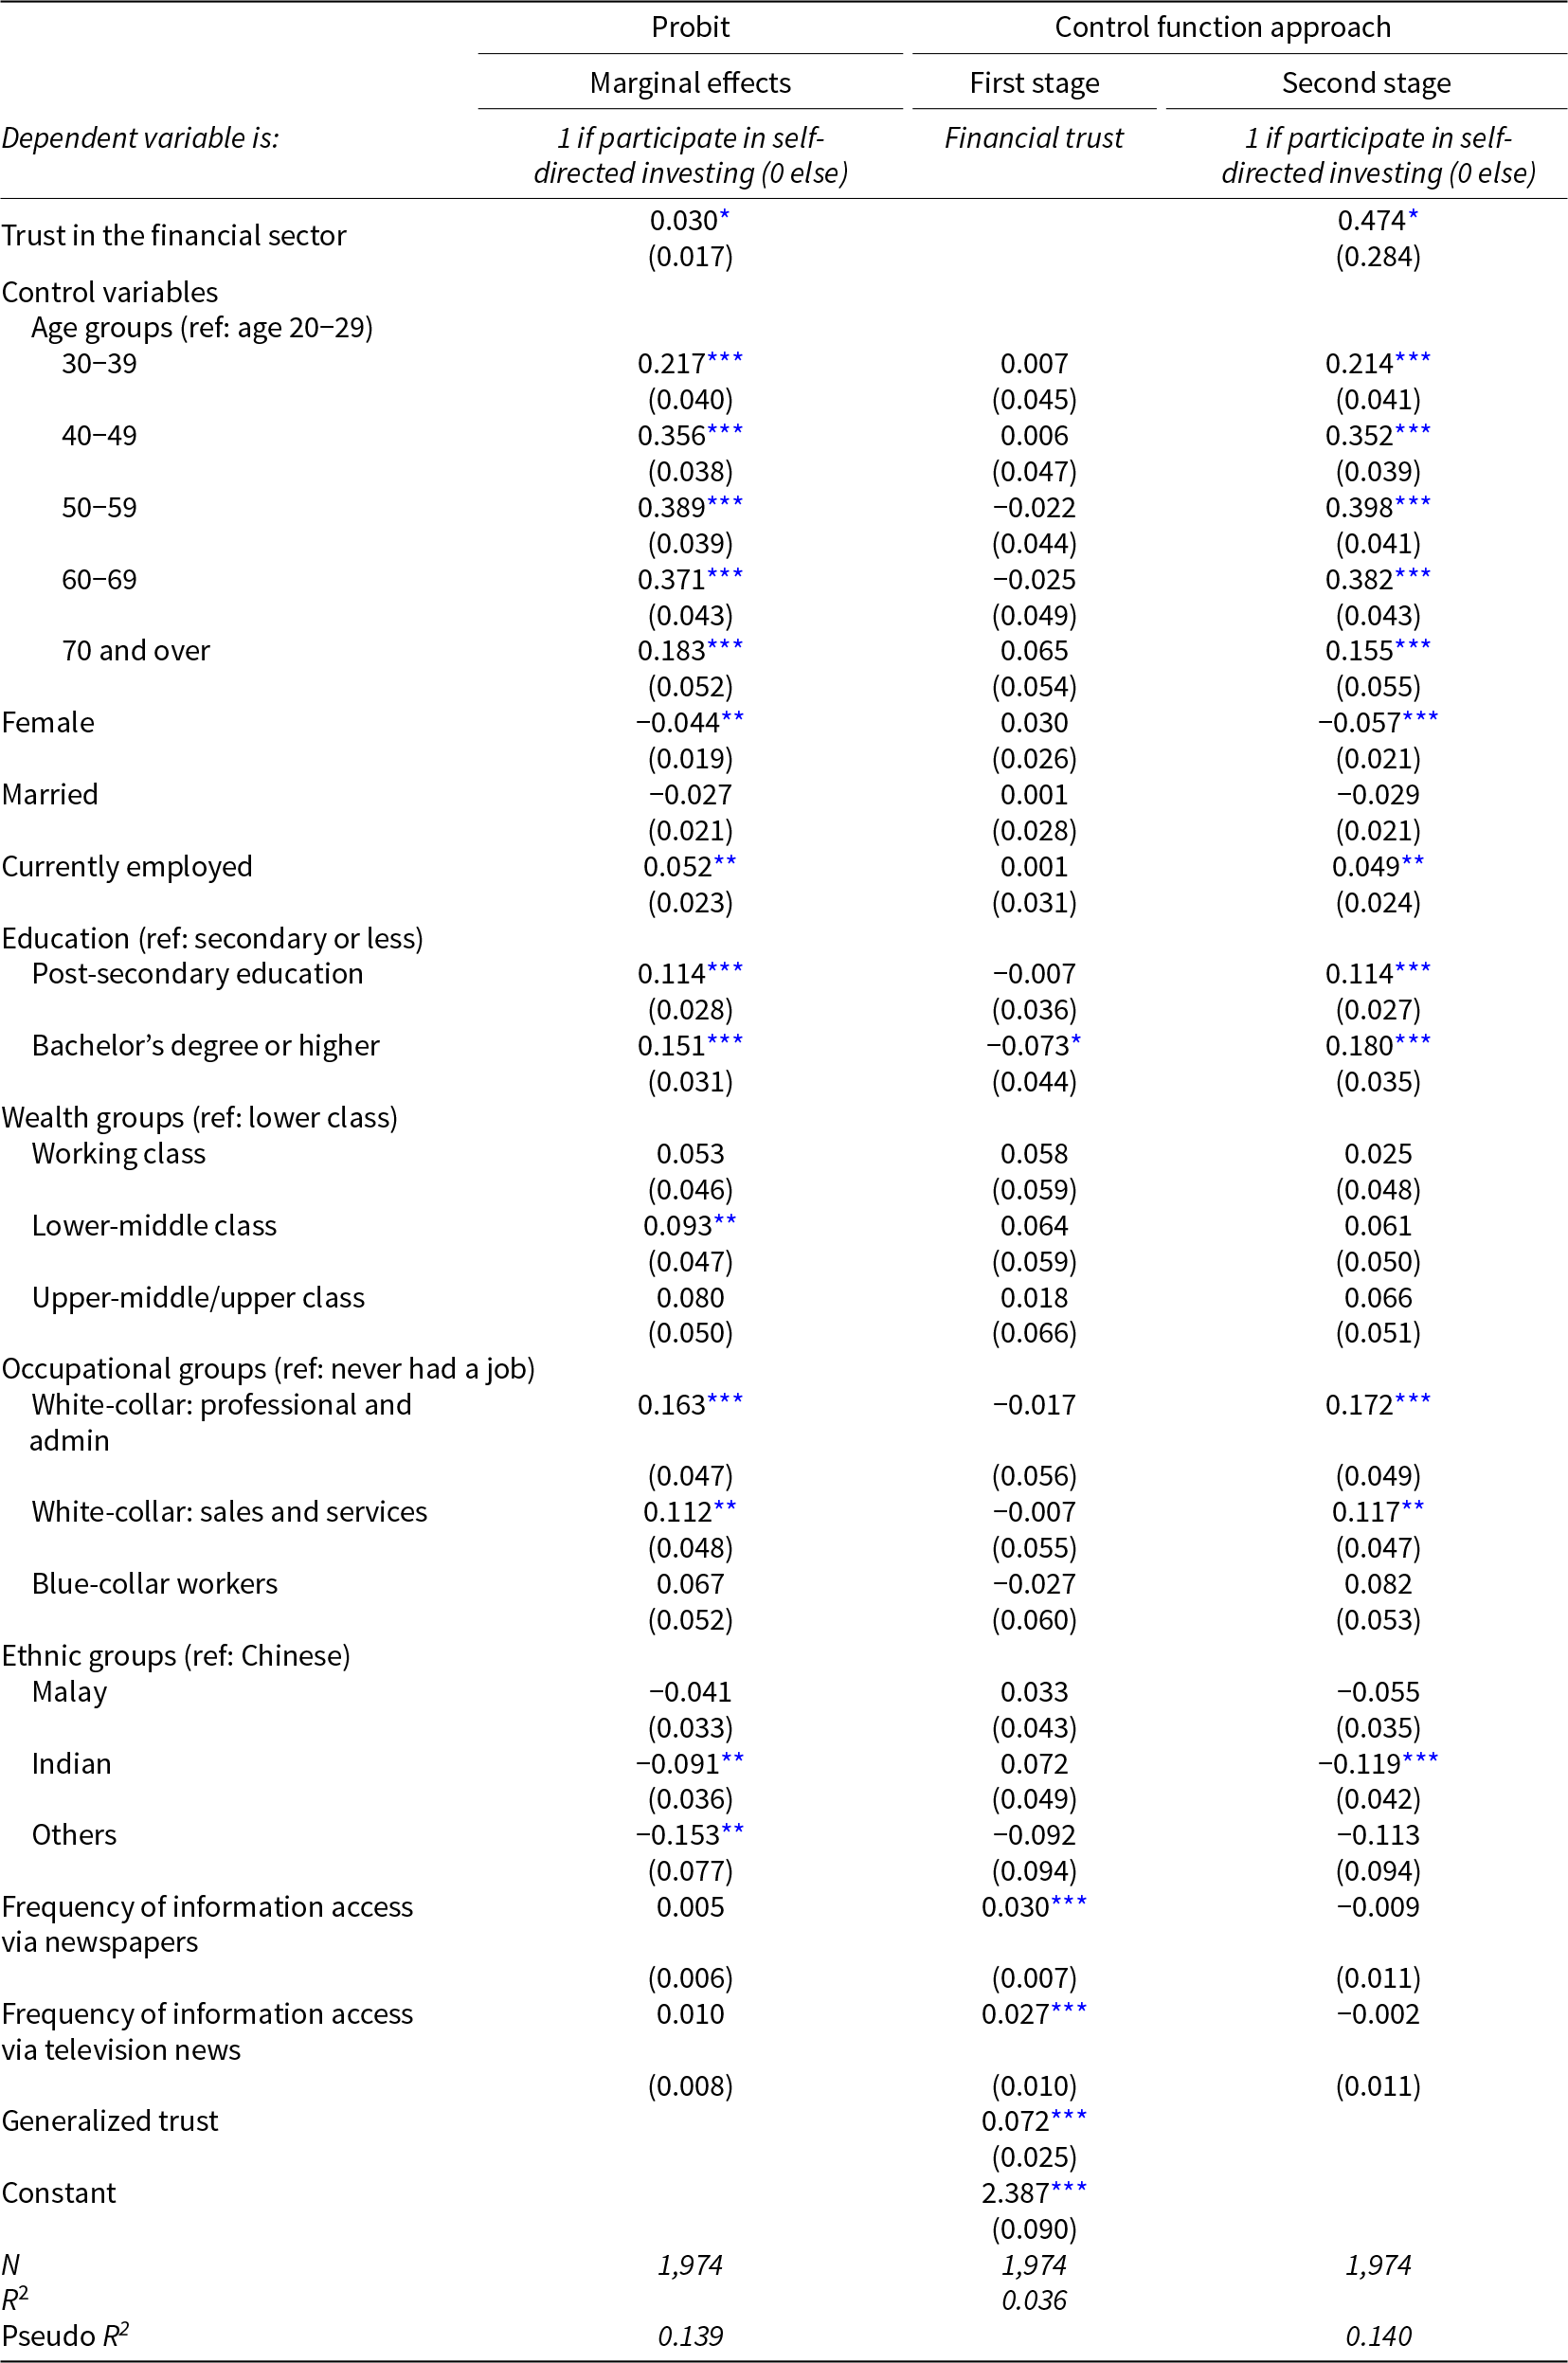
We conduct two separate robustness checks. The first examines whether the main results are robust when additional confounders are included in the specification. In particular, some studies suggest that the extent of information access is positively associated with financial asset accumulation and participation in financial markets (Guiso and Jappelli, Reference Guiso and Jappelli2006). Frequent access to news and information can enhance people’s know-how in investments, prompting greater participation in self-investment schemes. Thus, we re-run the probit model with the standard set of controls and add the two information access variables. One variable pertains to the frequency with which a respondent accesses information through daily newspapers, while the other extra variable is the frequency that a respondent access information through television news. Table 4 shows the non-instrumented and instrumented versions of the empirical results using this augmented specification. The instrumented version of the results allows for endogeneity of financial trust via the control function approach. The key takeaway from these results is that the effect of trust in the financial sector on self-directed retirement investment remains positive and significant, in spite of the additional confounders. Also, the extent of information access does not seem to play an important role in driving non-default pension investment behavior in our data.
Effect of financial trust on participation in self-directed investment scheme (adding information access control variables)

Table 4 Long description
Three model columns report probit marginal effects and a control function approach with first stage for financial trust and second stage for participation in self directed investing. Dependent variable is 1 if participate in self directed investing, 0 else, in the probit and second stage columns, and financial trust in the first stage column. Trust in financial sector is 0.030 with standard error 0.017 in probit, and 0.474 with standard error 0.284 in the second stage. Age groups relative to age 20 to 29 have positive marginal effects in probit and second stage, with probit values 0.217, 0.356, 0.389, 0.371, and 0.183 for ages 30 to 39 through 70 and over, and second stage values 0.214, 0.352, 0.398, 0.382, and 0.155; first stage age coefficients range from 0.007 to minus 0.025 except 70 and over at 0.065. Female is minus 0.044 in probit and minus 0.057 in second stage, with first stage 0.030; married is minus 0.027 in probit and minus 0.029 in second stage, with first stage 0.001; currently employed is 0.052 in probit and 0.049 in second stage, with first stage 0.001. Education relative to secondary or less shows post secondary education at 0.114 in both probit and second stage and minus 0.007 in first stage, and bachelors degree or higher at 0.151 in probit, minus 0.073 in first stage, and 0.180 in second stage. Wealth groups relative to lower class show probit values 0.053, 0.093, and 0.080 and second stage values 0.025, 0.061, and 0.066 for working class, lower middle class, and upper middle or upper class; first stage values are 0.058, 0.064, and 0.018. Occupational groups relative to never had a job show probit values 0.163, 0.112, and 0.067 and second stage values 0.172, 0.117, and 0.082 for white collar professional and admin, white collar sales and services, and blue collar workers; first stage values are minus 0.017, minus 0.007, and minus 0.027. Ethnic groups relative to Chinese show probit values minus 0.041, minus 0.091, and minus 0.153 and second stage values minus 0.055, minus 0.119, and minus 0.113 for Malay, Indian, and Others; first stage values are 0.033, 0.072, and minus 0.092. Frequency of information access via newspapers is 0.005 in probit, 0.030 in first stage, and minus 0.009 in second stage; via television news is 0.010 in probit, 0.027 in first stage, and minus 0.002 in second stage. Generalized trust appears only in the first stage at 0.072 with standard error 0.025, and the first stage constant is 2.387 with standard error 0.090. Sample size is 1,974 in all three columns, pseudo R2 is 0.139 for probit and 0.140 for second stage, and first stage R squared is 0.036.
Notes: The first column shows marginal effect estimates from probit regression. Robust standard errors in parentheses. The next two columns show the first-and second-stage regression outputs from control function estimations. The endogenous regressor Financial Trust is instrumented by Generalized Trust (see text). Bootstrapped standard errors (500 repetitions) that are robust to heteroskedasticity are reported in parentheses.
Source: 2020 World Values Survey.
*** p < 0.01, **p < 0.05, *p < 0.10.
Our second robustness check considers a possibility that our results may be sensitive to the approach used for endogeneity correction. Although the control function approach is deemed suitable in our context because the endogenous explanatory variable (financial trust) is linear and the outcome variable (utilize CPFIS) is binary, an alternative approach to determine causal relationships in standard econometrics is to apply the generalized method of moments instrumental variable (GMM-IV) method, using the same set of controls as per the main analysis. The full GMM-IV regression results are given in Table 5. Importantly, the effect of financial trust on self-directed retirement investment is positive and statistically significant in the second-stage regression outputs (see last column). Furthermore, a comparison of these GMM-IV estimation results with those of the control function approach (in Table 3) reveals that the sign and significance of all regressors remained unchanged across both estimation techniques. This confirms that our main findings are robust to the approach used for endogeneity correction.
OLS and IV-GMM estimates of financial trust on participation in self-directed investment scheme

Table 5 Long description
Three model columns report coefficients with robust standard errors in parentheses: OLS for participation in self directed investing, IV GMM first stage for financial trust, and IV GMM second stage for participation. Trust in financial sector is 0.034 with standard error 0.017 in OLS, and 0.496 with standard error 0.290 in the IV GMM second stage; the first stage entry for this row is blank. Age groups use age 20 to 29 as the reference: OLS coefficients are 0.177, 0.348, 0.392, 0.365, and 0.203 for ages 30 to 39 through 70 and over, with corresponding second stage coefficients 0.161, 0.321, 0.369, 0.337, and 0.130; first stage age coefficients range from 0.032 to 0.158. Female is minus 0.046 in OLS and minus 0.058 in the second stage, with first stage 0.028; married is minus 0.026 in OLS and minus 0.033 in the second stage, with first stage 0.012; currently employed is 0.050 in OLS and 0.048 in the second stage, with first stage 0.000. Education uses secondary or less as the reference: post secondary education is 0.132 in OLS and 0.129 in the second stage with first stage minus 0.002, and bachelors degree or higher is 0.176 in OLS and 0.199 in the second stage with first stage minus 0.059. Wealth groups use lower class as the reference: working class is 0.035 in OLS and minus 0.006 in the second stage with first stage 0.084; lower middle class is 0.079 in OLS and 0.032 in the second stage with first stage 0.096; upper middle or upper class is 0.070 in OLS and 0.043 in the second stage with first stage 0.045. Occupational groups use never had a job as the reference: white collar professional and admin is 0.117 in OLS and 0.131 in the second stage with first stage minus 0.026; white collar sales and services is 0.059 in OLS and 0.070 in the second stage with first stage minus 0.018; blue collar workers is 0.015 in OLS and 0.039 in the second stage with first stage minus 0.045. Ethnic groups use Chinese as the reference: Malay is minus 0.034 in OLS and minus 0.048 in the second stage with first stage 0.032; Indian is minus 0.094 in OLS and minus 0.125 in the second stage with first stage 0.076; others is minus 0.172 in OLS and minus 0.130 in the second stage with first stage minus 0.090. Generalized trust appears only in the first stage with coefficient 0.081 and standard error 0.026. Constants are minus 0.270 for OLS, 2.512 for first stage, and minus 1.436 for second stage; N is 1,974 in all columns, and adjusted R squared is 0.139 for OLS and 0.019 for the first stage.
Notes: The first column shows the coefficient estimates from ordinary least squares (OLS) regression. Robust standard errors in parentheses. The next two columns show the first-and second-stage regression outputs from IV-GMM estimations, instrumented on Generalized Trust; see text. Robust standard errors in parentheses.
Source: 2020 World Values Survey.
*** p < 0.01, **p < 0.05, *p < 0.10.
4. Discussions and implications
Using a composite measure of individuals’ trust in commercial banks and stock brokerages – two key institutions representing Singapore’s financial sector – as a regressor, our work demonstrates that financial trust encourages CPFIS participation. Incorporating the two-stage control functions approach (Wooldridge, Reference Wooldridge2015), whereby financial trust is instrumented with generalized trust (Calcagno et al., Reference Calcagno, Giofré and Urzì-Brancati2017; Fong and Lee, Reference Fong and Lee2023), we show that the impact of financial trust is robust to the endogeneity correction. Our results also remain robust to changes in estimation strategy and inclusion of additional confounders (i.e., information access). These findings are broadly consistent with Agnew et al. (Reference Agnew, Szykman, Utkus and Young2012), Ricci and Caratelli (Reference Ricci and Caratelli2017), and Taylor-Goodby (Reference Taylor‐Gooby2005), who documented a positive link between trust and DC pension plan uptake/participation, albeit with no particular focus on self-directed investment accounts within such plans.
At present, it is difficult to directly compare our findings with the few existing studies on the role of trust in self-directed pension investment (e.g., Butt et al., Reference Butt, Donald, Foster, Thorp and Warren2015; Deetlefs et al., Reference Deetlefs, Bateman, Dobrescu, Newell, Ortmann and Thorp2019; Koh et al., Reference Koh, Mitchell and Fong2021) due to differences in how trust is conceptualized. Specifically, trust in financial institutions (i.e., banks and stock brokerage) used in our study differs from trust in pension providers (Butt et al., Reference Butt, Donald, Foster, Thorp and Warren2015), trust in default pension plans (Deetlefs et al., Reference Deetlefs, Bateman, Dobrescu, Newell, Ortmann and Thorp2019), or trust in officials at the pension agency (Koh et al., Reference Koh, Mitchell and Fong2021). These forms of trust reflect distinct dimensions of individuals’ attitudes: trust in banks and stock brokerages captures confidence in the national financial system, while trust in officials at the pension agency reflects social capital fostered through interpersonal interactions. Future research may benefit from devising a more consolidated and multidimensional measure of financial trust that includes these various components to better assess their respective impacts on self-directed pension participation.
In addition to exploring the role of trust in the financial sector (banks and stock exchanges), we separately estimated the impact of trust in the pension provider on CPFIS participation. To this end, we found negative and statistically insignificant effect of trust in CPF on participation – contrasting with the persistent positive effect of trust in the financial sector. This aligns with our descriptive results in Figure 1, which show that distrust in CPF is a weak driver of CPFIS participation; only 1.1 percent of CPFIS participants explain that their participation decision stemmed from distrusting the pension provider. At the same time, we acknowledge that our findings differ from Koh et al. (Reference Koh, Mitchell and Fong2021), who found that ‘trust in CPF officials’ had a positive and significant effect on the CPFIS participation. However, if trust in CPF is viewed as analogous to trust in a default pension plan or trust in pension providers (Butt et al., Reference Butt, Donald, Foster, Thorp and Warren2015; Deetlefs et al., Reference Deetlefs, Bateman, Dobrescu, Newell, Ortmann and Thorp2019), our findings are reasonable: Individuals who trust the CPF system appear less inclined to deviate from the risk-free default scheme (CPF) to participate in higher-risk investment choices available through CPFIS. Under this interpretation, our findings are consistent with the earlier work that shows greater trust in default pension arrangements reduces the desire to opt out (e.g., Butt et al., Reference Butt, Donald, Foster, Thorp and Warren2015; Deetlefs et al., Reference Deetlefs, Bateman, Dobrescu, Newell, Ortmann and Thorp2019).
We further interpret these results as suggesting that individuals do not equate the Central Provident Fund Board (i.e., administrator of CPF) with other financial institutions. Rather, they may regard CPF and private financial institutions as substitutes – one providing a safety net when the other is perceived as more uncertain. Given the scant literature in this area, future research would benefit from examining how individuals perceive different dimensions of trust and why these dimensions have divergent effects on retirement savings and pension participation behavior.
This study is not without limitations. First, trust variables used in our estimations are based on self-reports, and can thus be biased or imprecise. Second, while both CPFIS participation and the extent of trust in CPF may be in part determined by individuals’ inherent valuation of CPF, discount rates, or preference toward retirement savings and away from present-day consumption, we fall short of accounting for individuals’ innate valuation differentials given that the data at our disposal are cross-sectional. Future research with panel data could easily address the valuation differentials through, for instance, the use of individual fixed effects in their estimations. Finally, although we have controlled for many possible confounders in the multivariate regression framework, there may still be some omitted variables. For example, we are unable to fully account for individuals’ risk preferences, beliefs about investment returns and risks, and financial knowledge due to data limitations. As noted earlier, we control for how frequently respondents access information and news, based on the rationale that such exposure may proxy for people’s knowledge about basic financial concepts and some understanding of core investing principles like the risk-return tradeoff. However, this remains an indirect and partial proxy. Future research incorporating such measures would help provide a more accurate estimate of the effect of financial trust on CPFIS participation.
5. Conclusion
This study provides important insights on the role of financial trust in shaping voluntary participation in self-directed accounts with DC pension plans. These findings are relevant for policy-makers seeking to expand the use of self-directed investment accounts to enhance retirement financial security. Specifically, policy efforts aimed at expanding the uptake of such accounts should incorporate trust-building as a central strategy. This may include encouraging banks and brokerage firms managing account-linked products to adopt greater transparency in investment performance reporting, risk disclosures, and customer service standards. Public education initiatives can also play a complementary role by improving financial literacy and consumer understanding of sector operations. Pension administrators also need to provide adequate institutional safeguards, regulatory oversight, and consumer protection measures. Finally, policy-makers should recognize that strong trust in the DC pension system itself may discourage participation in self-directed accounts among more risk-averse individuals, particularly when default investment options provide risk-free returns. Future pension policy design should therefore account for this and other potential trade-offs when promoting diversified retirement saving and investment pathways in DC pension schemes.
Supplementary material
The supplementary material for this article can be found at https://doi.org/10.1017/S1474747226100225.
Declaration of interest
The authors declare that they have no competing interests.
Funding statement
This research was supported by the Social Science Research Council (Singapore) and administered by the Ministry of Education, Singapore, under a Social Science and Humanities Research Fellowship [grant number MOE2021-SSHR-004]. The funding source was not involved in the design of this study or its analyses. Findings and conclusions are solely those of the authors and do not represent the views of any of the institutions with which the authors are affiliated.




 Open access

