Bipolar cell development and differential gene expression
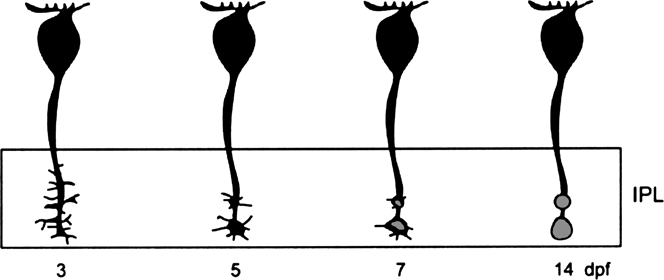
Bipolar cells are the last neuronal cell type to differentiate in the zebrafish retina, forming at ∼60 h postfertilization, hpf (∼2.5 days postfertilization, dpf; Schmitt & Dowling, Reference Schmitt and Dowling1999). At this time, bipolar cells display typical morphology, with cell bodies in the inner nuclear layer (INL), axon terminals in the inner plexiform layer (IPL), and dendrites in the outer plexiform layer (OPL) (Schmitt & Dowling, Reference Schmitt and Dowling1999). By 74 hpf, mature ribbon synapses are observed in bipolar cell terminals, which are irregularly shaped and stratified within the IPL (Schmitt & Dowling, Reference Schmitt and Dowling1999; Biehlmaier et al., Reference Biehlmaier, Neuhauss and Kohler2003). Recent work examining axon terminal development in ON-type bipolar cells labeled in transgenic nyx::MYFP zebrafish (Schroeter et al., Reference Schroeter, Wong and Gregg2006) showed that the irregular shape and stratification patterns observed ∼3 dpf are due to the dynamic formation of axonal boutons (Fig. 1). Defined (adult-like) axon terminals are not present on bipolar cells at this age. Rather, filopodia extend from specific points along the proximal portion of the axon corresponding to the inner ON-sublamina in the IPL. The filopodia extend and retract laterally, a behavior similar to growth cone activity. As development continues, filopodia are lost and by 7–14 dpf, defined axon terminals are apparent (Schroeter et al., Reference Schroeter, Wong and Gregg2006).
Dynamic development of bipolar cell axon terminals. Summary diagram showing changes in bipolar cell axon terminals from 3 to 14 dpf. Bipolar terminals are initially observed in transgenic nyx::MYFP zebrafish as lateral extensions extending from the axon (3 dpf). As development proceeds, these extensions (filopodia) are replaced by defined axon terminals. By 14 dpf, adult-like axon terminals are apparent (Reprinted from Schroeter et al., Reference Schroeter, Wong and Gregg2006, Visual Neuroscience 23, 833–843).

Ultrastructural analysis of photoreceptor development suggests synaptic transmission between cones and second-order bipolar (and horizontal) cells is functional at 70–74 hpf (Schmitt & Dowling, Reference Schmitt and Dowling1999; Biehlmaier et al., Reference Biehlmaier, Neuhauss and Kohler2003). Photoreceptor ribbons and their associated triad synapses formed from invaginating postsynaptic processes opposing the photoreceptor ribbons (i.e., Dowling & Werblin, Reference Dowling and Werblin1969; Lasansky, Reference Lasansky1973; Kolb & Jones, Reference Kolb and Jones1984) are first observed in the ventronasal patch at 65 hpf (Schmitt & Dowling, Reference Schmitt and Dowling1999), with subsequent development occurring throughout the retina by 74 hpf (Schmitt & Dowling, Reference Schmitt and Dowling1999; Biehlmaier et al., Reference Biehlmaier, Neuhauss and Kohler2003). Probing cryostat sections with antibodies to synapse-associated proteins (SNAP-25, syntaxin 3, and SV2) identified immunopositive labeling beginning at ∼2.5 dpf in ventral retina (Biehlmaier et al., Reference Biehlmaier, Neuhauss and Kohler2003), consistent with the initial observations of synaptic ribbon formation. By 3–5 dpf, labeling for these synaptic proteins was observed across the entire retina (Biehlmaier et al., Reference Biehlmaier, Neuhauss and Kohler2003). As noted above, bipolar cell development is also occurring at this time, and immunocytochemical data suggest differentiation of ON- and OFF-type bipolar cells may not occur simultaneously. Protein kinase C (PKC)-β1 positive processes (characteristic of ON-type cells) are observed in the OPL at 2.5 dpf, with complete cell labeling observed at 4 dpf (Biehlmaier et al., Reference Biehlmaier, Neuhauss and Kohler2003). In contrast, OFF-bipolar cell processes, identified by positive labeling for AMPA-type GluR4 glutamate receptors, are not observed until 3.5 dpf. These findings suggest that ON-type bipolar cells may develop first in zebrafish retina, though both ON and OFF cells are mature and evident by 7 dpf (Biehlmaier et al., Reference Biehlmaier, Neuhauss and Kohler2003).
The differential expression of various genes, such as chx10/vsx2 and vsx1 (Passini et al., Reference Passini, Levine, Canger, Raymond and Schechter1997; Clark et al., Reference Clark, Yun, Veien, Wu, Chow, Dorsky and Levine2008; Vitorino et al., Reference Vitorino, Jusuf, Maurus, Kimura, Higashijima and Harris2009), are important for bipolar cell differentiation, development, and maturation. Developmental expression patterns of vsx1 and vsx2 are complimentary (Passini et al., Reference Passini, Levine, Canger, Raymond and Schechter1997). In situ hybridization identified strong initial expression of vsx2. By 31 hpf, vsx1 transcripts are highly expressed in the presumptive INL region of the ventral patch, a pattern that coincides with downregulation of vsx2. By 50 hpf, vsx2 expression has been upregulated in the outer INL, where vsx1 is also expressed (Passini et al., Reference Passini, Levine, Canger, Raymond and Schechter1997). Using transgenic embryos, Vitorino et al. (Reference Vitorino, Jusuf, Maurus, Kimura, Higashijima and Harris2009) similarly observed vsx2 expression across the entire retina at 24 hpf. With continued development, some cells upregulate vsx2, while others downregulate vsx2 and express vsx1. By 96 hpf, however, all bipolar cells in double transgenic vsx2:dsRed; vsx1:GFP embryos express one of these genes, with most expressing vsx1. Consistent with strong initial expression of vsx2 compared to vsx1 (Passini et al., Reference Passini, Levine, Canger, Raymond and Schechter1997), Vitorino et al. (Reference Vitorino, Jusuf, Maurus, Kimura, Higashijima and Harris2009) identified that bipolar cells expressing vsx2 form from vsx2-positive precursor cells, while vsx1-positive cells develop from cells that initially expressed, but later downregulated, vsx2. Thus, bipolar cells in zebrafish originate from a single vsx2-expressing progenitor population with development of some subsequent cell types occurring only after downregulation of vsx2 (Vitorino et al., Reference Vitorino, Jusuf, Maurus, Kimura, Higashijima and Harris2009).
RIBEYE is a specific marker for synaptic ribbons (Schmitz et al., Reference Schmitz, Konigstorfer and Sudhof2000). Two RIBEYE genes, ribeye a and ribeye b, each associated with a different RIBEYE protein, are expressed in zebrafish (Wan et al., Reference Wan, Almers and Chen2005). Of these genes, ribeye a is localized to synaptic ribbons in both photoreceptor and bipolar cell terminals, while ribeye b expression is observed only in photoreceptor ribbons (Wan et al., Reference Wan, Almers and Chen2005). Both genes are expressed beginning at 48 hpf (Wan et al., Reference Wan, Almers and Chen2005). As ribeye a is the gene expressed in bipolar cells, Wan et al. (Reference Wan, Almers and Chen2005) used morpholinos to examine the specific function of this gene. They show that knockdown of ribeye a results in shorter photoreceptor ribbons, underdeveloped ribbons in bipolar cell terminals, a reduced number of PKC(+) bipolar cells, and a loss of optokinetic responses at 84 hpf (Wan et al., Reference Wan, Almers and Chen2005). Since these changes in bipolar cells were observed after their initial differentiation, these researchers concluded that ribeye a is also important for later development and maturation of bipolar cells (Wan et al., Reference Wan, Almers and Chen2005). Given that synaptic machinery is not apparent at the ultrastructural level until after bipolar cells have formed (Schmitt & Dowling, Reference Schmitt and Dowling1999) and that RIBEYE is involved in formation of synaptic ribbons (Magnupalli et al., Reference Magnupalli, Schwarz, Alpadi, Natarajam, Seigel and Schmitz2008), it is logical that loss of RIBEYE would alter formation of synaptic structures but not alter initial bipolar cell differentiation. The fact that maturation of bipolar cells appears to be altered by knockdown of ribeye a suggests that synaptic activity may be important for final development of bipolar cells.
Expression and function of nyctalopin (nyx), a protein associated with congenital stationary night blindness (CSNB) in humans (Bech-Hansen et al., Reference Bech-Hansen, Naylor, Maybaum, Sparkes, Koop, Birch, Bergen, Prinsen, Polomeno, Gal, Drack, Musarella, Jacobson, Young and Weleber2000), have been examined in mouse retina (i.e., Pesch et al., Reference Pesch, Zietz, Fries, Munscher, Pusch, Kohler, Berger and Wissinger2003). Mutant mice lacking nyx expression (= no b-wave or nob mice) have absent electroretinogram (ERG) b-waves (Pardue et al., Reference Pardue, McCall, LaVail, Gregg and Peachey1998) and reduced visual sensitivity (Gregg et al., Reference Gregg, Mukhopadhyay, Candille, Ball, Pardue, McCall and Peachey2003), similar to humans with CSNB (Bech-Hansen et al., Reference Bech-Hansen, Naylor, Maybaum, Sparkes, Koop, Birch, Bergen, Prinsen, Polomeno, Gal, Drack, Musarella, Jacobson, Young and Weleber2000; Khan et al., Reference Khan, Kondo, Hiriyanna, Jamison, Bush and Sieving2005). Nyctalopin expression is associated with mGluR6 glutamate receptors on the dendritic tips of ON-bipolar cells, and ON-bipolar cell glutamate responses are reduced in nob mice (Gregg et al., Reference Gregg, Kamermans, Klooster, Lukasiewicz, Peachey, Vessey and McCall2007). Taken together, these findings suggest that nyctalopin expression occurs postsynaptic to photoreceptor synapses and is required for proper functioning of ON-bipolar cells (Gregg et al., Reference Gregg, Kamermans, Klooster, Lukasiewicz, Peachey, Vessey and McCall2007). In zebrafish, nyctalopin is also expressed in a population of bipolar cells. Fluorescently labeled bipolar cells in the transgenic nyx::MYFP line are first observed in ventral retina at 2.5 dpf and across the entire retina at 4 dpf (Schroeter et al., Reference Schroeter, Wong and Gregg2006). At 5 dpf, nyx protein is identified in presumed ON-cone bipolar cell processes in both plexiform layers (Bahadori et al., Reference Bahadori, Biehlmaier, Zeitz, Labhart, Makhankov, Forster, Gesemann, Berger and Neuhauss2006). Knockdown of nyx suppresses ERG b-wave activity in zebrafish (Bahadori et al., Reference Bahadori, Biehlmaier, Zeitz, Labhart, Makhankov, Forster, Gesemann, Berger and Neuhauss2006), suggesting that nyctalopin plays a role in synaptic transmission between photoreceptors and ON-bipolar cells, similar to findings in mouse.
Other genes known to be important in eye and/or retinal development have also been identified in zebrafish bipolar cells. For example, Zrx3 is a paired-class homeobox gene expressed in the outer INL at 41 hpf and throughout the adult INL (Chuang et al., Reference Chuang, Mathers and Raymond1999). Differential and overlapping expression of three Lin7 genes (Lin7a, Lin7b, and Lin7c) is observed in the INL during development, and Lin7 immunoreactivity (IR) was observed in most/all bipolar cells in adult retina (Wei et al., Reference Wei, Luo and Hyde2006). Pax6 expression has also been observed in presumed bipolar cells at 3–4 dpf (Lakowski et al., Reference Lakowski, Majumder and Lauderdale2007).
Bipolar cell types, their physiological properties, and receptor expression patterns
Morphological types
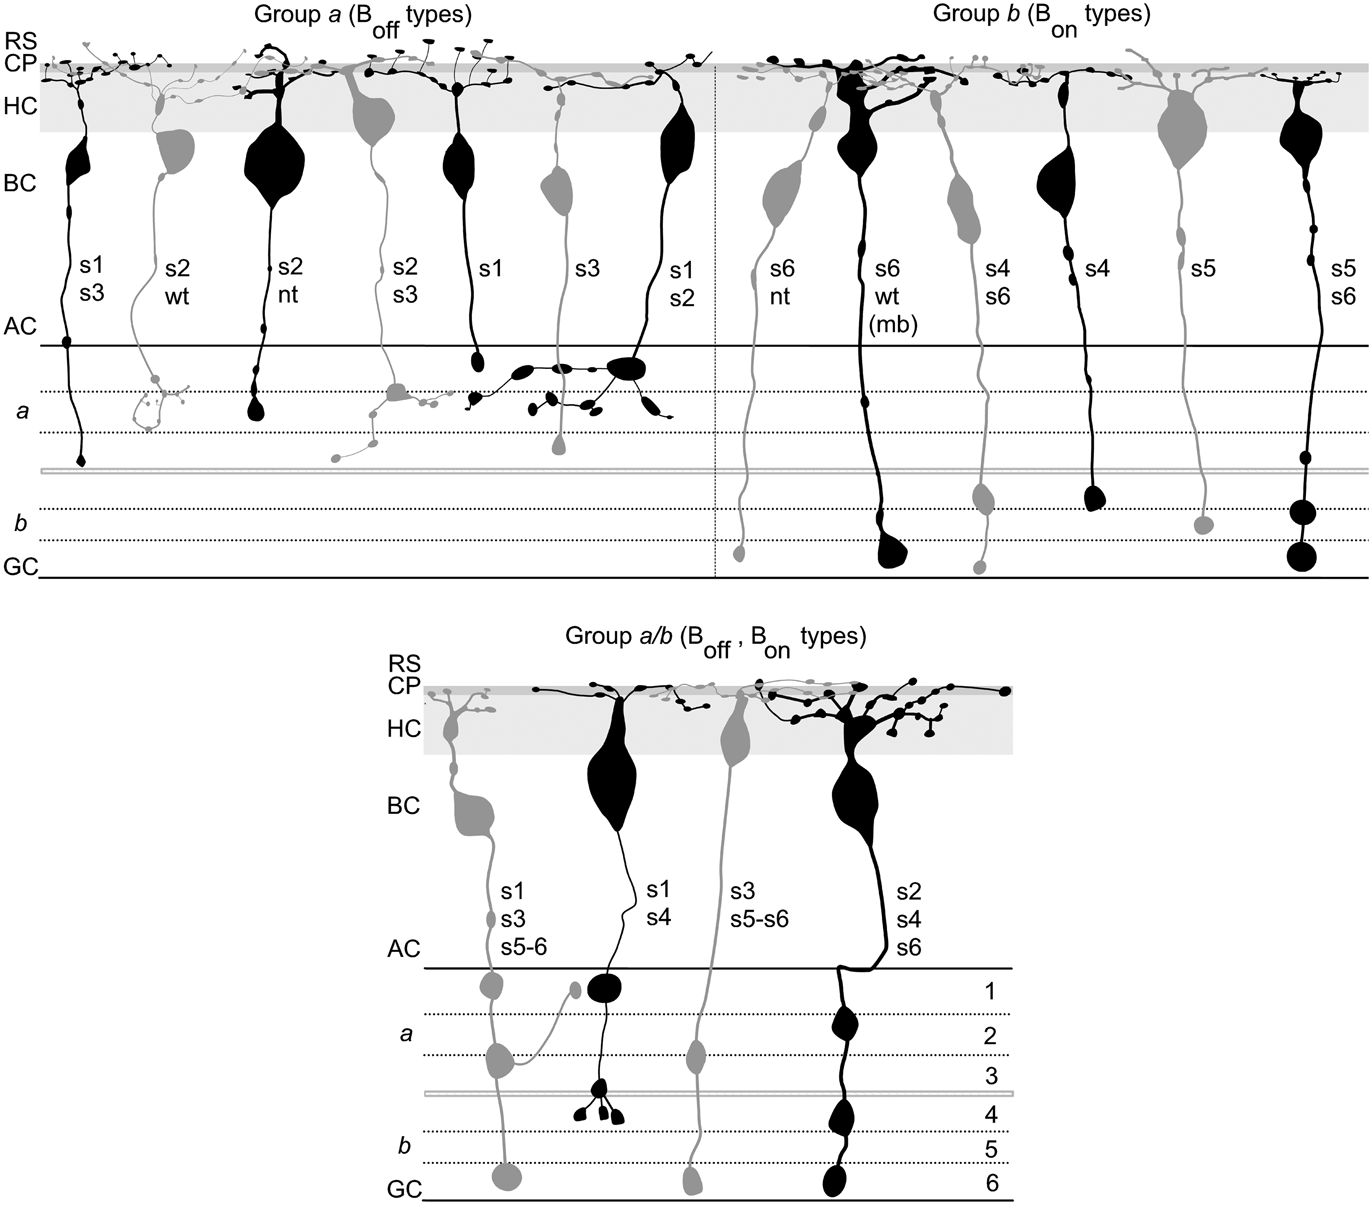
In other cyprinid fish, such as goldfish (Sherry & Yazulla, Reference Sherry and Yazulla1993) and rudd (Scholes, Reference Scholes1975), numerous morphological types of bipolar cells have been identified based on overall morphology, including somal size and location in the INL, dendritic arborization, and axon terminal ramification patterns. Subsequent work using the gene gun DiOlistic technique (Gan et al., Reference Gan, Grutzendler, Wong, Wong and Lichtman2000) in zebrafish retinal slices (Connaughton et al., Reference Connaughton, Graham and Nelson2004) identified 17 morphological types of bipolar cells (Fig. 2). These cells were separated into presumed OFF types (denoted as Boff types; n = 7) with axon terminal(s) ramifying exclusively in sublamina a of the IPL, presumed ON types (Bon cells; n = 6) with terminal(s) ramifying exclusively in sublamina b, and multistratified cells (Boff–Bon cells; n = 4) with terminals in both sublaminae (Connaughton et al. Reference Connaughton, Graham and Nelson2004). A variety of bipolar cell types have also been identified in zebrafish based on neurochemical signature (Marc & Cameron, Reference Marc and Cameron2001).
Seventeen morphological types of bipolar cells have been identified in adult zebrafish retina. Bipolar cells, labeled using the DiOlistic technique in zebrafish retinal slices, were classified primarily by axon terminal ramification patterns in the IPL. Cells with the morphology of OFF bipolars (Group a, Boff cells) had axon terminals restricted to sublamina a of the IPL. Presumed ON-type (Group b; Bon cells) cells had axon terminals restricted to sublamina b of the IPL. Multistratified (Group a/b; Boff–Bon cells) cells had axon terminals in both sublaminae. In each panel, the IPL is separated into six sublayers (1–6), shown at the right. RS, rod spherule layer; CP, cone pedicle layer; HC, horizontal cell layer; BC, bipolar cell layer; AC, amacrine cell layer; GC, ganglion cell layer (Reprinted from Connaughton et al., Reference Connaughton, Graham and Nelson2004, The Journal of Comparative Neurology 477, 371–385).

In addition to morphological diversity, some types of bipolar cells can be selectively labeled with antibodies to various intracellular molecules. For example, labeling retinal cryostat sections with an antibody to either PKC-α (Caminos et al., Reference Caminos, Velasco, Jarrin, Lillo, Jimeno, Aijon and Lara2000) or PKC-α/β (Yazulla & Studholme, Reference Yazulla and Studholme2001) selectively labels ON-bipolar cells with large axon terminals ramifying deep in the IPL. These are Bon-s6L cells in zebrafish (Connaughton et al., Reference Connaughton, Graham and Nelson2004), which are morphologically similar to goldfish Mb-type bipolar cells. PKC(+) bipolar cells are also observed in chicken, rat, and tench (another teleost) (Caminos et al., Reference Caminos, Velasco, Jarrin, Lillo, Jimeno, Aijon and Lara2000). Interestingly, though PKC(+) cells with large terminals, such as Mb-type cells, are found in all three fish species (goldfish, tench, and zebrafish), the somata and terminals of these cells are smallest in zebrafish (Caminos et al., Reference Caminos, Velasco, Jarrin, Lillo, Jimeno, Aijon and Lara2000). The large size of goldfish Mb terminals has allowed them to be directly examined physiologically (i.e., Heidelberger & Matthews, Reference Heidelberger and Matthews1991, Reference Heidelberger and Matthews1992; Matthews et al., Reference Matthews, Ayoub and Heidelberger1994; Burrone & Lagnado, Reference Burrone and Lagnado1997; Matthews, Reference Matthews1999; Hull & Von Gersdorff, Reference Hull and Von Gersdorff2004; Vigh & von Gersdorff, Reference Vigh and von Gersdorff2005; Hull et al., Reference Hull, Li and Von Gersdorff2006; Palmer, Reference Palmer2006; Jones & Palmer, Reference Jones and Palmer2009); such experiments have not yet been performed in zebrafish. Smaller ON-type bipolar cells were also labeled with the PKC-α/β antibody (Yazulla & Studholme, Reference Yazulla and Studholme2001). More recently, two transgenic zebrafish lines, xfz3 and xfz43, that express eGFP (enhanced GFP) in some bipolar cell types have been generated (Zhao et al., Reference Zhao, Ellingsen and Fjose2009). Bipolar cells labeled in the xfz3 line were identified as multistratified Boff-s1/s3/s5 cells and Bon-s3/s5 cells, whereas the eGFP-expressing cells in the xfz43 line were Boff-s2/s3 and Bon-s4 bipolars (Zhao et al., Reference Zhao, Ellingsen and Fjose2009). The ability to develop transgenic zebrafish lines expressing fluorescent markers in populations of bipolar cells, such as xfz43 and zfx3 (Zhao et al., Reference Zhao, Ellingsen and Fjose2009), nyx::MYFP (Schroeter et al., Reference Schroeter, Wong and Gregg2006), and vsx2:dsRed; vsx1:GFP (Vitorino et al., Reference Vitorino, Jusuf, Maurus, Kimura, Higashijima and Harris2009) described above, provides a powerful tool to examine function, morphology, and response of these cells in normal conditions as well as during perturbations, development, and/or disease.
Glutamate
In all vertebrate retinas examined to date, immunocytochemical studies have identified glutamate-positive photoreceptor, bipolar, and ganglion cells, suggesting that these cells release glutamate as their neurotransmitter. This labeling pattern has been confirmed in zebrafish (Connaughton et al., Reference Connaughton, Behar, Liu and Massey1999; Marc & Cameron, Reference Marc and Cameron2001), and studies have examined glutamate-evoked responses and glutamate receptor expression on bipolar cell processes (Table 1).
Physiological and immunocytochemical characteristics of zebrafish bipolar cells

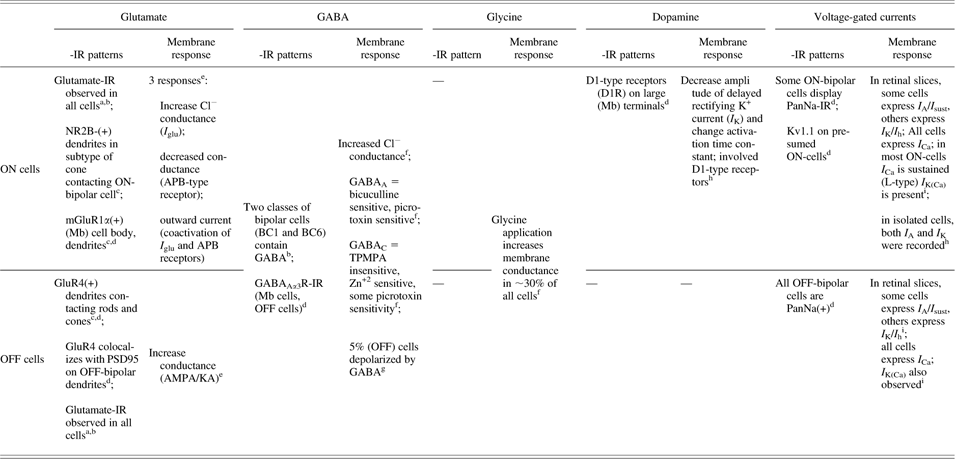
Membrane responses to glutamate, GABA, glycine, and dopamine recorded from zebrafish bipolar cells are summarized, as are -IR patterns associated with these ligands. Similar data are also presented for voltage-gated current responses. Most published information pertains to ON or OFF cells in general, though information related to a specific subtype of bipolar cell is indicated, if known.—indicates no data has been published.
References cited within the table are noted by superscripts.
a Connaughton et al. (Reference Connaughton, Behar, Liu and Massey1999).
b Marc and Cameron (Reference Marc and Cameron2001).
c Klooster et al. (Reference Klooster, Yazulla and Kamermans2009).
d Yazulla and Studholme (Reference Yazulla and Studholme2001).
e Connaughton and Nelson (Reference Connaughton and Nelson2000).
f Connaughton et al. (Reference Connaughton, Nelson and Bender2008).
g unpublished observations.
h Yu and Li (Reference Yu and Li2005).
i Connaughton and Maguire (Reference Connaughton and Maguire1998).
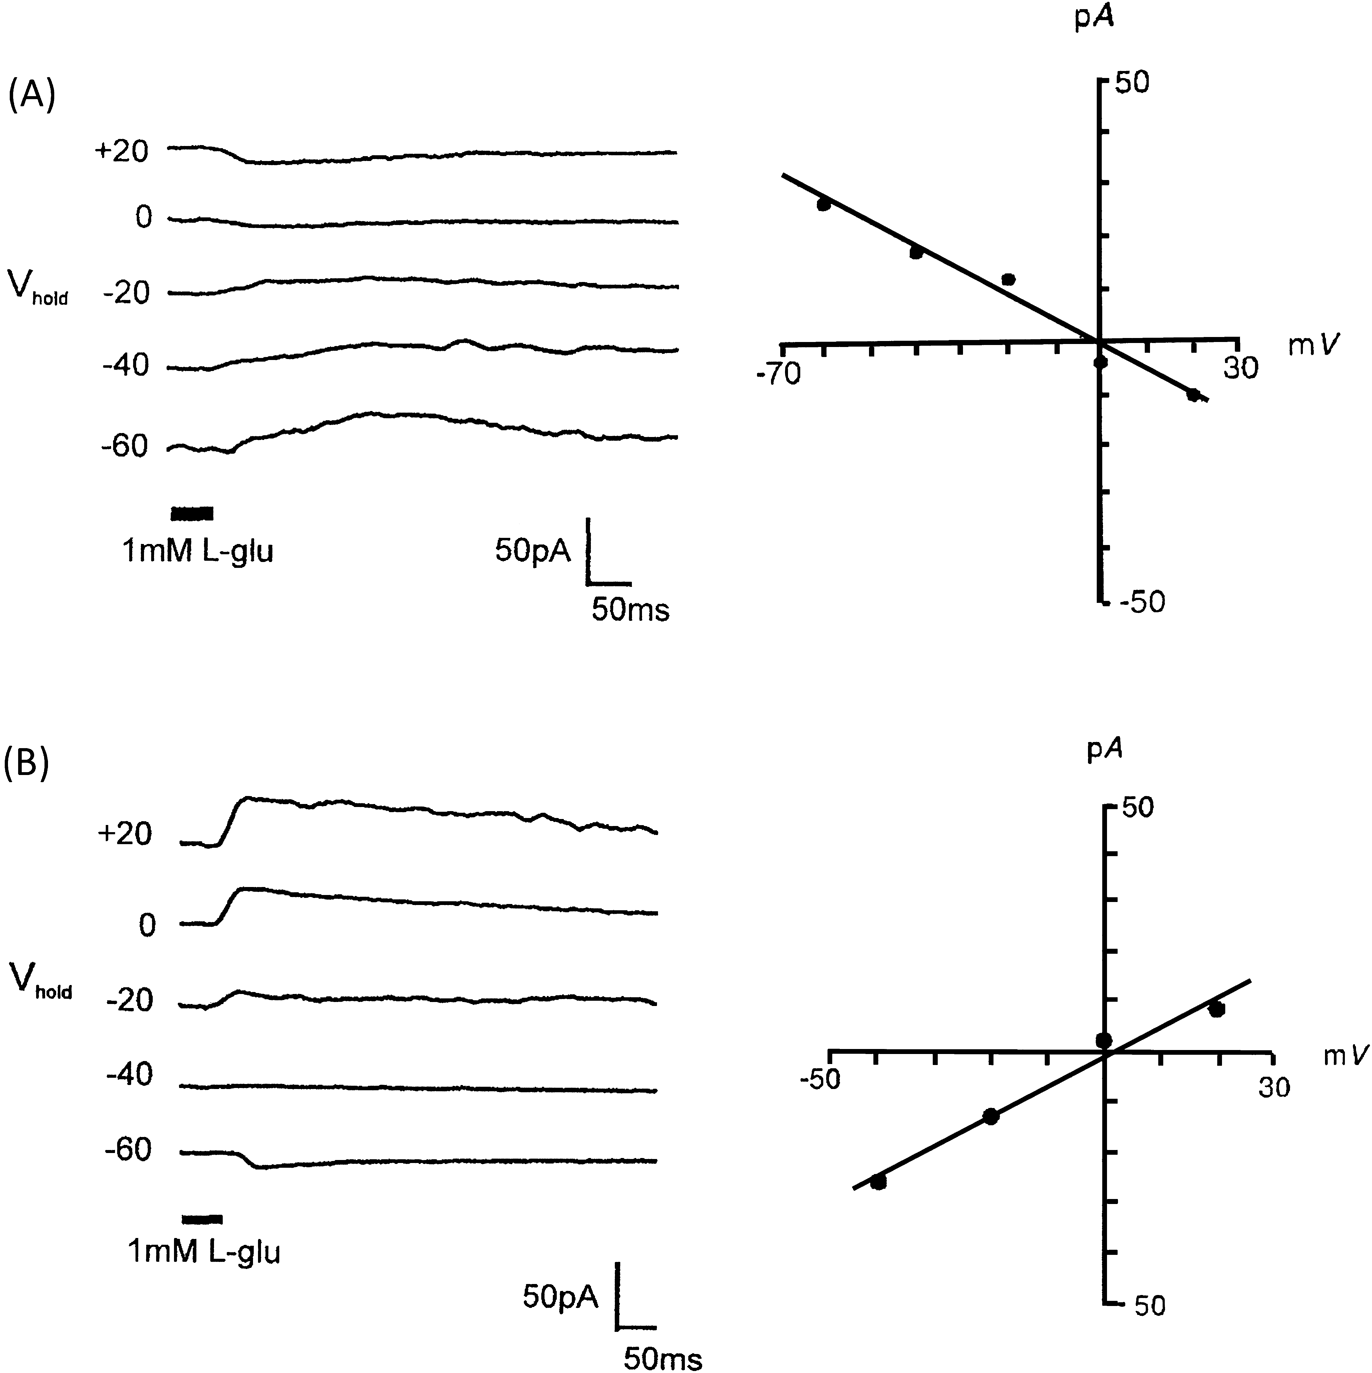
Using whole-cell patch-clamp techniques in zebrafish retinal slices, glutamate-gated currents were recorded from bipolar cells following focal application of l-glutamate (1 mM) onto the dendritic arbor (Connaughton & Nelson, Reference Connaughton and Nelson2000). Results from this work identified four glutamate-evoked responses in zebrafish bipolar cells. OFF-type bipolar cells with axon terminals ramifying exclusively in IPL sublamina a responded to glutamate application with a conductance increase and a reversal potential (E rev) ∼0 mV (Fig. 3). A similar response was elicited following the application of the ionotropic glutamate agonist kainate, consistent with OFF-bipolar cell responses reported in other species. Glutamate- and kainate-gated currents were also recorded from multistratified bipolar cells in zebrafish with terminals in both sublaminae a and b (Connaughton & Nelson, Reference Connaughton and Nelson2000) suggesting that OFF-bipolar cell axon terminals are not restricted to the distal IPL. ON-bipolar cells with terminals ramifying exclusively in sublamina b responded to glutamate application with one of three possible conductance mechanisms: (a) a conductance decreases with an E rev ∼0 mV (Figs. 3 and 4) that could also be elicited using the ON-bipolar–selective metabotropic glutamate receptor agonist APB (l-(+)-2-amino-4-phosphonobutyric acid or LAP4); (b) a conductance increases with an E rev ∼ E Cl (Fig. 4) characterized as I glu, the glutamate receptor with transporter-like pharmacology associated with a chloride conductance (i.e., Grant & Dowling, Reference Grant and Dowling1995, Reference Grant and Dowling1996); or (c) a current that was outward going at all holding potentials tested (−60 to +20 mV) with no apparent reversal potential resulting from the activation of both the APB-sensitive current and the I glu (Connaughton & Nelson, Reference Connaughton and Nelson2000). These findings for zebrafish ON-type bipolar cells are similar to responses recorded in white bass (Grant & Dowling, Reference Grant and Dowling1995, Reference Grant and Dowling1996). Of these three mechanisms, the majority (∼60%) of recorded zebrafish bipolar cells expressed the glutamate-gated chloride conductance; APB responses were present in only 4% of recorded ON-type cells (Connaughton & Nelson, Reference Connaughton and Nelson2000). APB-elicited currents were identified in bipolar cells with axon terminals ramifying deep in the IPL [i.e., Bon-s6L (Mb-type) cells], while I glu was identified in bipolar cells with smaller, or multiple, synaptic boutons. Multistratified (Group a/b) ON-type bipolars in zebrafish expressed I glu exclusively and have axon terminals located proximally in both sublaminae (Connaughton & Nelson, Reference Connaughton and Nelson2000). Expression of different glutamate conductance mechanisms on teleost ON-bipolar cells is suggested to underlie different photoreceptor inputs to these cells (Grant & Dowling, Reference Grant and Dowling1995, Reference Grant and Dowling1996; Wong, Cohen, et al., Reference Wong, Cohen and Dowling2005; Wong & Dowling, Reference Wong and Dowling2005, and see below).
Voltage- and glutamate-gated currents are present in bipolar cells in adult and larval retina. Whole-cell voltage clamp recordings of adult (A and B) and larval (C and D) bipolar cells. (A) Depolarizing voltage steps elicited two different outward potassium currents: a rapidly activating and inactivating I A current (left) and a delayed rectifying I K current (right). Expression of these depolarization-elicited outward currents allowed adult bipolar cells to be separated into two populations (Reprinted from Connaughton & Maguire, Reference Connaughton and Maguire1998, The European Journal of Neuroscience 10, 1350–1362). These currents were also identified in bipolar cells recorded from 8 dpf retinal slices. (C) ON- and OFF-type bipolar cells were identified by their glutamate-evoked responses. In adult bipolar cells (B), OFF-bipolar cells responded to glutamate application with a conductance increase and a reversal potential ∼0 mV (left). This response was also elicited by the agonist kainate (not shown). Some ON-bipolar cells expressed an APB-sensitive metabotropic response to glutamate application characterized by a conductance decrease (right) and a reversal potential ∼0 mV (Reprinted from Connaughton & Nelson, Reference Connaughton and Nelson2000, Journal of Physiology 524, 135–146). (D) OFF-bipolar kainate responses and ON-bipolar APB responses were also recorded from bipolar cells in larval retinas (C and D reprinted from Progress in Brain Research, Vol. 131, Connaughton, V.P. Organization of ON- and OFF-pathways in the zebrafish retina: Neurotransmitter localization, electrophysiological responses of bipolar cells, and patterns of axon terminal stratification, 161–176, 2006, with permission from Elsevier.)

ON-bipolar cells express two glutamate-gated conductance mechanisms. Whole-cell patch-clamp recordings of zebrafish bipolar cells in retinal slices identified two glutamate responses in ON-type bipolar cells. (A) In 4% of cells, glutamate application elicited a conductance decrease with a reversal potential ∼0 mV. This response was also elicited by focal application of 2-amino-4-phosphonobutyric acid (APB or LAP4) onto the dendritic arbor, indicating that it is mediated by metabotropic glutamate receptors. (B) Most ON-cells (60%), however, responded to glutamate application with I glu; the glutamate-gated chloride conductance mediated through a receptor with transporter-like pharmacology. Morphologically, recorded cells had axon terminals restricted to sublamina b (APB and I glu responses); some recorded cells had terminals in both sublaminae (I glu). For (A) and (B), each set of current traces (left) is accompanied by the corresponding current–voltage relationship. Taken together, these findings indicate that both glutamate transporters and metabotropic receptors are present on ON-type bipolar cells (Reprinted from Connaughton & Nelson, Reference Connaughton and Nelson2000, Journal of Physiology 524, 135–146).

Light responses have not been recorded from zebrafish bipolar cells. However, light responses from bipolar cells in the closely related giant danio (Wong, Cohen, et al., Reference Wong, Cohen and Dowling2005; Wong & Dowling, Reference Wong and Dowling2005) show results that are similar to the above described glutamate responses as multiple glutamate conductance mechanisms were found to underlie ON-bipolar light responses in this species (Wong, Cohen, et al., Reference Wong, Cohen and Dowling2005; Wong & Dowling, Reference Wong and Dowling2005). Whole-cell patch-clamp recordings of light- and d-aspartate–evoked responses in giant danio ON-cone (Cb) bipolar cells were mediated by chloride currents through the activation of TBOA-sensitive glutamate transporters (EAAT or excitatory amino acid transporters). In contrast, mixed (Mb-type) ON-type bipolar cells were found to coexpress EAAT and LAP4-sensitive metabotropic receptors (mGluR6) (Wong, Cohen, et al., Reference Wong, Cohen and Dowling2005). Light-evoked responses recorded from these Mb cells confirmed that both conductance mechanisms are present and, as noted above, that each mechanism underlies different photoreceptor inputs: mGluR6 mediates rod-driven responses, while both EAAT and mGluR6 mediate cone-driven responses, with most cone inputs activating EAATs (Wong, Cohen, et al., Reference Wong, Cohen and Dowling2005). Giant danio multistratified (Cab) bipolar cells have axon terminals in both IPL sublaminae (i.e., Group a/b cells of Connaughton & Nelson, Reference Connaughton and Nelson2000) and coexpress OFF-type AMPA/kainate receptors and ON-type EAAT receptors on their dendrites (Wong & Dowling, Reference Wong and Dowling2005). In these cells, the polarity of response depends on the ratio/number of each receptor type expressed. ON–OFF responses, resulting from differential inputs to these receptors from different cone types, were also observed in some Cab cells (Wong & Dowling, Reference Wong and Dowling2005). Similarly, multistratified salamander bipolar cells, with terminals in both sublaminae, are able to generate both ON- and OFF-light responses (Wu et al., Reference Wu, Gao and Maple2000) due to the expression of both metabotropic and ionotropic (AMPA/kainate) receptors on the dendrites (Pang et al., Reference Pang, Gao and Wu2004). Coactivation of both the receptor types in giant danio also results in color-opponent responses in Cab cells (Wong & Dowling, Reference Wong and Dowling2005).
The above glutamate- (zebrafish) and light-evoked (giant danio) responses were recorded in adult animals. Similar mechanisms are also present in larval retinas. Patch-clamp recordings of bipolar cells in retinal slices from 8 dpf zebrafish larvae (Fig. 3) have identified kainate- and APB-evoked glutamate conductance mechanisms, as well as adult-like depolarization-elicited potassium currents (Connaughton, Reference Connaughton2001). Recent molecular work has identified the expression of eaat7 in zebrafish bipolar cells using in situ hybridization (Kastenhuber et al., Reference Kastenhuber, Maurer, Gesemann, Frueh, Renninger and Neuhauss2010) and mGluR6 is found in the larval OPL (Huag et al., Reference Huag, Huang, Gesemann and Neuhauss2010). These findings indicate that glutamatergic synaptic transmission present in adult retinas is also apparent and functional in zebrafish larvae.
Most physiological data of zebrafish retinal activity has been recorded using ERGs. ERGs have been documented using intact larvae and adults (Grant & Dowling, Reference Grant and Dowling1996; Hughes et al., Reference Hughes, Saszik, Bilotta, DeMarco and Patterson1998; Bilotta et al., Reference Bilotta, Saszik and Sutherland2001; Patterson et al., Reference Patterson, McDowell, Hughes and Bilotta2002; Saszik et al., Reference Saszik, Alexander, Lawrence and Bilotta2002; Seeliger et al., Reference Seeliger, Rilk and Neuhauss2002; Ren & Li, Reference Ren and Li2004; Vitorino et al., Reference Vitorino, Jusuf, Maurus, Kimura, Higashijima and Harris2009), isolated larval eyes (Wong et al., Reference Wong, Gray, Hayward, Adolph and Dowling2004), and adult eyecup preparations (Wong, Adolph, et al., Reference Wong, Adolph and Dowling2005; Nelson & Singla, Reference Nelson and Singla2009). ERGs reflect whole-retina responses to light, and each component of the ERG is attributed to the response of a specific retinal cell type(s). For example, zebrafish OFF-bipolar cell responses mediated by AMPA/kainate-type glutamate receptors are represented by the ERG d-wave (Wong et al., Reference Wong, Gray, Hayward, Adolph and Dowling2004; Wong, Adolph, et al., Reference Wong, Adolph and Dowling2005), as also reported in frog (Xu & Karwoski, Reference Xu and Karwoski1995), though a component of the a-wave is also attributed to OFF-bipolar cell signals (Nelson & Singla, Reference Nelson and Singla2009). In contrast, the b-wave, which reflects the overall activity of ON-bipolar cells (i.e., Stockton & Slaughter, Reference Stockton and Slaughter1989), is more complex in zebrafish as it involves multiple conductance mechanisms, consistent with data from patch-clamp recordings. In particular, the glutamate transporter antagonist TBOA blocks most of the b-wave response in larval zebrafish (and giant danio) ERGs, while LAP4 application results in only a slight reduction in amplitude (Wong et al., Reference Wong, Gray, Hayward, Adolph and Dowling2004; Wong, Adolph, et al., Reference Wong, Adolph and Dowling2005), suggesting that glutamate transporters mediate the majority of the b-wave response.
ERGs have also been used to identify different photoreceptor inputs to bipolar cells, and both rod and cone contributions to the b-wave have been identified (Ren & Li, Reference Ren and Li2004; Wong, Adolph, et al., Reference Wong, Adolph and Dowling2005). As discussed above, cone contributions are mediated by two glutamate receptor mechanisms, while rod inputs to the b-wave are only mediated by metabotropic receptors (Wong, Adolph, et al., Reference Wong, Adolph and Dowling2005). More specifically, ERGs have been used to identify the contributions of different cone types (i.e., red, green, blue, UV) to ON-bipolar cell responses (i.e., Hughes et al., Reference Hughes, Saszik, Bilotta, DeMarco and Patterson1998; Saszik et al., Reference Saszik, Alexander, Lawrence and Bilotta2002; Nelson & Singla, Reference Nelson and Singla2009). For example, in their recent analysis of the photopic ERG in adult zebrafish, Nelson and Singla (Reference Nelson and Singla2009) identified that cone inputs to the two subelements of b-wave (PII) vary: the PIIm component generated by metabotropic (APB-sensitive) responses receives inputs predominantly from blue and UV cones, while cone inputs to the nonmetabotropic (presumed transporter) PIInm component are spectrally broad, consistent with more uniform inputs from different cone types. Similarly, Saszik et al. (Reference Saszik, Alexander, Lawrence and Bilotta2002) reported that the b-wave in adult zebrafish was differentially sensitive to APB, with APB application reducing responses to blue and UV, but not longer, stimulating wavelengths. Taken together, these results indicate that zebrafish ON-bipolar cells receive inputs from spectrally different cones and that these inputs are mediated by the activation of different types and/or combinations of glutamate receptors. Furthermore, spectral sensitivity functions, determined from ERG recordings (Hughes et al., Reference Hughes, Saszik, Bilotta, DeMarco and Patterson1998; Patterson et al., Reference Patterson, McDowell, Hughes and Bilotta2002; Saszik et al., Reference Saszik, Alexander, Lawrence and Bilotta2002), identify color-opponent and nonopponent mechanisms that contribute to the b-wave response. The short wavelength portion of the spectral sensitivity function was attributed to nonopponent UV and blue cone inputs. In contrast, spectral sensitivity functions at longer (middle to long) wavelengths result from opponent/inhibitory mechanisms between red (L) and green (M) or between green (M) and blue (S) cones (Hughes et al., Reference Hughes, Saszik, Bilotta, DeMarco and Patterson1998). Clearly, circuitry within the distal zebrafish retina is complex and includes both distinct pathways for each cone type as well as interaction/integration among different inputs to bipolar cells (i.e., Nelson & Singla, Reference Nelson and Singla2009).
In agreement with the above physiological data, a recent morphological study (Li & Dowling, Reference Li and Dowling2010) identified different spectral classes of bipolar cells by comparing their dendritic spread and morphology to the photoreceptor mosaic in transgenic SWS1-GFP fish. These authors report that some bipolar cells are connected to several different cone types (i.e., red, green, blue or green, blue, and UV), while others have more selective contacts, such as green and UV cone connections. Their results also indicate that some zebrafish bipolar cells are connected to both rods and cones, while others exclusively contact cones (Li & Dowling, Reference Li and Dowling2010).
Immunocytochemical studies have localized glutamate receptor subtypes on bipolar dendrites. GluR4-IR is found on zebrafish OFF-bipolar cell processes, and mGluR1α-IR is localized to the dendrites of large ON-type bipolar cells (Yazulla & Studholme, Reference Yazulla and Studholme2001; Klooster et al., Reference Klooster, Yazulla and Kamermans2009), findings that are consistent with glutamate-elicited current responses generated in these cells (Connaughton & Nelson, Reference Connaughton and Nelson2000). These findings are also consistent with IR patterns found in goldfish, as some ON-type bipolar cells, including Mb cells, display mGluR1α-IR (Yazulla et al., Reference Yazulla, Studholme, Fan and Mora-Ferrer2001; Joselevitch et al., Reference Joselevitch, Klooster and Kamermans2007), and GluR4-IR was identified on presumed OFF-bipolar processes in the OPL (Vandenbranden et al., Reference Vandenbranden, Kamphuis, Nunes Cardozo and Kamermans2000). Catfish bipolar cells are also labeled with antibodies to metabotropic glutamate receptors (Gafka et al., Reference Gafka, Vogel and Linn1999). Interestingly, immunoreactive puncta labeling the NR2B subunit of NMDA receptors (but not NR1; Yazulla & Studholme, Reference Yazulla and Studholme2001) were also identified on ON-bipolar dendrites in zebrafish (Klooster et al., Reference Klooster, Yazulla and Kamermans2009), though NMDA-evoked responses were not recorded from these cells (Connaughton & Nelson, Reference Connaughton and Nelson2000).
GABA and glycine
Inhibitory GABAergic and glycinergic processes are found in both plexiform layers in the zebrafish retina (Connaughton et al., Reference Connaughton, Behar, Liu and Massey1999; Marc & Cameron, Reference Marc and Cameron2001; Yazulla & Studholme, Reference Yazulla and Studholme2001). These processes are associated with horizontal (GABA), amacrine (GABA, glycine), and/or interplexiform (glycine) cells, as reported in other species (Marc & Lam, Reference Marc and Lam1981; Kalloniatis & Marc, Reference Kalloniatis and Marc1990; Yazulla & Studholme, Reference Yazulla and Studholme1990; Sherry et al., Reference Sherry, Micich and Yazulla1993). Within both plexiform layers, GABA labeling is more prominent. GABA-IR is found throughout the IPL, except for an immunonegative band in mid-IPL that labels positively with an antibody to glycine (Connaughton et al., Reference Connaughton, Behar, Liu and Massey1999). Furthermore, GABAA α-3 receptor-IR is observed on PKC(+) ON-type and all OFF-type bipolar cells (Yazulla & Studholme, Reference Yazulla and Studholme2001), suggesting that these cells receive GABAergic inputs. Immunoreactivity for the GABAC receptor ρ-subunit was observed in the outer INL and as puncta throughout the IPL. Glycine receptor-IR was more prominent in the zebrafish IPL than the OPL (Yazulla & Studholme, Reference Yazulla and Studholme2001), consistent with IR patterns in goldfish where glycine receptors were identified on both Ma and Mb cell terminals (Yazulla & Studholme, Reference Yazulla and Studholme1991).
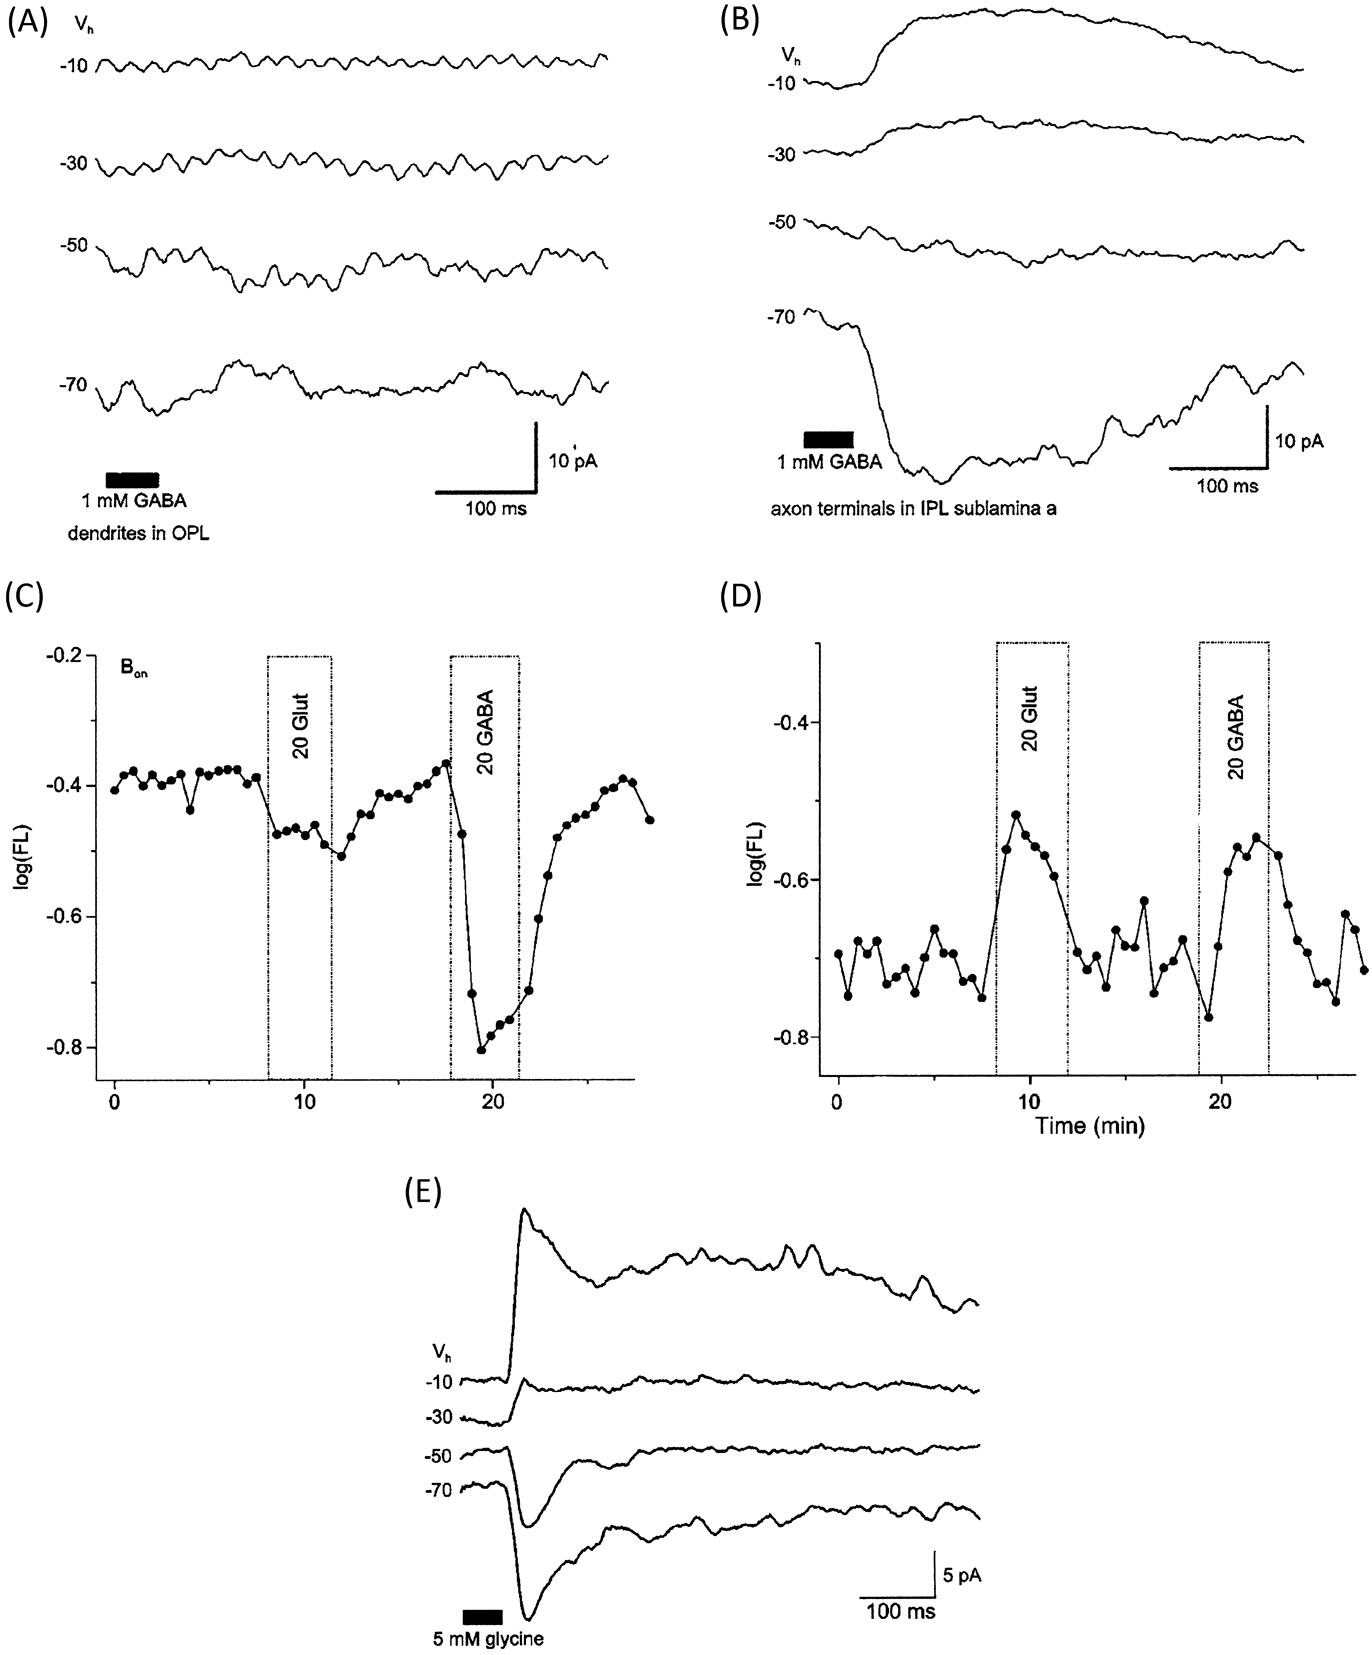
GABA- and glycine-gated currents (Fig. 5) have been identified using voltage-probe responses in isolated cells and whole-cell patch-clamp techniques in zebrafish retinal slices (Connaughton et al., Reference Connaughton, Nelson and Bender2008). Interestingly, focal application of GABA onto bipolar cell dendrites in retinal slices did not evoke a response, though isolated axotomized cells responded robustly to GABA application, a discrepancy presumably due to the loss of dendritic processes during retinal slice preparation (Connaughton et al., Reference Connaughton, Nelson and Bender2008). Consequently, retinal slices were used to characterize GABA-evoked responses from bipolar axon terminals, while dendritic responses were better examined in isolated cells. GABA-gated currents have also been reported in bipolar cells in a variety of other species, including salamander (Lukasiewicz & Shields, Reference Lukasiewicz and Shields1998), skate (Qian et al., Reference Qian, Li, Chappell and Ripps1997, Reference Qian, Ripps, Schuette and Chappell2001), hybrid bass (Qian & Dowling, Reference Qian and Dowling1995), rat (Euler & Wassle, Reference Euler and Wassle1998), carp (Han et al., Reference Han, Li and Yang1997), and goldfish (Tachibana & Kaneko, Reference Tachibana and Kaneko1987). Overall, GABA-evoked currents in zebrafish (Table 1) have some general characteristics similar to those reported in these species, though differences were also observed.
Inhibitory GABA- and glycine-evoked currents in zebrafish bipolar cells. Focal application of 1 mM GABA onto bipolar cell dendrites (OPL) in retinal slices did not elicit a response (A); however, focal application onto axon terminals (IPL) evoked robust currents (B) with a negative reversal potential (between −30 and −50 mV) that was carried by chloride ions. GABA-evoked chloride currents were recorded from both ON- (terminals in sublamina b) and OFF- (terminals in sublamina a) cells in retinal slices. (C and D) GABA-elicited responses were also observed in voltage-probe recordings of isolated cells. In (C), an ON-bipolar cell hyperpolarized by glutamate (measured as a decrease in membrane fluorescence, log FL, following glutamate application, 20 Glut) was also hyperpolarized by GABA (20 GABA). OFF-type bipolar cells that increased membrane fluorescence during glutamate application (= depolarized by glutamate, D) were also hyperpolarized by GABA, though the cell shown in (D) responded to GABA application with an increase in membrane fluorescence (= depolarized by GABA). (E) Focal application of glycine (5 mM) onto bipolar cell dendrites or axon terminals elicited a response in ∼30% of recorded cells. Similar results were obtained in isolated cells (not shown). For (A), (B), and (E) holding potentials (V H) are given to the left of each trace; the black bar at the bottom indicates duration of drug application. For (C) and (D), log FL (fluorescence) represents the background-subtracted voltage probe fluorescence (Reprinted from Connaughton et al., Reference Connaughton, Nelson and Bender2008, Visual Neuroscience 25, 139–153. Reprinted with permission).

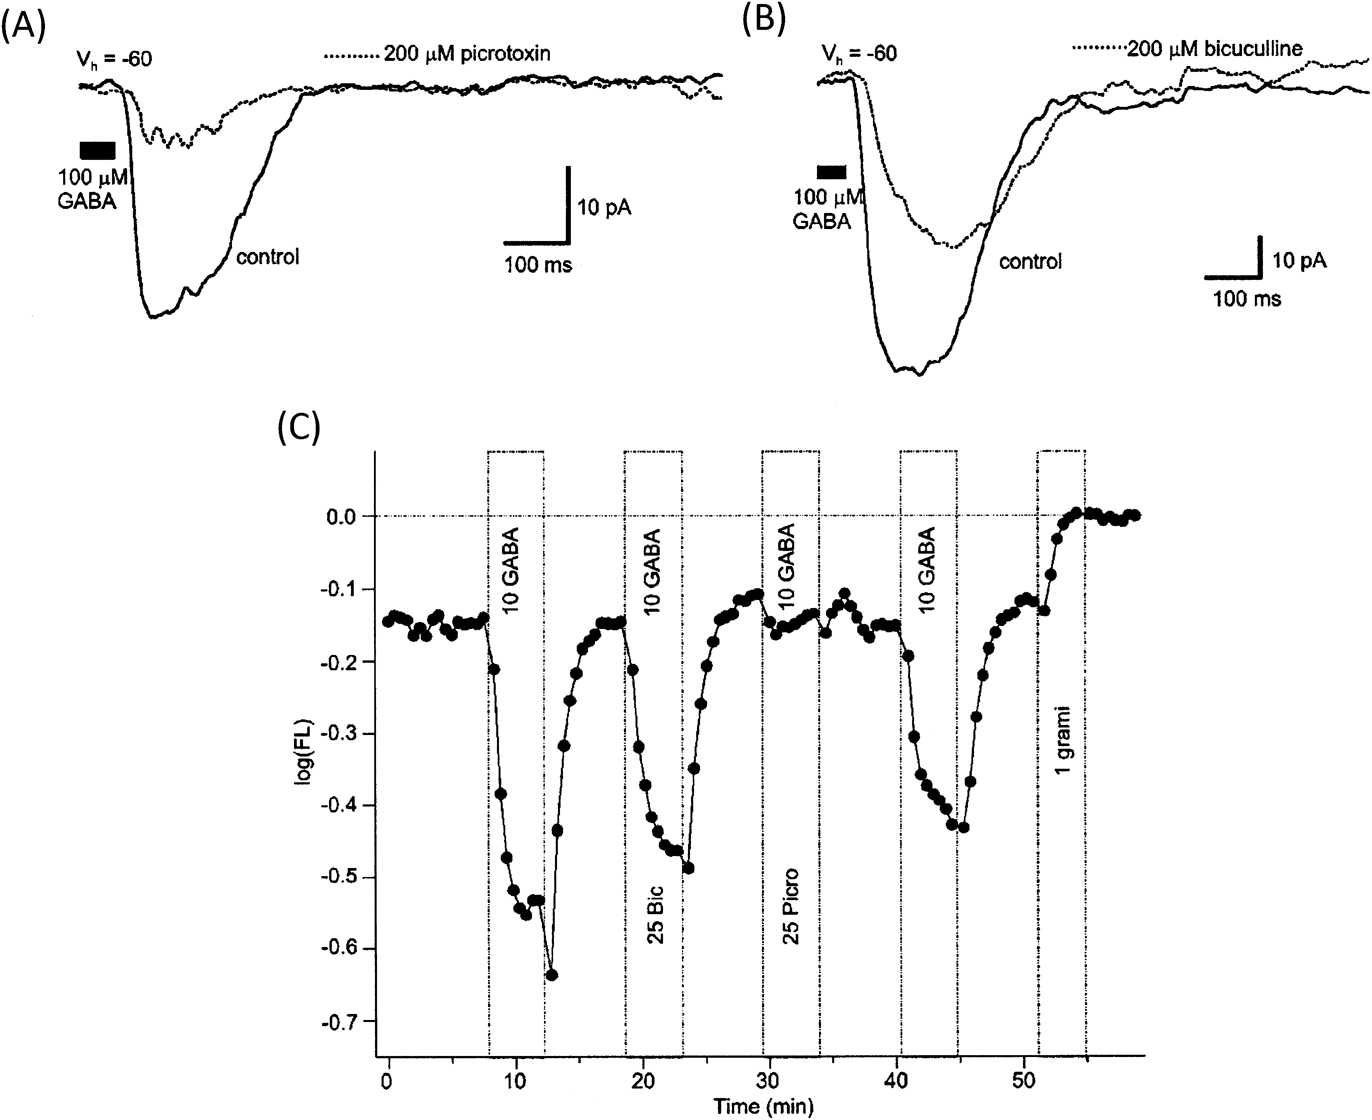
In retinal slices, focal application of GABA onto bipolar cell terminals elicited a current in both ON- and OFF-type monostratified and multistratified cells. Similarly, in isolated cells, GABA responses were recorded from ON cells hyperpolarized by glutamate and OFF cells depolarized by glutamate. In all cases, GABA-elicited responses were associated with a chloride conductance (Connaughton et al., Reference Connaughton, Nelson and Bender2008). GABA responses in zebrafish bipolar cells were partially blocked by the GABAA receptor antagonist bicuculline and sensitive to (though not always completely blocked by) the mixed GABAA/C antagonist picrotoxin (Fig. 6), indicating that zebrafish bipolar cells express both GABAA and GABAC type receptors. Furthermore, GABAC receptors on isolated zebrafish bipolar cells are antagonized by zinc, as reported in skate (Qian et al., Reference Qian, Li, Chappell and Ripps1997), hybrid bass (Qian & Dowling, Reference Qian and Dowling1995), and mouse (Kaneda et al., Reference Kaneda, Andrasfalvy and Kaneko2000) retinas, but insensitive to (1,2,5,6-tetra hydropyridine-4-yl) methyl phosphinic acid (TPMPA). TPMPA insensitivity was surprising as published reports have shown this compound to be a selective antagonist for GABAC-type receptors (Ragozzino et al., Reference Ragozzino, Woodward, Murata, Eusebi, Overman and Miledi1996) and effective at blocking GABAC responses in retinal bipolar cells in both fish (Hull et al., Reference Hull, Li and Von Gersdorff2006; Palmer, Reference Palmer2006; Jones & Palmer, Reference Jones and Palmer2009) and mammals (McGillem et al., Reference McGillem, Rotolo and Dacheux2000; Matsui et al., Reference Matsui, Hasegawa and Tachibana2001). Overall, these observed pharmacological responses suggest that GABAC receptors expressed on zebrafish bipolar cells may have a different subunit composition than other species. The distribution of GABAA- and GABAC-type receptors varied between bipolar cell processes: dendrites were found to be picrotoxin sensitive and bicuculline insensitive, while axon terminals were both picrotoxin and bicuculline sensitive. Thus, GABAC-type receptors predominate on dendrites, and a combination of GABAA- and GABAC-type receptors are expressed on axon terminals (Connaughton et al., Reference Connaughton, Nelson and Bender2008). In other species, GABA receptors on bipolar cells mediate lateral inhibitory inputs, particularly from amacrine cells. For example, the large Mb axon terminals of goldfish also coexpress GABAA- and GABAC-type receptors (Vigh & von Gersdorff, Reference Vigh and von Gersdorff2005; Palmer, Reference Palmer2006; Jones & Palmer, Reference Jones and Palmer2009). In this species, GABAC receptors, working with GAT-1 GABA transporters, mediate the tonic inhibitory current recorded from terminals (Hull et al., Reference Hull, Li and Von Gersdorff2006; Jones & Palmer, Reference Jones and Palmer2009), while GABAA receptors (and GABAC receptors) are stimulated by evoked release of GABA from amacrine cells (Vigh & von Gersdorff, Reference Vigh and von Gersdorff2005; Jones & Palmer, Reference Jones and Palmer2009). Glycine-elicited responses in zebrafish (Fig. 5) were recorded in ∼30% of bipolar cells following exogenous application of glycine to either the dendritic arbor or the axon terminal (Connaughton et al., Reference Connaughton, Nelson and Bender2008). Differential sensitivity to glycine has also been reported in skate retina (Qian et al., Reference Qian, Ripps, Schuette and Chappell2001). Thus, zebrafish bipolar cells receive inhibitory glycinergic and GABAergic inputs. In contrast to glycine-evoked responses, all cells examined responded to GABA, indicating that the majority of inhibitory inputs to these cells originates from GABAergic neurons (Connaughton et al., Reference Connaughton, Nelson and Bender2008).
GABAA- and GABAC-type receptors are expressed on bipolar cell processes. GABA-gated currents in zebrafish bipolar cells recorded in retinal slices (A and B) were partially blocked by picrotoxin (200 μM, A) and bicuculline (200 μM, B). Isolated bipolar cells recorded with the voltage-probe oxonol were also partially sensitive to bicuculline (25 Bic/10 GABA), while picrotoxin significantly reduced the GABA-evoked hyperpolarization (25 Picro/10 GABA). For (A) and (B), GABA responses were recorded at a holding potential (V H) of −60 mV; black bar indicates duration of GABA application. For (C), log FL represents the background-subtracted voltage probe fluorescence. Decreases in fluorescence correspond to membrane hyperpolarizations. Concentrations are in μM (Reprinted from Connaughton et al., Reference Connaughton, Nelson and Bender2008, Visual Neuroscience 25, 139–153. Reprinted with permission).

Though GABA hyperpolarized most bipolar cells, a minority of isolated cells (∼5%) were depolarized by GABA (Nelson et al., Reference Nelson, Bender and Connaughton2008). GABA-elicited depolarizations were only observed in OFF-bipolar cells (unpublished observations). This depolarization was blocked by Li+ substitution for Na+ in the external media, suggesting that it is transporter mediated. GABA-evoked transporter currents have also been reported in some salamander bipolar cells (Yang, Reference Yang1998), and ∼13% (8 of 60) of isolated skate bipolar cells are depolarized by GABA (Lasater et al., Reference Lasater, Dowling and Ripps1984). GABA-elicited depolarization in zebrafish bipolar cells (Fig. 5D) was surprising, as GABA-positive bipolar cells were not previously observed in vibratome sections that were probed with an antibody to either GABA or GAD (Connaughton et al., Reference Connaughton, Behar, Liu and Massey1999; Yazulla & Studholme, Reference Yazulla and Studholme2001). However, neurochemical analysis identified a subset of presumed bipolar cells that are GABA positive (Marc & Cameron, Reference Marc and Cameron2001), and punctate labeling with an antibody to the GABA transporter GAT-2 was identified in the mid- to distal-INL (Yazulla & Studholme, Reference Yazulla and Studholme2001), suggesting that some bipolar cells in the zebrafish retina may contain GABA and release it as their neurotransmitter.
Dopamine
Teleost retinas, including zebrafish, contain a single dopamine-positive cell type, the dopaminergic interplexiform cell, which has processes in both the IPL and the OPL (Kalloniatis & Marc, Reference Kalloniatis and Marc1990; Yazulla & Studholme, Reference Yazulla and Studholme2001). Immunoreactivity for D1-type dopamine receptors has been identified on the terminals of some ON-bipolar cells in zebrafish (Yazulla & Studholme, Reference Yazulla and Studholme2001) and PKC(+) ON bipolars in goldfish (Mora-Ferrer et al., Reference Mora-Ferrer, Yazulla, Studholme and Haak-Frendscho1999), suggesting that these cells receive dopaminergic inputs. To that end, delayed rectifying I K potassium currents in isolated zebrafish bipolar cells were decreased (Fig. 7; Table 1) following dopamine application (Yu & Li, Reference Yu and Li2005). This response was mimicked by applying the D1 receptor agonist SKF38393 and by activating components of the intracellular G-protein cascade in these cells (Yu & Li, Reference Yu and Li2005). These responses are similar to those found in goldfish, where application of either dopamine or ascorbate modulates I K through the activation of D1-type dopamine receptors (Fan & Yazulla, Reference Fan and Yazulla1999a). In contrast, chronic application of dopamine in the bath solution enhanced outward potassium currents in zebrafish retinal slices (Fig. 7), with activation of both D1- and D2-type dopamine receptors involved in the response (Connaughton & Warndorf, Reference Connaughton and Warndorf2005). Exogenous dopamine application also modulates glutamate responses in isolated zebrafish bipolar cells (Asare et al., Reference Asare, Nelson and Connaughton2005).
Dopamine alters the amplitude of delayed rectifying potassium currents. Whole-cell patch recordings of delayed rectifying (I K) currents in isolated zebrafish bipolar cells recorded (A) before/control, (B) during, and (C) after/washout of application of 50 μM dopamine show dopamine application decreases I K. (D) Summary of current–voltage relationship. In retinal slices, however, chronic application of 200 μM dopamine in the bath solution enhanced I K amplitude (F) compared to currents recorded in control/standard extracellular solution (E). (G) A representative current–voltage relationship for the effect of dopamine in retinal slices. (A–D reprinted from Yu & Li, Reference Yu and Li2005, Journal of Neuroscience Research 82, 368–376).

Voltage-gated currents
In addition to ligand-gated responses, voltage-gated currents have been identified in zebrafish bipolar cells (Connaughton & Maguire, Reference Connaughton and Maguire1998). Recorded in retinal slices, these cells were found to differentially express voltage-gated potassium and calcium currents (Table 1). In particular, one population of bipolar cell expresses the delayed rectifying outward I K current in response to membrane depolarizations and the slowly activating I h-type current in response to membrane hyperpolarizations. These currents are similar to those reported in isolated goldfish bipolar cells (Kaneko & Tachibana, Reference Kaneko and Tachibana1985), Mb-type cells in retinal slices (Fan & Yazulla, Reference Fan and Yazulla1999b), and small bipolar cells in white bass (Lasater, Reference Lasater1988). The other population of zebrafish bipolar cells expresses a rapidly activating and inactivating I A-type current when depolarized and a sustained inward current in response to membrane hyperpolarization (Connaughton & Maguire, Reference Connaughton and Maguire1998). I A has also been recorded in the terminals of goldfish ON-bipolar cells after blockage of the calcium-dependent potassium current (Burrone & Lagnado, Reference Burrone and Lagnado1997) and in large bipolar cells in white bass (Lasater, Reference Lasater1988). These currents were carried by potassium ions, as indicated by their sensitivity to cesium substitution for potassium in the patch pipette and/or sensitivity to external application of the potassium channel blocker tetraethyl ammonium (TEA). When potassium channels were blocked, a depolarization-elicited inward calcium current was identified in all zebrafish bipolar cells. This inward current had characteristics of transient (T-type) and/or sustained (L-type) calcium currents, with response properties again varying among recorded cells. A calcium-dependent potassium current (I K(Ca)) (Connaughton & Maguire, Reference Connaughton and Maguire1998) was also recorded in response to depolarizing voltage steps. Goldfish ON-bipolar cells also express I K(Ca) and L-type calcium channels (Burrone & Lagnado, Reference Burrone and Lagnado1997). In contrast, a transient calcium current has been identified in mouse (Kaneko et al., Reference Kaneko, Pinto and Tachibana1989), and both types of voltage-gated calcium currents were observed on rat rod bipolar cells (Pan, Reference Pan2001).
Examination of recorded cells filled with Lucifer Yellow (1% solution, present in the patch pipette) indicated that some presumed ON-cells express I K and others express I A. A similar result was also found in cells with the morphology of OFF-type bipolar cells. In other words, the above two populations of bipolar cells (separated by expression of either I K or I A; Fig. 3) did not correspond to ON- and OFF-cell types in zebrafish. Kv1.1-IR (= I K) is observed only on some ON-type bipolar cells in zebrafish (Yazulla & Studholme, Reference Yazulla and Studholme2001) consistent with physiological responses identifying I K on a subset of ON cells. Kv1.4-IR (= I A) is observed in the zebrafish OPL (Yazulla & Studholme, Reference Yazulla and Studholme2001). OFF- and some ON-type bipolars in zebrafish were also positively labeled with the PanNa sodium channel antibody (Yazulla & Studholme, Reference Yazulla and Studholme2001), though physiological recordings did not identify voltage-gated sodium currents on these cells (Connaughton & Maguire, Reference Connaughton and Maguire1998). In goldfish, PKC(+) bipolar cells display Kv1.1-IR (Yazulla & Studholme, Reference Yazulla and Studholme1998, Reference Yazulla and Studholme2001) and Kv1.4-IR colocalizes with GluR4-IR on OFF-bipolar dendrites (Yazulla & Studholme, Reference Yazulla and Studholme1998, Reference Yazulla and Studholme2001). Physiologically, voltage-gated sodium currents (I Na) are not present on goldfish Mb cells (Fan & Yazulla, Reference Fan and Yazulla1999a); however, I Na has been recorded from ON-bipolar cells with small terminals (i.e., cone bipolar cells; Zenisek et al., Reference Zenisek, Henry, Studholme, Yazulla and Matthews2001), and PanNaCh-IR identified voltage-gated sodium channels on most OFF- and half of the ON-type bipolar cells in goldfish (Zenisek et al., Reference Zenisek, Henry, Studholme, Yazulla and Matthews2001). Calcium action potentials have also been recorded from the larger axon terminals in goldfish (Protti et al., Reference Protti, Flores and Von Gersdorff2000).
Genetic approaches allow the application of developmental and physiological data
A major strength of the zebrafish model is the ease with which mutant and transgenic animals can be generated (reviewed in Amsterdam & Becker, Reference Amsterdam and Becker2005) and the applicability of these animals to analysis of retinal development, function, or disease. Mutants are identified in large-scale behavioral screens (i.e., Brockerhoff et al., Reference Brockerhoff, Hurley, Janssen-Bienhold, Neuhauss, Driever and Dowling1995; Neuhauss et al., Reference Neuhauss, Biehlmaier, Seeliger, Das, Kohler, Harris and Baier1999), while regions of interest in transgenic animals are detected by viewing fluorescently (green fluorescent protein and yellow fluorescent protein) labeled cells or structures (i.e., Schroeter et al., Reference Schroeter, Wong and Gregg2006; Zhao et al., Reference Zhao, Ellingsen and Fjose2009). These techniques have been applied to zebrafish retina, and some of the studies that impact retinal bipolar cells are highlighted below.
Mutant strains
Chemical mutagenesis, using ethyl nitrosourea (ENU) exposure, followed by third-generation screens (Mullins et al., Reference Mullins, Hammerschmidt, Haffter and Nusslein-Volhard1994; Solnica-Krezel et al., Reference Solnica-Krezel, Schier and Driever1994; Brockerhoff et al., Reference Brockerhoff, Hurley, Janssen-Bienhold, Neuhauss, Driever and Dowling1995, Reference Brockerhoff, Hurley, Niemi and Dowling1997; Fadool et al., Reference Fadool, Brockerhoff, Hyatt and Dowling1997) has identified zebrafish mutants with visual defects localized to the retina. Initial screening typically involves a behavioral assay, such as optokinetic response (OKR; Brockerhoff et al., Reference Brockerhoff, Hurley, Janssen-Bienhold, Neuhauss, Driever and Dowling1995) or optomotor response (Neuhauss et al., Reference Neuhauss, Biehlmaier, Seeliger, Das, Kohler, Harris and Baier1999). Subsequent physiological (ERG), histological, and/or molecular analyses are employed to identify the specific mechanism(s) underlying the mutation. To date, there are no published reports describing a mutation that specifically targets zebrafish retinal bipolar cells. However, mutations to presynaptic photoreceptors and postsynaptic ganglion cells have been described, and these mutations have been shown to affect bipolar cell morphology and/or physiology.
For example, zebrafish lakritz (lak) mutants lack ganglion cells (Kay et al., Reference Kay, Finger-Baier, Roeser, Staub and Baier2001). At 7dpf, larval mutants displayed a ∼2× increase in the number of PKC(+) ON-bipolar cells compared to wild-type animals and disrupted bipolar cell axon terminal ramification patterns in the IPL (Kay et al., Reference Kay, Finger-Baier, Roeser, Staub and Baier2001). The IPL, in general, is disorganized and formation is delayed (Kay et al., Reference Kay, Roeser, Mumm, Godinho, Mrejeru, Wong and Baier2004). Interestingly, disrupted stratification of bipolar terminals was specific to ON cells, as patterns in the distal (OFF) IPL appeared normal, and was dependent on amacrine cell processes, as stratification of bipolar terminals was similar in wild-type and lak mutants in regions, where amacrine cell processes were not disrupted. Thus, amacrine cell processes are required for accurate ramification of ON-bipolar terminals (Kay et al., Reference Kay, Roeser, Mumm, Godinho, Mrejeru, Wong and Baier2004). Disrupted retinal lamination patterns in young mutants, in contrast, decreases bipolar cell differentiation, as indicated by reduced vsx2 expression and PKC-IR patterns (Link et al., Reference Link, Fadool, Malicki and Dowling2000). Though degeneration of all cone types characterizes the phenotype of pde6c mutants, bipolar cell morphology is also unusual, with altered somal position in the INL and atypical process morphology in both plexiform layers (Stearns et al., Reference Stearns, Evangelista, Fadool and Brockerhoff2007).
Mutants initially characterized by an abnormal OKR include noa (no optokinetic response a; Brockerhoff et al., Reference Brockerhoff, Hurley, Janssen-Bienhold, Neuhauss, Driever and Dowling1995), pob (partial optokinetic response b; Brockerhoff et al., Reference Brockerhoff, Hurley, Niemi and Dowling1997), and nrc (no optokinetic response c; Allwardt et al., Reference Allwardt, Lall, Brockerhoff and Dowling2001). These mutants also display abnormal ERG responses characterized by altered b-waves (Brockerhoff et al., Reference Brockerhoff, Hurley, Janssen-Bienhold, Neuhauss, Driever and Dowling1995; Allwardt et al., Reference Allwardt, Lall, Brockerhoff and Dowling2001) and d-waves (Allwardt et al., Reference Allwardt, Lall, Brockerhoff and Dowling2001), suggesting that ON- and/or OFF-bipolar cell activity may be altered. Interestingly, most of these mutations are localized to photoreceptors, suggesting that the abnormal ERG b- and d-waves are due to a change in synaptic transmission between photoreceptors and bipolar cells. In nrc, for example, photoreceptor terminals are altered structurally: invaginating processes are reduced, ribbons are misplaced and untethered, and the number of basal contacts is increased compared to wild-type animals (Allwardt et al., Reference Allwardt, Lall, Brockerhoff and Dowling2001). Molecular studies have identified nrc as a mutation in the synj1 (synaptojanin 1) gene; Synj1 protein was not detected in nrc mutants, and knockdown of synj1 mimicked the altered photoreceptor terminal morphology observed in nrc (Van Epps et al., Reference Van Epps, Hayashi, Lucast, Stearns, Hurley, De Camilli and Brockerhoff2004). In addition to the abnormal ON-bipolar b-wave, ON responses in ganglion cells are also altered in nrc mutants, indicating that the entire ON pathway is affected (Emran et al., Reference Emran, Rihel, Adolph, Wong, Kraves and Dowling2007). Noa mutants have a mutation in the dlat (dihydrolipoamide s-acetlytransferase) gene, the protein product of which forms a subunit in the enzyme pyruvate dehydrogenase (PDH; Taylor et al., Reference Taylor, Hurley, Van Epps and Brockerhoff2004). The PDH enzyme complex converts pyruvate, formed during glycolysis, to acetyl-CoA, which then enters the Krebs cycle during the aerobic production of ATP (Campbell et al., Reference Campbell, Reece, Urry, Cain, Wasserman, Minorsky and Jackson2008). Thus, in addition to abnormal retinal ERG responses, this mutant also displays characteristics of a pyruvate dehydrogenase deficiency, as mutants could be rescued with a ketogenic diet, resulting in ERG and OKR responses comparable to wild-type animals (Taylor et al., Reference Taylor, Hurley, Van Epps and Brockerhoff2004). The partial optokinetic response observed in pob mutants is due to the selective degeneration of red cones (Brockerhoff et al., Reference Brockerhoff, Hurley, Niemi and Dowling1997). Interestingly, pob protein is localized to inner segments and synapses of all photoreceptors, not just red cones (Taylor et al., Reference Taylor, Kikkawa, Diez-Juan, Ramamurthy, Kawakami, Carmeliet and Brockerhoff2005).
Altered ERG b-waves have also been observed in other mutants, including bug eye (Stujenske et al., Reference Stujenske, Emran and Dowling2010), noir and dropje (Neuhauss et al., Reference Neuhauss, Biehlmaier, Seeliger, Das, Kohler, Harris and Baier1999), and zvm7 larvae (Brockerhoff et al., Reference Brockerhoff, Wilson, Stearns and Lewis2010). However, these have not been characterized as extensively as those described above.
Transgenic lines
Transgenic zebrafish lines are developed by injecting DNA (plasmid or transposon containing GFP or other fluorescent marker) into one-cell stage embryos. Embryos are screened, raised to adulthood, and mated. Some of these adults will become founders consistently producing fluorescent transgenic embryos once the DNA is incorporated into the germ line (reviewed in Amsterdam & Becker, Reference Amsterdam and Becker2005; Kawakami, Reference Kawakami2005; Higashijima, Reference Higashijima2008). Though a wealth of transgenic lines have been developed in zebrafish, six have been used to examine retinal bipolar cells.
As described above, development and maturation of bipolar cells have been examined in the nyx::MYFP transgenic line (Schroeter et al., Reference Schroeter, Wong and Gregg2006) and in double transgenic vsx2:dsRed; vsx1:GFP embryos (Vitorino et al., Reference Vitorino, Jusuf, Maurus, Kimura, Higashijima and Harris2009). Transgenic XOPS-mCFP zebrafish displays degeneration of rod photoreceptors (Morris et al., Reference Morris, Schroeter, Bilotta, Wong and Fadool2005). Double transgenic fish formed by mating fish from this line with nyx::MYFP fish or labeling XOPS-mCFP retinas with an antibody to PKCα allowed changes in ON-bipolar cell morphology to be observed following loss of rod photoreceptors (Saade & Fadool, Reference Saade and Fadool2010).
Specific bipolar cell types are labeled in xfz3 and xfz43 transgenic lines (Zhao et al., Reference Zhao, Ellingsen and Fjose2009), as already noted. However, these two lines have also been used to examine selective ablation and regeneration of bipolar cells. To do this, adults from both transgenic lines were mated to UAS:nsfB-mCherry transgenic fish (Zhao et al., Reference Zhao, Ellingsen and Fjose2009). The NTR-mCherry line expresses nitroreductase, a compound that becomes toxic to cells following application and conversion of metronidazole (Curado et al., Reference Curado, Stainier and Anderson2008). Thus, bipolar cells coexpressing eGFP and mCherry could be selectively ablated by applying metronidazole to the retina. This was, in fact, observed in bipolar cells within the xfz43 line. Furthermore, new eGFP-positive bipolar cells were formed within 7 days of metronidazole removal (Zhao et al., Reference Zhao, Ellingsen and Fjose2009). These findings indicate that zebrafish bipolar cells are capable of regeneration in larval retinas and that transgenic lines can be applied to studies of targeted cell loss.
Summary and future perspectives
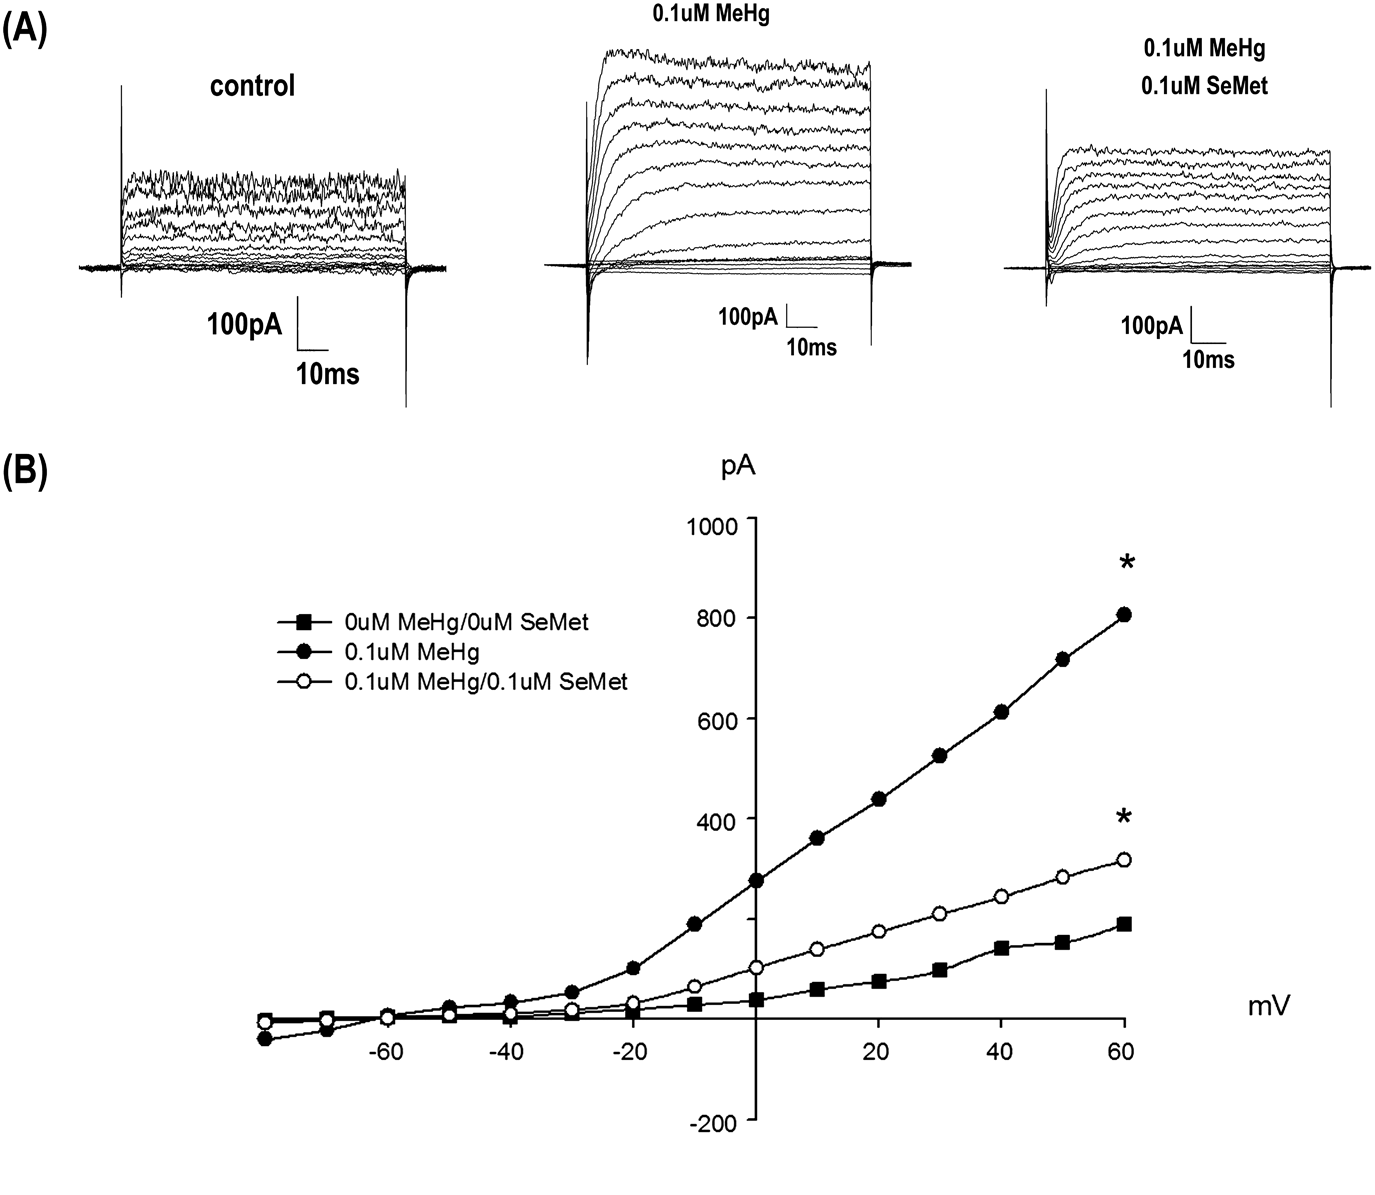
Use of the zebrafish model in vision research increases each year. Existing data on zebrafish bipolar cells include physiology, morphology, ultrastructure, immunocytochemistry, and gene expression. Transgenic lines provide a powerful tool to examine bipolar cell development, regeneration, and response to presynaptic cell loss. Mutant strains identify the important roles that bipolar cells play in retinal processing, as their function and/or morphology can be altered by mutations localized to other cell types. Furthermore, toxicological studies (Fig. 8) report changes in bipolar cell physiology following developmental exposure to various compounds, such as methylmercury (Weber et al., Reference Weber, Connaughton, Dellinger, Klemer, Udvadia and Carvan2008), and new imaging techniques, such as SyGCaMP2, a reporter molecule formed by tethering a genetically encoded calcium indicator to synaptophysin, are being used to study synaptic activity of bipolar axon terminals (Dreosti et al., Reference Dreosti, Odermatt, Dorostkar and Lagnado2009; Dorostkar et al., Reference Dorostkar, Dreosti, Odermatt and Lagnado2010). Combining existing data with the diversity of techniques available will further our knowledge of bipolar cell function, in general, but also position zebrafish bipolar cells to be a system in which to examine how this retinal cell type functions under and responds to a variety of conditions. Furthermore, many characteristics of zebrafish bipolar cells are similar to higher vertebrates, indicating that findings in zebrafish related to mutations, pharmacology, and disease have far reaching impacts.
Outward rectifying I K currents in adult bipolar cells are enhanced following developmental exposure to methylmercury. (A) Representative whole-cell current traces showing the increase in the amplitude of the delayed rectifying I K current recorded from bipolar cells in adult zebrafish that had been developmentally exposed to 0.1 μM methylmercury (MeHg) (middle traces). Coexposure to selenomethionine (SeMet) and methylmercury (MeHg) suppressed the increase in I K amplitude (right traces). (B) Mean current–voltage relationship; asterisks indicate significant differences from control (Reprinted from Physiology and Behavior, Vol. 93, Weber, D.N., Connaughton, V.P., Dellinger, J.A., Klemer, D., Udvadia, A., Carvan, M.A. III. Selenomethionine reduces visual deficits due to developmental methylmercury exposures, 250–260, with permission from Elsevier).

Acknowledgments
This work was supported, in part, by the Mellon Research Fund and an American University Senate Research Award. Thanks to R. Nelson, R. Tarboush, and M. Connaughton for helpful comments on the manuscript.