Introduction
In 1954, Dallas oilman Clint Murchison made the cover of Time magazine. Under a banner reading “THOSE TEXAS MILLIONAIRES” sat his broad white face, topped with a cowboy hat, encircled by a wheel of golden dollar signs.Footnote 1 Three years later, his name landed on a Fortune list of the richest people in the US, marked as a new money oilman.Footnote 2 With his cowboy persona and folksy sayings,Footnote 3 Clint embodied the archetype of the new money Texan oil millionaire. But even though Clint wore a cowboy hat, and even though he was new to the list of the richest men in the country, he was not, by any means, new to wealth. Clint was the son and grandson of bank presidents. He grew up in a block-long Victorian mansion in Athens, Texas, flanked by three small homes of Black live-in domestic workers. A frequent visitor to his childhood home was Nathan Adams, the Dallas banker who practically invented Texas oil loans, and eventually gave Clint so many he had to continue doing so until Clint struck oil (Adams Reference Adams1942; Wolfe Reference Wolfe1989). Clint didn’t move to Dallas until 1928, but he had cousins, aunts, and uncles in the Dallas upper class stretching back to its earliest days. He was even connected to John Neely Bryan, the first white man to settle in Dallas: two of his grandfather’s cousins married two of John’s wife’s nieces.Footnote 4
Still, Clint’s behavior played into the international stereotype and into the story told in every major account of Dallas high society during the oil boom: brash new money oil families arrived in Dallas in droves, and the resentful old money cotton families resisted their inclusion, but ultimately fell from monied grace (e.g., Bainbridge Reference Bainbridge1961; Marcus Reference Marcus1974). The case mirrors centuries of widely reported new-versus-old money conflicts in Europe and the US, including New York City in the Gilded Age (Beckert Reference Beckert2001), Great Britain after World War I (Cannadine Reference Cannadine1999), Florence during the Renaissance (Padgett and Ansell Reference Padgett and Ansell1993), the medieval French aristocracy (Bouchard Reference Bouchard2001), and even ancient Greece (Burris Reference Burris2000: 373; Gill Reference Gill and Schervish1994). C. Wright Mills (Reference Mills2000 [1956]: 50) summarized the entire history of the US upper class with the claim that “this game of the old rich and the parvenu began with the beginning of national history and continues today in the small town as in the metropolitan center.”
The Dallas case is an extreme example in that today, nearly a century after the kingmaking East Texas Oil Boom, the archetypal Texas oil millionaire is still synonymous with “new money.” But as I will demonstrate, the upper class generally persisted through the purported turnover, and the tidal wave of vulgar “new money” oil people was, statistically speaking, nowhere to be found. In the Texas case, and likely in others, the new-versus-old money narrative describes industry-level economic change, and turnover among the richest tycoons, but does not describe broader turnover in the upper class.
Scholars have been measuring and theorizing about elite turnover for at least a century (e.g., Pareto Reference Pareto1935; Schumpeter Reference Schumpeter1919). Such studies generally assume that elite persistence is a sign of aristocracy or oligarchy, and elite circulation is a sign of democracy or meritocracy. Baltzell (Reference Baltzell1964: 7) even framed elite circulation as a precondition for democracy itself: “The democratic process,” Baltzell argued, “means … that the elite is open” to upwardly mobile newcomers (emphasis in original). In capitalist settings, accounts of elite circulation often equate new elites with new industries, and old elites with old industries (e.g., Mills Reference Mills2000 [1956]; Schumpeter Reference Schumpeter1919). For Mills ([1956] Reference Mills2000: 12), the “historic thrust of commerce and industry” in the United States meant that as dominant industries changed, so did the power elite, with the result that family continuity was much less characteristic of the American upper class than it was for the “the noble cousins that once ruled various European nations.”
This normative valence in elite persistence and mobility scholarship – in which elite circulation is good and meritocratic, and elite persistence is bad and aristocratic – stands in marked contrast to widespread stereotypes of new and old money within upper-class worlds, wherein old money is virtuous, civic-minded, and tasteful, and new money is immoral, vulgar, and according to one socialite, “socially speaking, far worse than being suspected of murder” (Amory Reference Amory1960: 33). Elite narratives of change differ, too; whereas elite persistence studies generally find that some significant portion of an elite population persists, even through colonization and revolutions, elites themselves tend to describe wholesale turnover from old-to-new money (O’Brien Reference O’Brien, Méndez, Savage and Lareau2026b). I focus on that contrast here, asking why narratives of total elite turnover diverge so much from the measurable reality of elite persistence. Dallas during the 1930s oil boom is a good case with which to think about the relationship between elite perceptions and measurable mobility because it offers (a) a new source of wealth, (b) an entrenched upper class, and (c) a widely reported “new money” vs. “old money” clash. A unique dataset featuring the full kinship network of the Dallas upper class makes this case study methodologically possible. In this article, I use the terms “upper class” and “high society” to refer to the set of families who collectively monopolized wealth, status, and power; I use the terms “cotton men” and “oilmen” to refer to men who publicly made their money in those industries, rather than anyone invested in either or both industries; and I use the term “elites” to refer to individuals who held “vastly disproportionate” wealth, status, and/or power (Khan Reference Khan2012: 361). I describe how I operationalize these categories and subcategories in the “Concepts, Data, and Methods” section.
After an overview of studies of elite persistence and rich lists, as well as my data and methods, I give a brief description of the historical case. I show that during the oil boom, oil did overtake cotton in the Texan economy, and oilmen did become more prevalent in the Dallas upper class than cotton men. Then, drawing on the full kinship network of the Dallas upper class, I show that new oil families did not replace old cotton families during the oil boom: cotton families persisted in the upper class at especially high rates. I further demonstrate that the class backgrounds of upper-class oil and cotton men were nearly identical, in that most were born rich, and few were born poor. I address and reject the possibility that the much-discussed new money oilmen were simply crowded into the economic elite and were not integrated into the upper class, by demonstrating that oilmen were included in the upper class at especially high rates relative to other wealthy working men. Most upper-class people were related through some combination of blood and marriage to both oilmen and cotton men, and they were increasingly closely related to oilmen over the course of the oil boom. This finding of elite persistence is novel for oil boom Dallas, but not for social and economic history more generally.
After establishing that there is a large gap between upper-class tales of turnover and measurable mobility into and out of their world, I then propose an explanation that integrates both perspectives. I show empirically that while the relative percentages of homes owned by upper-class oil and cotton families stayed steady through the oil boom and Great Depression, the most expensive, prestigious homes did largely turn over from cotton to oil. In other words, the visibly richest people in Dallas were mostly cotton men in 1930 and mostly oilmen in 1940. I then introduce the concept of prototypical elites: “representations of ‘best examples’” of an elite population (Monk Reference Monk2022: 9). I argue that in capitalist societies, prototypical elites are generally the most obviously rich elites in a community, with fortunes tied to regionally specific industries. Their positions at the top of the wealth distribution are more volatile: when their fortunes are largely tied to a specific industry, then they are also tied to industry-level economic shifts. Focusing on prototypical elites generates perceptions of widespread turnover even when most upper-class families persist. I conclude that upper-class narratives of economic change may be better understood as descriptions of turnover among prototypical elites, or churn among the 1 percent of the 1 percent, rather than as descriptions of more broadly significant circulation into and out of an upper class. This argument has implications for the way we study great wealth over time, motivating a kinship network-based approach to the study of economic elites, rather than one based solely on ultra-rich individuals.
Seeing like a rich list
Measurable elite persistence, perceptions of elite turnover
Studies of elite persistence tend to find that some significant portion of elite populations produce elite descendants, even across extreme upheavals like colonization and revolution (Acemoglu and Robinson Reference Acemoglu and Robinson2008; Ager et al. Reference Ager, Boustan and Eriksson2021; Alesina et. al Reference Alesina, Seror, Yang, You and Zeng2021; Barone and Mocetti Reference Barone and Mocetti2021; Böröcz and Róna-Tas Reference Böröcz and Róna-Tas1995; Brenner Reference Brenner2006; Campbell Reference Campbell1982; Legentilhomme and Leimgruber Reference Legentilhomme and Leimgruber2026; Guirkinger et. al Reference Guirkinger, Aldashev, Aldashev and Fodor2022; Schimpfössl, Reference Schimpfössl2018; Tisch and Ischinsky Reference Tisch and Ischinsky2023; Wiener Reference Wiener1975, Reference Wiener1978). But across a remarkable swath of time and space, upper-class people have bemoaned the fall of old money and the rise of new money, even in cases where the empirical data points to significant elite entrenchment. Even though upper-class Bostonians perennially lamented their impoverishment at the hands of new money interlopers (Amory Reference Amory1947), Jaher (Reference Jaher1982: 73) estimates that 70 percent of ultra-wealthy Bostonians in 1835 had millionaire patrilineal descendants half a century later: an astonishing percentage, given that patrilineal measures generate substantial underestimates of persistence rates (O’Brien Reference O’Brien2024). In the US South, popular and scholarly narratives alike (e.g., Du Bois Reference Du Bois1935: 54; Woodward Reference Woodward1951) long characterized Emancipation as a complete turnover in wealth and power, in which ‘the planters died as a class’ and a ‘corresponding ... portion of the poor white’ ‘[rose] ... into the dominant portion of landholders and capitalists.’ One 1871 Alabaman, for example, lamented that “‘not one of the colossal planters survives” even though at least 43 percent of wealthy enslaver families in 1860 Alabama were still presiding over massive fortunes and plantations in the same counties in 1870 (Wiener Reference Wiener1978: 34). The pattern goes back even earlier. Padgett and Ansell (Reference Padgett and Ansell1993) show that although the Medician faction of the early-fifteenth century Florentine elite had long been understood as a “new” elite challenging the oligarchic patricians, the two factions were practically identical in the size and age of their fortunes. In high society worlds across continents and centuries, including every generation of the US upper class since Jamestown, upper-class socialites have mourned the fall of “old money” families and the rise of “new money” families (Amory Reference Amory1960: 19–32; Burris Reference Burris2000: 372), to the point that “you could take the description of elite turnover in one context and drop it in another, wholesale” (O’Brien Reference O’Brien, Méndez, Savage and Lareau2026b: 108).
Although these narratives invoke new and old money as crisp, self-evident groups, new and old money are fuzzy, contextually dependent folk categories. Indeed, upper-class people themselves regularly negotiate and move between old and new money boundaries (Aldrich Reference Aldrich1988). As the contemporary justification for elite status has shifted from aristocratic to meritocratic, elites have increasingly framed themselves publicly as new to wealth and privilege (Friedman et al. Reference Friedman, O’Brien and McDonald2021; Khan Reference Khan2011; Reeves and Friedman Reference Reeves and Friedman2024), just as Gilded Age tycoons once paid for bogus noble family trees (Remington Reference Remington1992). Old and new money distinctions reflect and affect real status hierarchies within the upper class, even when those distinctions may not line up with measurable differences of wealth or background, and even when those differences look negligible relative to the distribution of wealth or background across the whole population. Scholars who take elite posturing and infighting as straightforward reflections of family history risk seeing fantastic tales of upward mobility where the reality is a more modest intra-elite rise. For example, nineteenth-century historians of the Florentine Renaissance often mistakenly “[read] rags-to-riches into the insults thrown at wealth and power’s top 1 percent by wealth and power’s top 0.1 percent,” such that they depicted noble men as rising from impoverished obscurity even when they were born in ancestral castles (Palmer Reference Palmer2025: 254). Similarly, Time and Fortune magazines framed Clint Murchison as entirely new to wealth when he was merely new to the ranks of the richest in the world. Taking elite narratives at face value often means mistaking elite worlds for the whole world, and elite insults and pufferies as demographic truth.
Although new and old money categories may be fuzzy and contingent, they can have long-range consequences in the archetypes of wealth, transcending their historical contexts such that entire regions and industries are associated with new or old money long after the perceived clash. Beginning at least with Mills ([1956] Reference Mills2000), Texan wealth, and particularly Texan oil wealth, has been consistently invoked as an exemplar of the nouveau riche, both by scholars and by upper-class scions themselves. Oglesby (Reference Oglesby1976) and Sale (Reference Sale1975) argued that mid-twentieth-century US politics was characterized by the “Yankee-Cowboy War,” a struggle between liberal Northeastern old money and right-wing Southwestern new money, exemplified by Texan oilmen. Jaher (Reference Jaher1982: 730) concluded his centuries-long history of the US upper class by observing that “newly minted cattle and oil millionaires” in places like Texas had eclipsed the traditional upper class. New Yorker journalist John Bainbridge (Reference Bainbridge1961: 1) began his book on oil millionaires, The Super-Americans, with the declaration that “Texas is a new boy, standing in relation to the rest of the United States as the United States stands to Europe, or, for that matter, as Rome stood to Athens.” In his vision, the entire state was synonymous with new oil money. Not every Boston banker is born into the upper class, and not every major British landowner is an aristocrat. But those industry-region combinations continue to be associated with old money, just as Texan oil millionaires, and Texas itself, are associated with the new.
Seeing like a rich list
“Rich lists” like the Forbes 400 are some of our best empirical sources on the very wealthy, especially in Europe and North America since the nineteenth century (Alfani Reference Alfani2023: 6). They are typically compiled by teams of journalists who aim to identify the richest individuals in a place and time. Economic historians, sociologists, and other scholars have used them for over a century (Alfani Reference Alfani2023; Bühlmann et al. Reference Bühlmann, Christesen, Cousin, Denord, Ellersgaard, Lagneau-Ymonet, Larsen, Savage, Thine, Young, Araujo, Arrigoni, Atria, Benz, Behr, do Carmo Botelho, Butt, Casanova, Luís Clemente-Casinhas, Cescon, Dagnes, Debska, Delval, Dragun, Egas, Emilsson, Fan, Fu, Gentile, Gomes, Gronwald, Heredia, Hjellbrekke, Honório, Huang, Inkley, Johansson, Koiranen, Koivula, Kuusela, Levita, Ling, Lu, Lukas, Lunding, Mahmoudzadeh, McQuade, Méndez, Nunes, O’Brien, Otero, Pagnini, Pelfini, Pereira, Roa, Rossier, Saga, Santana, Schneickert, Schimpfössl, Schoenberger, Solipa, Trembaczowski, Toft, Vale, Vasconcelos, Velazco, Warczok and Yu2025; Burris Reference Burris2000; Fernholz and Hagler Reference Fernholz and Hagler2023; Ischinsky Reference Ischinsky2026; Ischinsky and Tisch Reference Ischinsky and Tisch2023; Korom et al. Reference Korom, Lutter and Beckert2017; Krcmaric et al. Reference Krcmaric, Nelson and Roberts2023; Lillie et al. Reference Lillie, de Alwis and Tisch2025; Lillie and Tisch Reference Lillie and Tisch2026; MillsReference Mills2000 [1956]; Myers Reference Myers1908; Ratner Reference Ratner1953; Rockoff Reference Rockoff2012; Schimpfössl and Monteath Reference Schimpfössl, Monteath, Burgum and Higgins2022; Sorokin Reference Sorokin1924; Tisch and Ischinsky Reference Tisch and Ischinsky2023). Typically, such studies ask questions about the composition and change over time among the ultra-rich in terms of their demographics and “the origin and nature of their wealth:” whether it was inherited or self-made, and what industries it sprang from (Alfani Reference Alfani2023: 35). For quantitative research on great wealth, rich lists have become practically indispensable.
But rich lists have their limitations. They struggle to estimate the size of entrenched, diversified fortunes, which are more difficult to count because they are typically spread across sprawling tangles of kin and legal entities (Shiffer-Sebba Reference Shiffer-Sebba2025). Their “self-made” versus “inherited” categorizations tend to focus on whether fortunes were amassed over the person’s lifetime, rather than the class backgrounds they were born into, such that upper-class people who started billion-dollar businesses with investments and connections from their families – like Bill Gates – are typically categorized as self-made (O’Brien Reference O’Brien, Méndez, Savage and Lareau2026b). Rich lists further tend to over-attribute “inherited” status to women and “self-made” status to men (Lillie and Tisch Reference Lillie and Tisch2026). As Beckert (Reference Beckert2022: 232) observed, they tend to overemphasize downward mobility, because falling off a rich list does not necessarily reflect “a serious decline in wealth and social status.” Similarly, they can overemphasize upward mobility, because being new to a rich list does not necessarily mean being new to wealth (Schimpfössl and Monteath Reference Schimpfössl, Monteath, Burgum and Higgins2022). Like all forms of data, rich lists must be read with a critical eye.
One of the most ambitious recent studies of great wealth is Alfani (Reference Alfani2023), who used rich lists and a huge volume of other historical sources to write a sweeping history of ultra-rich individuals in the West. He observed that in the past few centuries, “cycles of social-economic opening and closure” have shaped the degree to which “brilliant individuals” can “[climb] to the top of the wealth pyramid thanks to their exceptional skills” (ibid.: 115, 88). Entrepreneurial “founders” launch new money dynasties, and “when new wealth becomes old it is inclined to assume a defensive stance against … the nouveau riche” (ibid.: 113). This frame – in which new money elite dynasties are begun by hero-founder men and then, through endogamy and inheritance, become old money “aristocracies of wealth” – relies on the convenient fictions that the line between inheritance and “heroic attainment” is clear, and that families are patrilineages structurally unaffected by endogamy, such that the son of a hero-founder man and an aristocratic heiress is “the second generation.” As with rich lists more generally, these simplifications support the “new money myth:” the idea that in times of socioeconomic change, old money falls and new money rises.
In this article, I use the case of the East Texas Oil Boom in Dallas to ask: why do elite narratives of upper-class turnover consistently diverge from measurable persistence rates among the upper class? I argue that this divergence is a matter of perspective. Upper classes as a whole tend to persist. New entrants typically come from just beyond its borders, the downwardly mobile rarely fall far, and upper-class people of all backgrounds continually intermarry (O’Brien Reference O’Brien, Méndez, Savage and Lareau2026b). As I will demonstrate, this was certainly the case with oil and cotton families in Dallas. But elite narratives of turnover are not describing change at the population level: they are “seeing like a rich list” by describing change among prototypical elites. Prototypes are not the average members of a category, but are rather “abstract summary representations of ‘best examples’ of a concept” (Monk Reference Monk2022: 9). The prototypical member of a local upper-class world is a king or a duke, not a minor noble; a billionaire tycoon, not a low-level millionaire lawyer. Prototypical elites are especially wealthy and powerful, belong to dominant social categories, and in capitalist societies are usually connected to a regionally specific industry. Thus, Mark Zuckerberg is a more prototypical Silicon Valley elite than a millionaire Palo Alto car dealer, because he is much richer and he works in tech. Michael Bloomberg is a more prototypical New York City elite than a millionaire plastic surgeon, because he is much richer, he worked on Wall Street, and at one point, he even served as mayor. Quantitative studies that rely solely on lists of individual elites mechanically share this emphasis on prototypes, because they analyze individuals of extreme wealth and power divorced from their kin and social networks. Economic booms and busts generate churn at the level of tycoons, even as elite populations more generally tend to persist. Elites, and popular narratives of elite change, focus more on the prototype than on the population, and thus tend to see enormous change where moderately more expansive measures of the upper class see persistence.
Concepts, data, and methods
“Oil people” and “cotton people,” like “old” and “new” money, imply simple measurements. In the classic stereotype, old money dynasties emerged from an old, dying industry, while new money dynasties emerge from a new and vibrant one. But reality is more complicated. Families are not bounded patrilineages – they are complex kin networks, not easily defined by surname, household, or patrilineage (O’Brien Reference O’Brien2024). Fortunes are not discrete, fungible piles of cash, sprung from single industries – they typically spring from multiple industries and people, and to entrench their fortunes, economic elites must spread and split them across kin, legal entities, and investments (Shiffer-Sebba Reference Shiffer-Sebba2025). Industries are complicated, too: does a cotton gin manufacturer work in the cotton industry or in manufacturing? Does an oil lawyer work in oil or in law? How about a banker who specializes in cotton and oil and insurance? How about a housewife with a safe full of diamonds, twelve oilfields, two cotton plantations, a mansion, a working cattle ranch, and a generous slice of stocks and bonds?
This study does not fully capture the complexity of family, industry, and fortune in high society Dallas. Rather, it focuses on the people perceived as drawing wealth from oil or cotton – that is, oilmen, cotton men, and their wives – and then investigates their family backgrounds and places in the Dallas elite kinship network. It also focuses on perceived wealth, rather than total wealth, by leveraging the reported home values of the Dallas upper class in the 1930 and 1940 Census. While socialites could not typically see each other’s bank accounts or stock portfolios, they could see their houses, and those houses were socially meaningful.
My analysis draws on a hand-constructed relational database encompassing the Dallas upper class and elite in its first 122 years (1841–1963; n = 20,524). I assembled the data by drawing from a variety of archival sources, mostly those compiled in AncestryLibrary.com (especially the manuscript Census and birth, death, and marriage records), the Portal to Texas History, and articles from Dallas Morning News and Newspapers.com. I included anyone who could be considered upper class or economically, politically, or socially elite in Dallas by any standard measure. For all individuals in the database, I compiled demographic information, organizational memberships, mutual kin ties, and multiple measures of wealth, status, and power, among many other data points. The process is a more structured and larger-scale version of family genealogical research.
The most salient feature of the database is family entanglement. Dallas elites and upper-class people of all kinds were thoroughly intermarried, with at least three-quarters (78.1 percent) of the population cumulatively connected through close family ties in a single, massive “family web.” The population was about six percent Jewish, 94 percent Christian, and 99.3 percent white (O’Brien Reference O’Brien2026a). In this analysis, I focus primarily on two overlapping subpopulations: upper-class Dallas adults from 1925 to 1945 (n = 3,864) and most wealthy Dallas oilmen during the East Texas Oil Boom (n = 325). For descriptive statistics of all categories and subcategories described in this article, please see the Supplementary Material.
The subpopulation of Dallas upper-class adults from 1925–1945 consists of every adult listed in the Dallas social registers published during those years. Each edition of those social registers listed about half a percent of the city population. Social registers are directories of upper-class families in US cities, and are a standard measure of upper-class status for the US during this time period (Accominotti et al. Reference Accominotti, Khan and Storer2018; Baltzell Reference Baltzell, Bendix and Lipset1963). The registers were compiled by a socially prominent editor, who sent a list of eligible families to an anonymous board representing the five most exclusive elite social clubs. Board members independently checked the list, omitted anyone they deemed insufficiently elite, and suggested names for consideration, which the editor added only with unanimous approval from the rest of the board (Baird Reference Baird1932). Although not every reasonably upper-class person was listed, most were, and everyone listed can be reasonably considered upper class.
About half (51.2 percent) of the adults listed in the 1925–1942 registers were born into the Dallas upper class, in the sense that one or more of their parents, grandparents, aunts, or uncles were listed in the registers before they were; the first Dallas register was published in 1895. The rest were newcomers, which is not the same as being new to the upper class, since many newcomers grew up in the upper class of other towns and cities. I used manuscript Census records, newspaper records, and other archival sources to gather basic information on the family backgrounds of oilmen, cotton men, and their wives. I then grouped each newcomer into a class background group. Newcomers had “upper-class origins” when their families of origin had at least two of the following characteristics: live-in domestic workers, an expensive home owned outright, a debutante in the immediate family, regular mentions in their local newspaper’s Society pages, a sizable inheritance (>$100k in 2022 dollars), and/or a father with a high-status job, such as a corporation executive, politician, or federal judge.Footnote 5 I categorized newcomers as having “middle-class origins” if their parents owned their home, their father had a white-collar job, and their mother did not work for pay. I counted newcomers as having “working-class origins” if they grew up in rented homes, their mothers worked for pay, their fathers had working-class jobs, and/or if their Census records generally showed signs of financial precarity. I found enough information on the backgrounds of all oilmen, cotton men, and their wives to categorize them all. If the case was borderline, I rounded down.
Because not all wealthy oilmen were listed in the social registers, I also collected information on every member of the Dallas Petroleum Club (DPC) (n = 325). “Should you wish to see a considerable portion of the wealth of a single industry gathered together,” Rogers (Reference Rogers1951: 275) observed, the Dallas Petroleum Club was “the place” to go. If an oilman was wealthy, Christian, and white, he could easily join the DPC, which was founded in 1934 as “just a place for a guy to get a good lunch and a million-dollar [oil] deal” (Wolfe Reference Wolfe1989: 108; Flournoy Reference Flournoy2015). The DPC membership list approximates the population of oilmen who were wealthy in Dallas, but not always high-status enough to be listed in the registers.
With help from a research assistant, I collected complete industry data for every upper-class adult man in the oil boom years. Most men tended to work in a single industry as adults, and to be identified publicly by that industry. This was particularly true of men working in cotton and oil, who were often described in their obituary headlines as “Oilman” or “Cotton Man.” In cases where the industry affiliation was less clear, we coded industries based on the 1930 and 1940 Census records, prioritizing the year(s) a man was listed in the 1925–45 registers. These public identities as oil and cotton men did not encompass all those people who profited from either industry; elites, particularly the most entrenched ones, often maintained sprawling investments that spanned oil, cotton, insurance, banking, railroads, and more. A phalanx of bankers, lawyers, and manufacturers attended to both industries, often at the same time. But as this study attempts to describe those people popularly identified with cotton and oil, rather than everyone who dipped a financial toe in either industry, I define oilmen and cotton men by public occupation alone. Oil and cotton wives comprise any woman who was married to an oilman or cotton man and listed in the social registers between 1925 and 1942.
The Dallas dataset is the first-ever full kinship network of an upper-class and elite population in a US city. In combination with the DPC membership lists and family background research for oil and cotton newcomers, it offers an unprecedented opportunity to systematically evaluate the family connections, industries, and backgrounds of an upper class during a widely reported clash between new and old money.
The case: cotton and oil in the East Texas oil boom
On October 3, 1930, Columbus Marion “Dad” Joiner struck oil in an elderly widow’s backyard. It soon became clear that her land sat on the edge of an oil field that was unprecedentedly vast. To this day, it remains the largest oil field ever discovered in the contiguous United States (McFarlane Reference McFarlane2017). Within nine months, it accounted for over half the total US production.
Private oil fortunes grew spectacularly large. Although Texas still had a reputation as a cowboy backwater, by the 1950s, Texan oilmen topped lists of the richest people in the country (Smith Reference Smith1957). Oil fortunes grew so large in part because the oil boom coincided with the Great Depression. The major Northeastern oil companies were relatively cash-strapped, so independent oilmen could snatch up leases with little competition from better-resourced corporations. Labor and materials costs were especially low, making it easier for wealthy drillers to hoard the profits: some drillers literally paid their workers in beans. Low labor costs also meant that wealthier oilmen could easily hire spies, scouts, and geologists, giving them a sizable information advantage over less wealthy drillers (Hill et al. Reference Hill, Boyar and Boyar1994; Presley Reference Presley1978).
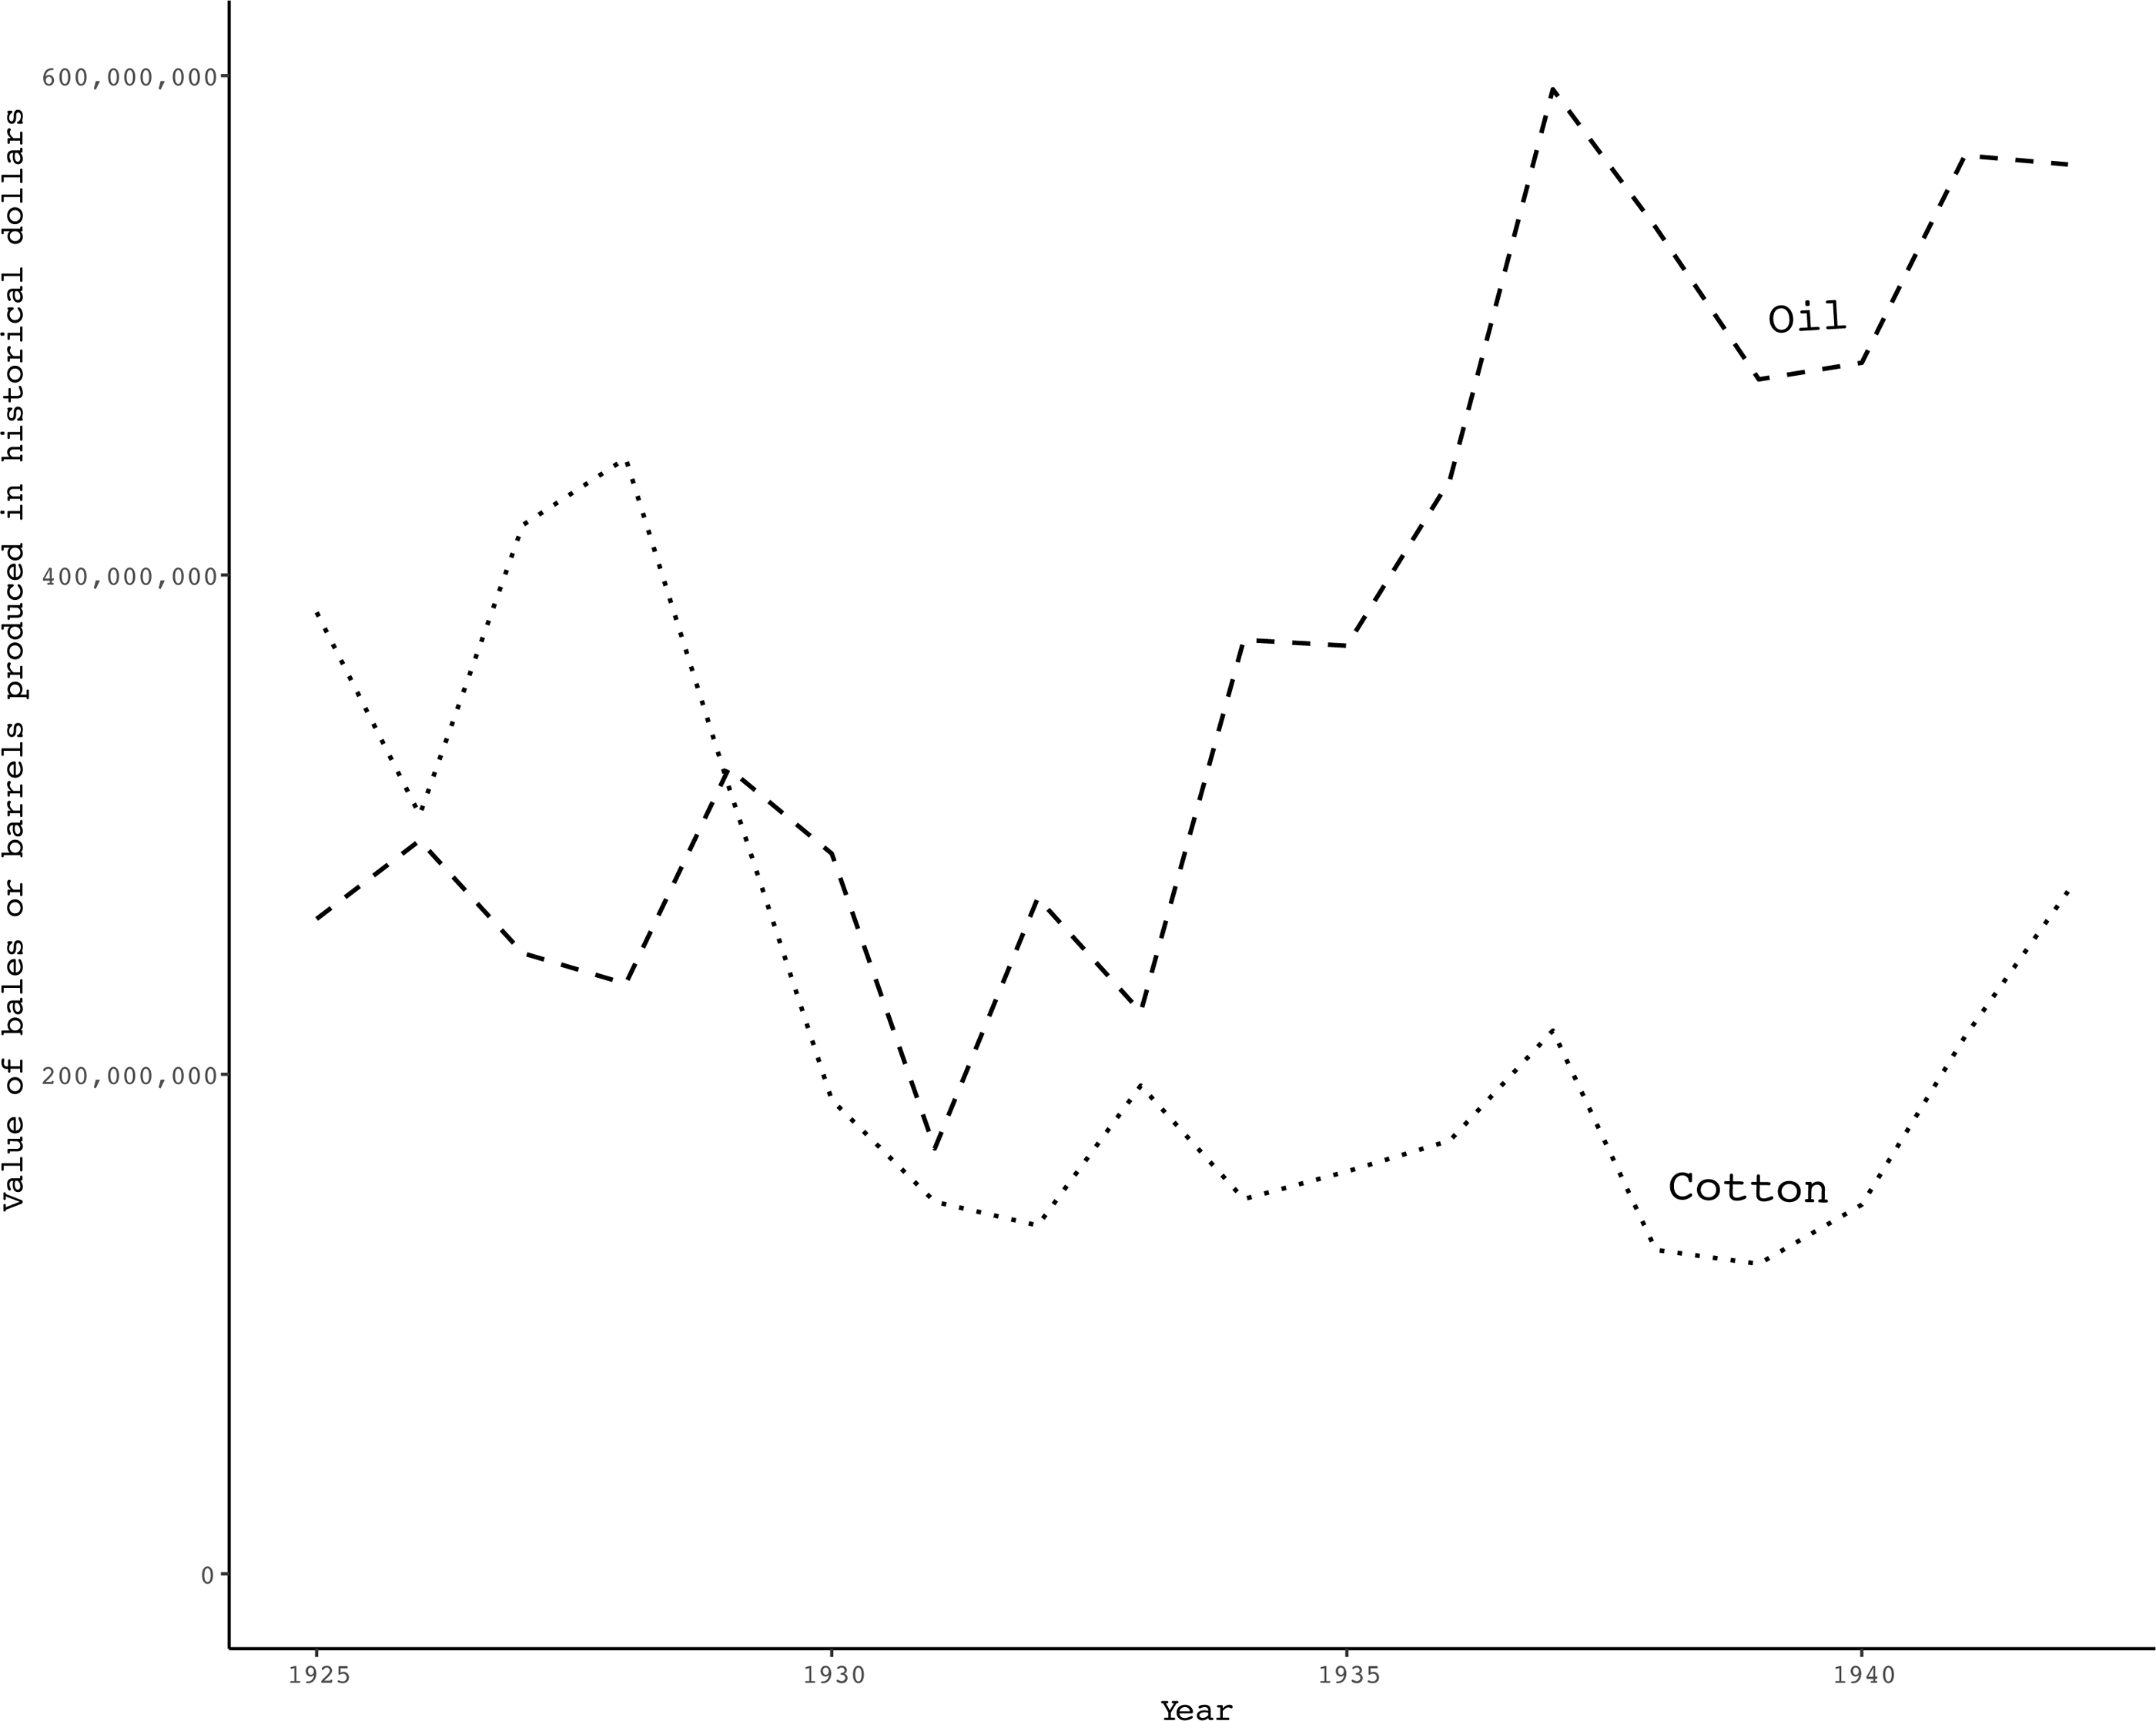
At the same time, the total value of cotton produced in Texas was taking a nosedive, as depicted in Figure 1. Cotton had been the state’s most important product since enslavers began colonizing East Texas in the early nineteenth century. In the decades after the Civil War, the cotton-growing plantation labor system in the Blackland Prairies region around Dallas “grew at a faster rate … than anywhere else in Texas or the rest of the South” (Smith et al. Reference Smith, Nelson, Magpiong, South, Dervarics, Plattner, Coe Schweiger and Reynolds2024: 3). By the early 1900s, “cotton fields surrounded Dallas on all sides,” visibly reminding residents of the crop’s dominance (Edwards Reference Edwards1974: 63). Nearly a fifth of the world’s cotton grew within 150 miles of the city, which had become the largest inland cotton market in the country. Many of the best-known Dallas elites worked as cotton brokers; others ran Dallas cotton mills staffed by child laborers; others presided over cotton plantations just outside the city; and many more inherited fortunes ballooned before Emancipation by cotton and enslavement. The only industry to rival cotton in the archetype of Dallas wealth was cattle, but cattleman comprised only 24 of the 3,864 adults listed in the 1925–1942 social registers.
Total value of oil went up, and cotton went down in Texas 1925–1942.
Note: Data come from The Texas Almanac and State Industrial Guide 1945–6. Dallas, TX: A. H. Belo Corporation.

In practice, cotton, cattle, and oil wealth often shaded into one another, in part because of land ownership. The West Texas oilfields generally lay under ranchland, and much of the East Texas Oil Field lay under cotton fields. To make significant oil money as a landowner required not just legal ownership but the power to protect oil claims, which usually meant belonging to the white landed gentry (McFarlane Reference McFarlane2017). Some Black farmers owned small tracts of land in the oilfields, but white people regularly colluded to steal their mineral rights (Olien and Olien Reference Olien and Olien2002; Presley Reference Presley1978).Footnote 6 In this literal sense, “old” landed wealth and “new” oil wealth were often one and the same.
Drillers did not have to own land, but they did have to be white, Christian men with some combination of money, connections, and luck. It cost around $26,000 to drill an oil well – half a million 2026 dollars – and only a tiny fraction of those wells ever produced (Olien and Olien Reference Olien and Olien2002). Drillers needed loans. Dallas quickly became the “financial and service center for the East Texas Oil Field,” largely because a Dallas banker named Nathan Adams developed specialized oil loans and other Dallas banks adopted his tactics (Adams Reference Adams1942).Footnote 7 In practice, such loans were only available to white men with some significant combination of economic and social capital.
In Dallas County, oilmen comprised just over half a percent of the adult male working population throughout the 1930s, and in fact, the percentage declined slightly during the oil boom years, from .63 percent in 1930 to .55 percent in 1940.Footnote 8 The percentage was so small because oil workers in the city were mostly high-level. Oilmen lived there when they worked for a company headquartered in Dallas, or when they were successful enough to require regular access to its bankers and lawyers. Dallas high society was a major draw for wealthy oilmen, as it was for wealthy people across industries, because it offered a concentration of elite institutions, resources, and potential friends, spouses, and business partners. Oilman H. L. Hunt said he moved to Dallas, for example, because “It made sense. His banks and attorneys were there,” but also because he wanted his daughter Margaret to marry an upper-class man (Burrough Reference Burrough2009: 119; Hill et al. Reference Hill, Boyar and Boyar1994). Unsurprisingly, then, oilmen were more highly concentrated in the wealthy incorporated Dallas enclaves of University and Highland Park, which housed just 6 percent of workingmen in Dallas County but fully a third of its oilmen (Baird Reference Baird1932). In Dallas, the much-discussed oil people were concentrated among the rich, rather than the city as a whole.
At every level of the oil industry, white, Christian men monopolized profits. All women were barred from the oil fraternities and fields. White oilmen threatened to murder Black, indigenous, and Latino men if they tried to work even the lowest-paid jobs on rigs, and they informally barred Jewish men from joining oil fraternities like the Dallas Petroleum Club (Presley Reference Presley1978; McFarlane Reference McFarlane2017). In one particularly notorious case, when members of the Osage Nation became enormously wealthy after oil was discovered on their lands in Oklahoma, powerful white people in the area began systematically murdering, marrying, and legally incapacitating Osage men and women in a partially coordinated effort to gain control of their land and oil revenues (Grann Reference Grann2017). The Osage Nation is directly north of Dallas; many Dallas oilmen worked in the Oklahoma fields and vice versa. Although oilmen tended to talk about their industry as open and meritocratic – as a line of work in which anyone could “make it” – drillers vigilantly patrolled the boundaries of their fraternity, categorically excluding women, Jews, and people of color from their spectacular profits. In this sense, too, oil money was not new, in that it flowed primarily to white, Christian men.
Cotton rich, rotten rich
Cotton and oil people in Dallas high society
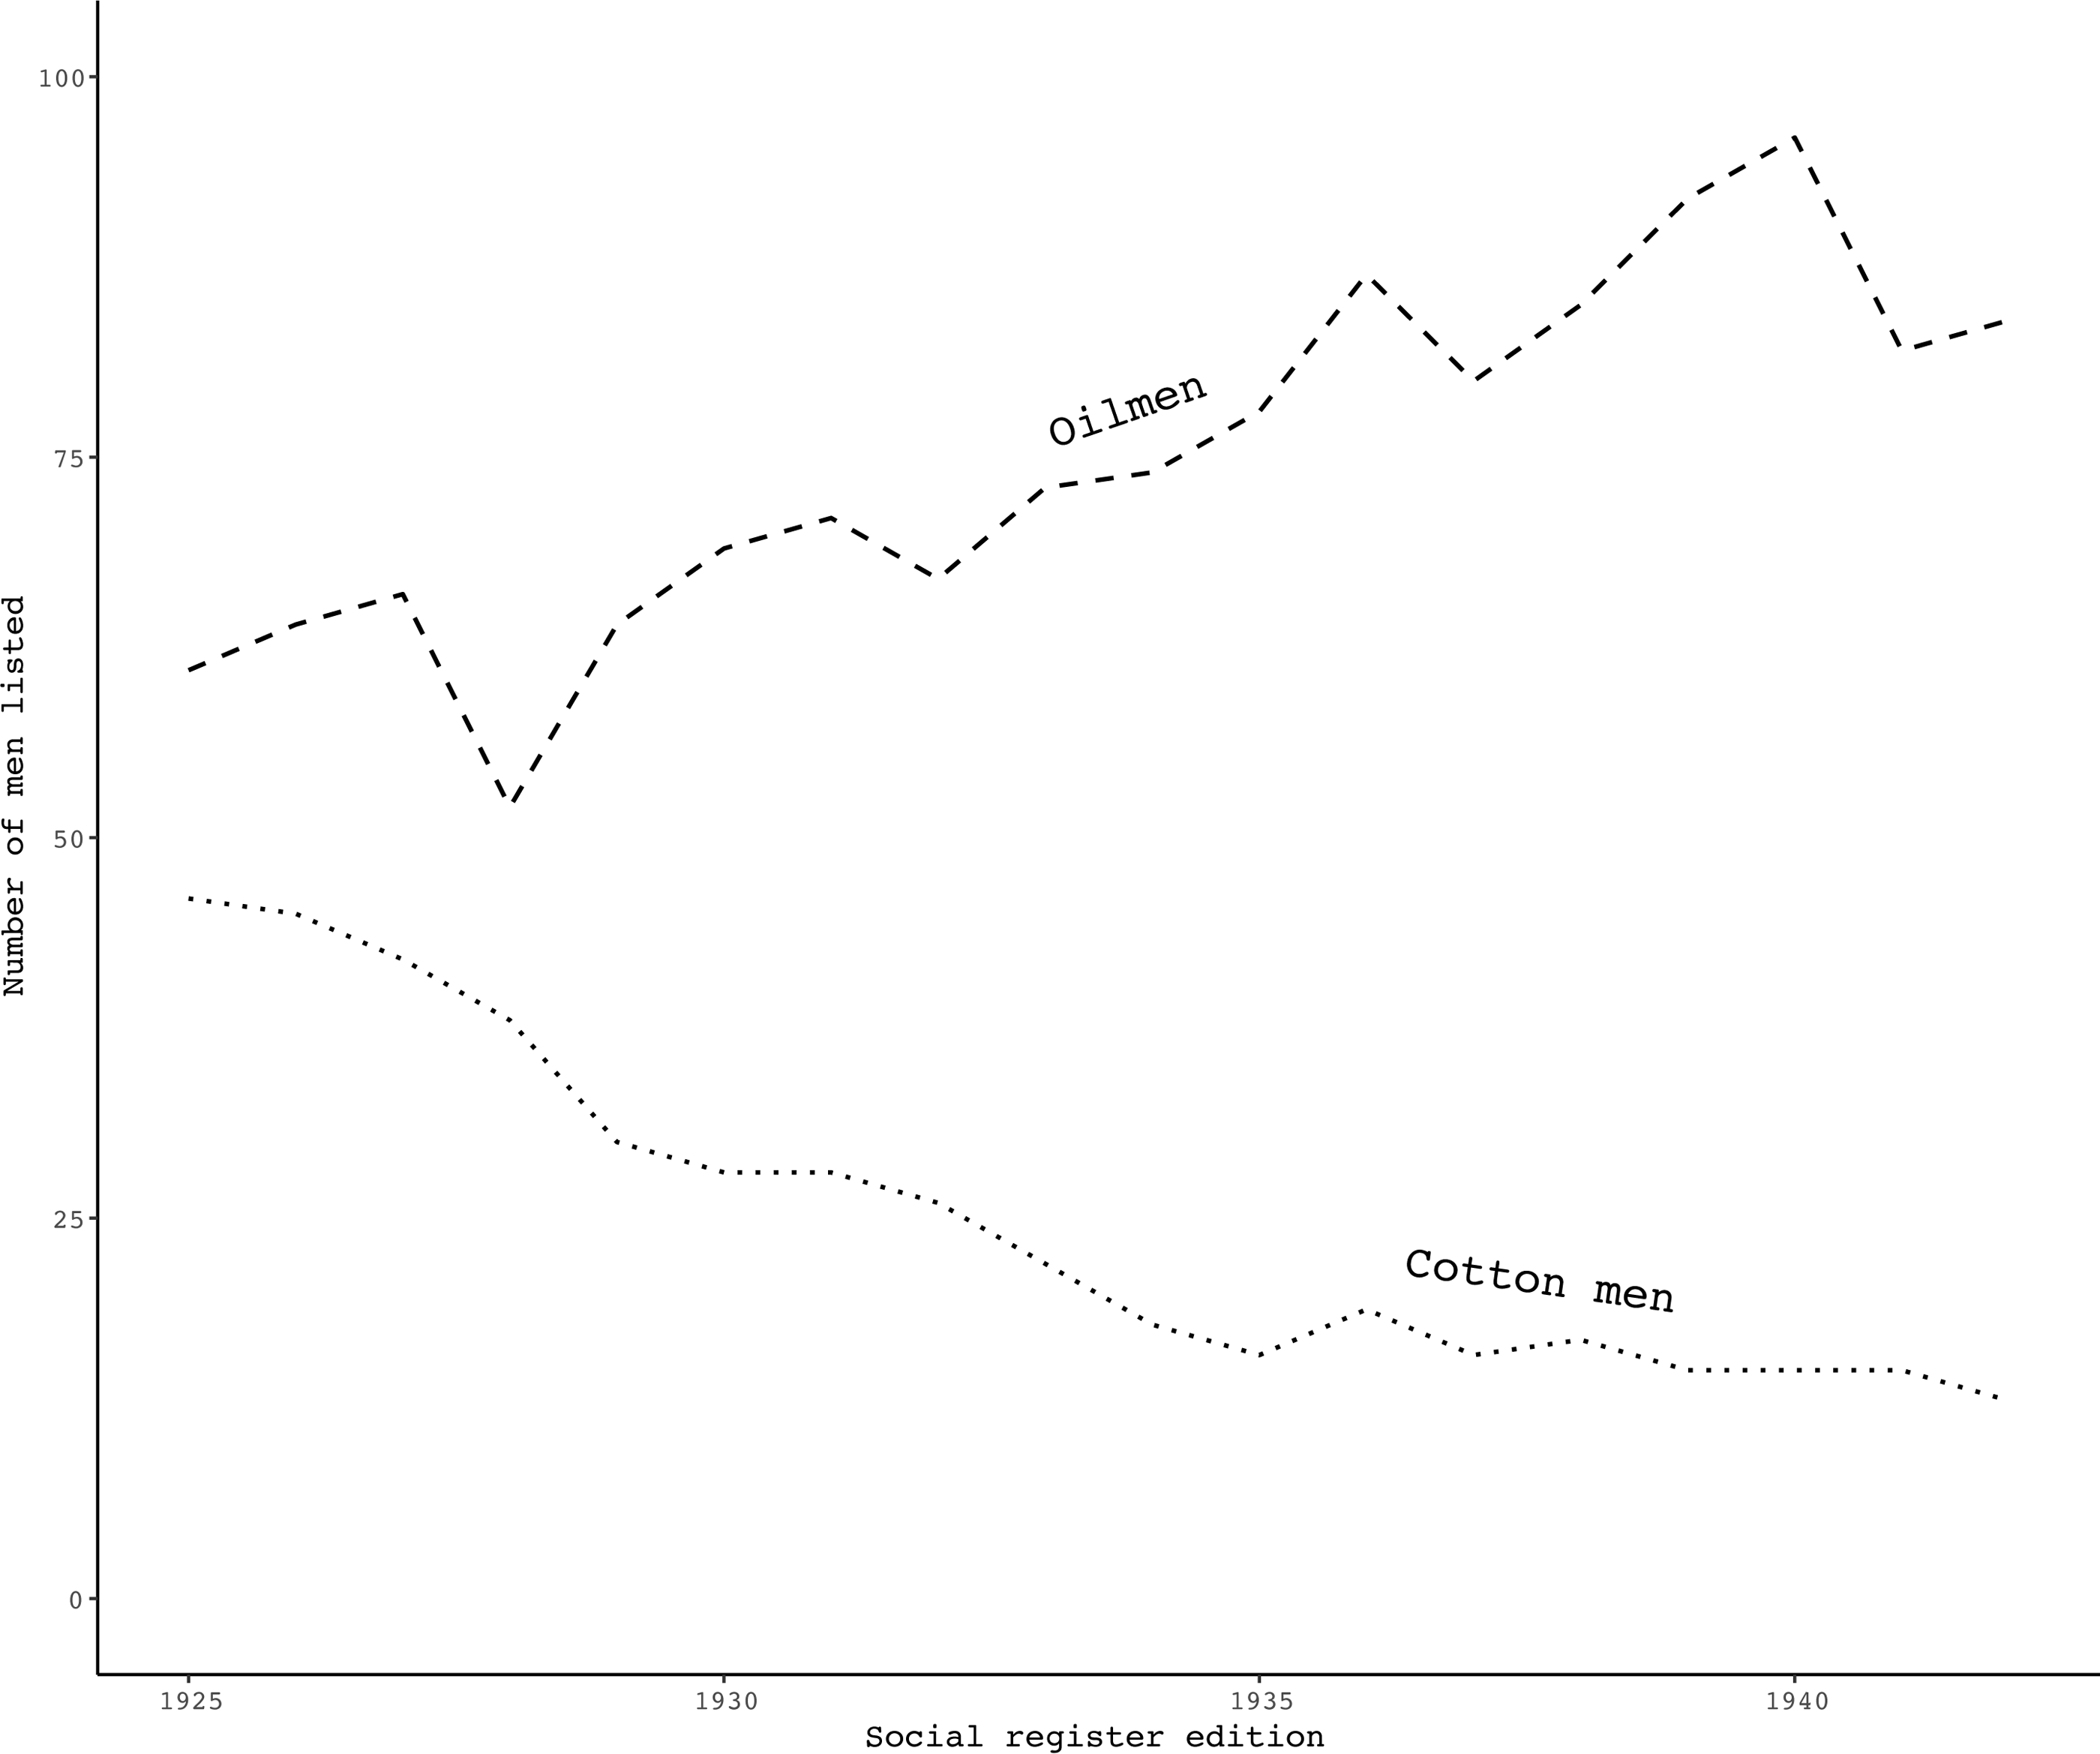
Histories and memoirs of the Dallas upper class during the oil boom overwhelmingly tell the same basic story: newly rich oil families arrived in droves and old-guard cotton families snubbed them, but inevitably fell from monied grace (I have found this narrative in most upper-class memoirs, interviews, news articles, and histories from and about this time period, which are far too many to cite; examples include: Acheson Reference Acheson1977; Adams Reference Adams1942; Bainbridge Reference Bainbridge1961; Beckett Reference Beckett1985; Byrd Reference Byrd1978; Crowell Reference Crowell1941; Dealey Reference Dealey1966; Hill et al.Reference Hill, Boyar and Boyar1994; Macatee Reference Macatee2008; Maxson Reference Maxson2011; Marcus Reference Marcus1974, Pederson Reference Pederson2024; Wolfe Reference Wolfe1989). Stanley Marcus (Reference Marcus1974: 246) of Neiman-Marcus remembered that during the oil boom, large numbers of oil families “decided to move in from the farms to take up residence in Dallas … but they were given a chilly reception by the old-guard ‘cotton families’, who regarded them as nouveau riche.” A socialite wrote that at the premier boys’ private school, students before the oil boom “were sons of cotton kings … but by the mid-1930s the school’s ranks included dozens of sons of the newly rich oilmen [who] … fit in about as well as skunks at a barbecue” (Wolfe Reference Wolfe1989:105). Old money cotton families who were “feeling the pinch” of the Great Depression reportedly viewed “oil titans” as a suspicious, totally distinct kind of person, to the point that one newly arrived oil wife was asked by an “an old money Dallasite,” “At Christmas our families always get together. What do you oil people do?’” (Maxson Reference Maxson2011: 41–42). One grand dame announced to a dinner party that she would “rather entertain a colored man at her table than an oilman,” a deliberately shocking claim in a community where explicit white supremacy was the norm (Wolfe Reference Wolfe1989: 108). In memoirs, newspaper articles, diaries, high society newsletters, at parties, and around dinner tables, Dallas socialites consistently grieved the fall of the old money “cotton rich” at the hands of the new money oil people they called “rotten rich” (Maxson Reference Maxson2011: 42). And indeed, as Figure 2 demonstrates, over the course of the oil boom, the number of upper-class men working in oil increased, and the number working in cotton plummeted. This is precisely the pattern we would expect if new money oil families overtook old money cotton families during the oil boom.
Cotton men and oilmen in the Dallas upper class.
Note: Data in this figure come from the Dallas social registers published between 1925–1942. In total, 1,927 adult men were listed in those years, including 232 oilmen and 75 cotton men.

If this old-to-new money turnover story was a good description of actual demographic change among the upper class, then we would also expect to find several further patterns in the data. First, the narrative leaves the impression that the Dallas upper class was dominated numerically by cotton and oil families. Second, it suggests that cotton families dropped out of high society at especially high rates during the oil boom. Third, and most prominently, the narrative assumes that oilmen were newer to wealth than cotton men. As I will demonstrate, the Dallas data refutes all three of these contentions and assumptions.
First, reading these accounts leaves the impression that the Dallas upper class was almost entirely composed of cotton and oil families. But most elite men worked in other industries common to cities across the country, like banking, insurance, and the law. Figure 3 depicts the proportion of upper-class men working in various industries over time from 1925–1942.Footnote 9 Although the number of oilmen increased significantly over the course of the oil boom, in total, cotton and oilmen composed only 16 percent of adult men listed in the registers in those years.
Industries of upper-class adult men, 1925–1942.
Note: Data in this figure come from the Dallas social registers published between 1925–1942. “Other” includes any industry in the data with fewer than 35 upper-class men total in those years: advertising, agriculture, arts, cattle, communications, education, entertainment, government, groceries, hospitality, media, military, mining, pharmacy, religion, services, transportation, and utilities. In total, 1,927 adult men were listed in that time.

Second, the old-to-new money narrative suggests that cotton families, “feeling the pinch” of the Depression, dropped out of high society at particularly high rates during the 1930s (Maxson Reference Maxson2011: 43). Figure 4 compares the family persistence rates of pre-oil boom elites by industry. These are lower bounds on general upper-class persistence rates, as many of the families who left the Dallas upper class simply moved to the upper classes of other cities and towns. Overall, 68.4 percent of upper-class adults in the 1925–29 registers persisted personally or through descendants after 1940. Despite widespread reports of their total decline, cotton families persisted at a slightly higher rate than other upper-class families: 72.7 percent. Pre-boom oil families persisted at slightly lower rates: 67.2 percent. In this way, too, the narrative is wrong: cotton families were less likely to drop out of high society than pre-boom oil families and upper-class families overall.
Upper-class persistence after 1940, by industry.–
Note: These data cover men born before 1900 who were listed in the Dallas social registers between 1925–1929 (n = 929). Industries depicted here include any industry with more than 10 such men listed in those years. Persistence is calculated as whether the man or any of his children, nieces, nephews, or their lineal descendants were listed in any Dallas social register after 1940.

Lastly, and most saliently, the old-to-new money narrative hinges on the idea that oilmen were disproportionately new to wealth and status, whereas cotton men were generally born to it. But oilmen and cotton men had nearly identical class backgrounds: mostly born rich and rarely born poor. Figure 5 depicts the percentage of adult men across industries who were born into Dallas high society. Although the narrative would suggest that cotton men were born into Dallas high society at especially high rates, they were some of the least likely to have been born into the Dallas upper class at 44 percent. Oilmen (46.1 percent), who were supposedly totally new to Dallas high society, were very slightly more likely to have been born into the Dallas upper class than cotton men. Both cotton and oilmen fell modestly below the overall average of 51.1 percent; if any industry category was decidedly old money Dallas, it was lumber at 64.9 percent.
Share of upper-class men born into Dallas upper class, by industry.
Note: These data cover adult men listed in the Dallas social registers between 1925–1942 (n = 1,927). Industries depicted here include any industry with more than 25 men listed in those years. I count them as born to the Dallas upper class if they have any parents, aunts, uncles, or grandparents listed in the Dallas social registers.

But Figure 5 cannot tell us about class background more generally. Throughout this time period, and across industries, Dallas high society was populated largely by geographic newcomers, who composed fully half of the adult population. Some were upwardly mobile, and some simply came from the upper classes of other cities and towns. Figure 6 depicts the percentage of cotton and oil people who were: (a) born into Dallas high society, in the sense that they had elders listed in the Dallas social registers before them, (b) born into the upper class elsewhere, (c) born middle class, or (d) born poor or working class. Oilmen were, if anything, more often born upper class than cotton men, and less often born poor. The differences between their class background distributions were negligible, particularly compared to the overwhelming, consistent characterization of oilmen as “new money” and cotton men as “old money.”
Class backgrounds of upper-class cotton and oil people.
Note: These graphs cover all cotton men, oilmen, and their wives who were listed in the Dallas social registers between 1925–1942.

Class backgrounds of Dallas Petroleum Club oilmen, compared to upper-class cotton men and oilmen.
Note: These graphs cover all cotton men and oilmen listed in the social registers between 1925–1942, compared to all members of the Dallas Petroleum Club from its founding in 1934 until 1942.

But perhaps the narratives were really about oil wives being new to money, rather than the oilmen themselves. Figure 6 also depicts the class backgrounds of the women married to oil and cotton men. Their backgrounds look much like their husbands’ overall, in that few were born poor, and most were born rich. Oil wives were both slightly more likely to have been born poor and slightly more likely to have been born into the Dallas upper class. The difference between genders was bigger than the difference between industries. Wives were slightly more likely than husbands to have grown up poor, less likely to have grown up in the Dallas upper class, and more likely to have grown up in upper classes elsewhere. These are interesting wrinkles that I will return to in the discussion and conclusion section, but they do not support the claim that cotton families were old money and oil families were new money. When it comes to actual class backgrounds, the supposed poles of the old-to-new money continuum – cotton and oil – looked remarkably similar.
The characterization of cotton people as “old money” and oil people as “new money” further implies that men married women from their own class backgrounds: cotton heirs married heiresses, and new money oilmen married new money women. But yet again, the stereotype was not reflected in the data. Among all cotton (n = 62) and oil (n = 179) couples, most pairs featured at least one person born into the upper class: 90.3 percent of cotton couples, and 82.2 percent of oil couples. Six of the fifteen rags-to-riches oilmen married upper-class women, and five of the six rags-to-riches cotton men did so. There were no rags-to-riches marriages at all among cotton couples, and among oil couples, there were only four. Across oil and cotton couples, then, typically at least one person was born upper class.
All in all, the class backgrounds of upper-class cotton and oil people were practically indistinguishable. They were mostly born upper class and rarely born poor. Class background was more patterned by gender than by industry, but only modestly so. Most oil and cotton couples featured at least one upper-class-born person. Despite the widespread stereotype of oil people as “new money” and cotton people as “old money,” oil people were no “newer” to wealth or upper-class status than cotton people in any substantive sense.
The merely rich Dallas oilmen
Perhaps the vulgar “new money” oilmen were never listed in the social registers; they could have been concentrated among the rich, but excluded from the upper class. The Dallas Petroleum Club is a good test of this idea, because unlike the social registers, which required some basic level of social and cultural capital for inclusion, membership in the DPC required only wealth – plus whiteness, maleness, Christianity, and connection to oil. The DPC’s openness to upwardly mobile white Christian oilman was well-known; one socialite observed of the DPC that “a goodly number of these men are self-made” (Rogers Reference Rogers1951: 277). And indeed, as Figure 6 demonstrates, the oilmen of the Dallas Petroleum Club were much less likely to have been born rich than the upper-class oilmen – 51.3 percent, compared to 73.7 percent. They were also more likely to have been born poor, although the percentage still was not particularly high – 12.0 percent, compared to 7.3 percent. Much of the difference was in the size of the middle class; the middle-class-born contingent was about twice as large in the DPC as in the upper class (36.7 percent, compared to 19 percent). Overall, among the merely rich oilmen, half were born upper class, and upward mobility was much more likely to have been medium-range (coming from the middle class) than long-range (going from rags to riches).
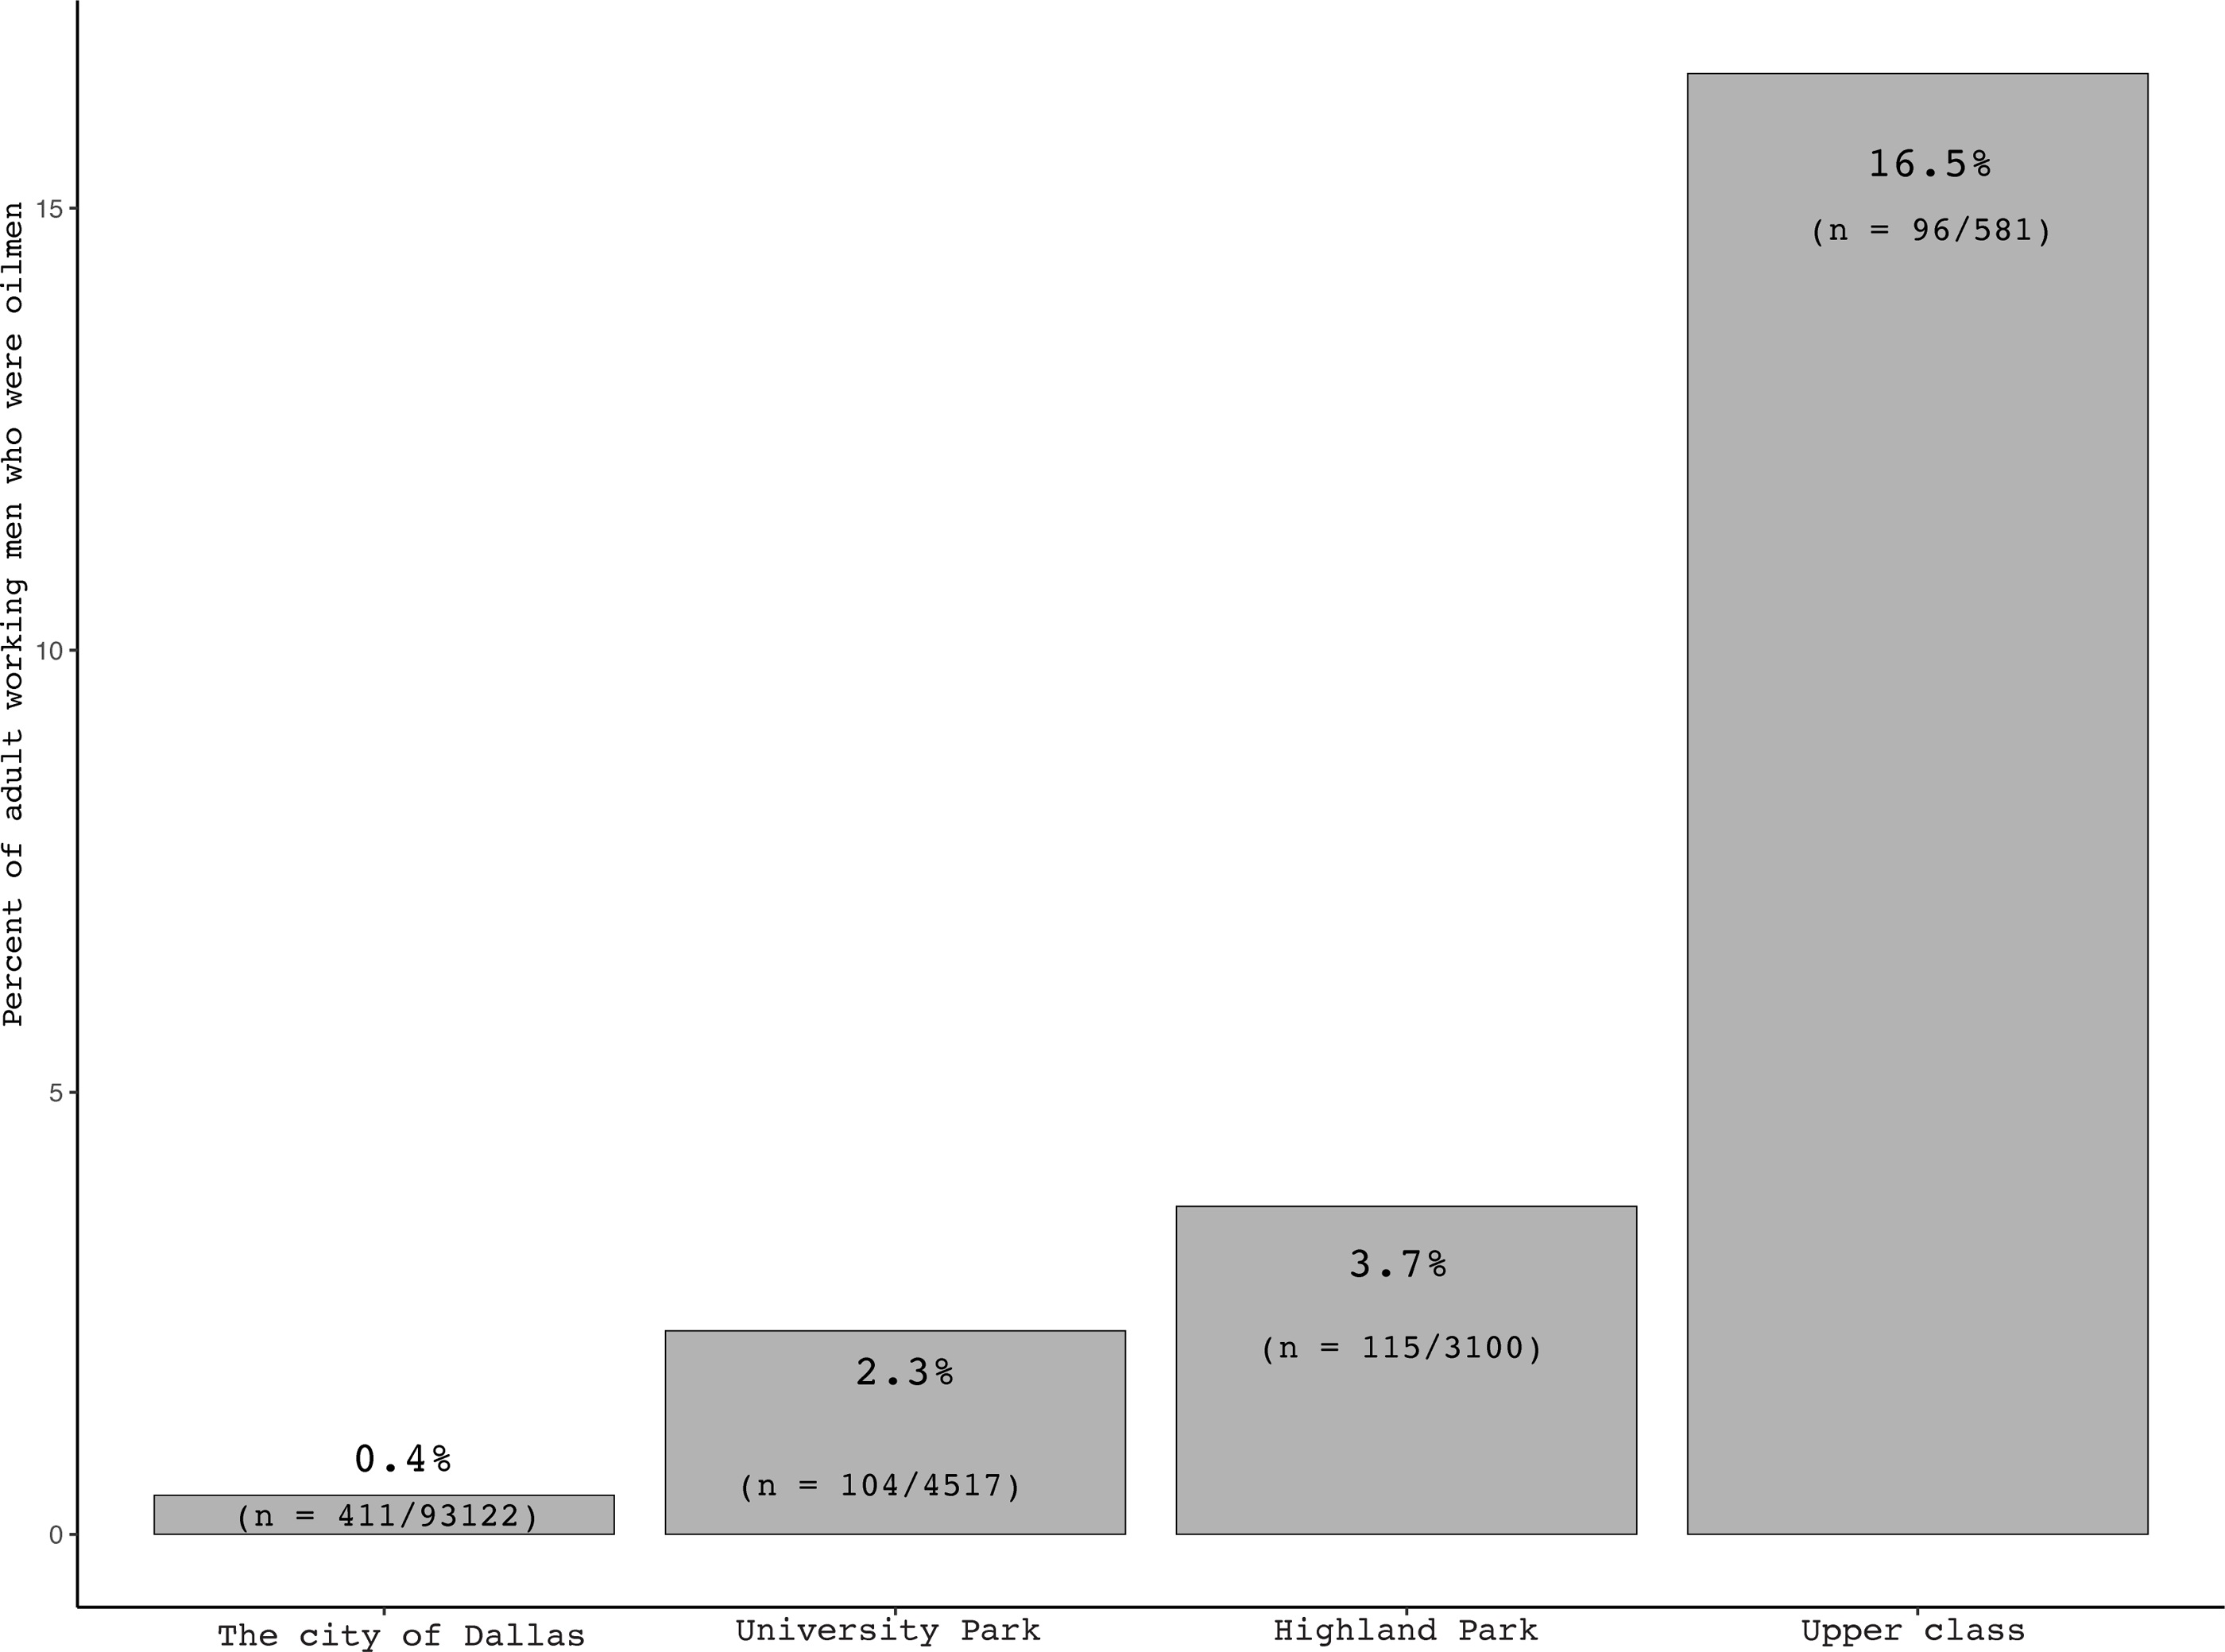
If rich Dallas oilmen were disproportionately excluded from high society, they should have been less likely than other wealthy men to be included in the social registers. But oilmen took up an even larger share of the social registers than they did of the wealthy, incorporated neighborhoods of Highland Park and University Park. Figure 8 depicts the percentage of oilmen among working men for four populations in 1940: the city of Dallas, University Park, Highland Park, and the social register. In the city of Dallas, just 0.4 percent of workingmen were oilmen. In the wealthy incorporated enclave of University Park, 2.3 percent were oilmen, and in the even richer Highland Park, 3.7 percent were oilmen. Oilmen, then, were concentrated among the rich. If rich oilmen were excluded from the upper class at especially high rates, we would further expect that the percentage of oilmen in the 1940 social register would be lower than the percentage of oilmen in the Park Cities. But it was many times higher: fully 16.5 percent of men listed in 1940 were oilmen. In the absence of information about why particular individuals were and weren’t included in the social registers, the simplest plausible explanation for this finding is that oilmen were included at especially high rates because they were especially rich. Regardless, even though oilmen were supposedly kept out of “everything worthwhile” by established cotton families, they were included in the upper class at disproportionately high rates.
Oilmen were included in the upper class at especially high rates in 1940.
Note: The number of oilmen and the size of the populations for Dallas, University Park, and Highland Park come from the 1940 US Census. University Park and Highland Park are wealthy incorporated towns in the center of Dallas housing much of the upper class; Highland Park is richer than University Park. The number of oilmen and the size of the population for the 1940 upper class comes from the 1940 edition of the social register.

All in the family: oil and cotton kin
Finally, the old-to-new money narrative fundamentally relies on the idea that cotton and oil families were clearly distinct from one another. But the upper-class family network was a massive, highly entangled hairball, and industries comingled and mixed across it. By the close of the second World War, most upper-class oil and cotton men were traceably related to one other by some distance of blood and marriage. Not only were cotton and oilmen numerical minorities within the upper class, and not only were they mostly related to each other; they were also thoroughly enmeshed with all other industries through kin.
Throughout this time period, most members of the Dallas upper class had an oilman and a cotton man somewhere in the extended family – about 70–80 percent for both industries across social register years. Oil relatives became increasingly common over time among the upper class, as young heirs adapted to shifting economic conditions. Notably, the sons of cotton barons were more likely to work in oil than any other industry except cotton. Take, for example, the Earl Fains: Earl Fain I (1873–1961) was a cotton broker, Earl Fain II (1907–1980) was an oilman, and Earl Fain III (1932–2018) was an oil industry analyst trained on Wall Street.
Figure 9 shows the mean kin distance from oil and cotton men over time for the upper class, along with select other industries. As young upper-class people increasingly became and married oilmen, the average kin distance between Dallas upper-class people and their nearest oilman relatives decreased, going from 3.2 kin ties in 1925 to 2.5 in 1942. In contrast, the average kin distance from cotton barons increased, going from 3.6 to 4.2, reflecting the decline of cotton as a lucrative upper-class career. Here, one kin tie is the distance between a person and a close family member: spouse, parent, child, aunt, uncle, grandparent, or first cousin. By 1942, then, the average elite might have an oilman as a brother-in-law, and a cotton man as a brother-in-law’s father. The only industries more thoroughly spread through the family network than oil were the legal and financial industries. In the upper-class family web, both oilmen and cotton men were ubiquitous, but oilmen even more so – second only to bankers and lawyers.
Average kin distance from oilmen, cotton men, and select other industries in the Dallas upper class over time.
Note: For this graph, I constructed the kinship network as it was for each year, based on birth, death, and marriage years. Then, for each person listed in that year’s social register, I calculated their minimum kin distance from an adult man in each industry. One kin tie, here, is equal to a spouse, sibling, parent, child, adult, uncle, niece, nephew, grandparent, grandchild, or first cousin. I have included only a sample of industries, selected for substantive interest and visual clarity.

The fact that most upper-class people were related to oilmen – and more closely related to oilmen than cotton men, even before the oil boom – contradicts claims that oil people were distinct from and replacements for established high society families. One unusually clear-eyed local socialite, John William Rogers (Reference Rogers1951: 278), observed that even though Dallas socialites tended to regard oil people “as a group apart,” they were in fact so increasingly entangled through birth, marriage, friendships, and organizational affiliations that by 1950, “trying to set them apart [was] a little like attempting to isolate in your bloodstream the portion that is your maternal grandfather.” New oil money was a folk social category, and not an accurate description of the distribution of industries and class backgrounds in the Dallas upper-class family web.
Texas is a new boy: The prototypical elite shifts from cotton to oil
As I have demonstrated, the widely reported clash between new oil money and old cotton money in Dallas did not line up with measurable reality at the level of the upper-class population, in that most cotton families persisted through the oil boom, most oil people were born upper-class, and most elites had both oil and cotton men in the family. So why did upper-class observers invariably describe the 1930s as an invasion of nouveau riche oil people, met with resistance from old-guard cotton people, as illustrated by reams of different memoirs and histories? And why didn’t other industries, like insurance, banking, or the medical industry, get similar narrative attention? I argue that while the new-versus-old-money narrative did not describe actual mobility patterns into and out of the upper class, it did describe a historical shift in the local prototypical elite from a cotton baron to an oil millionaire.
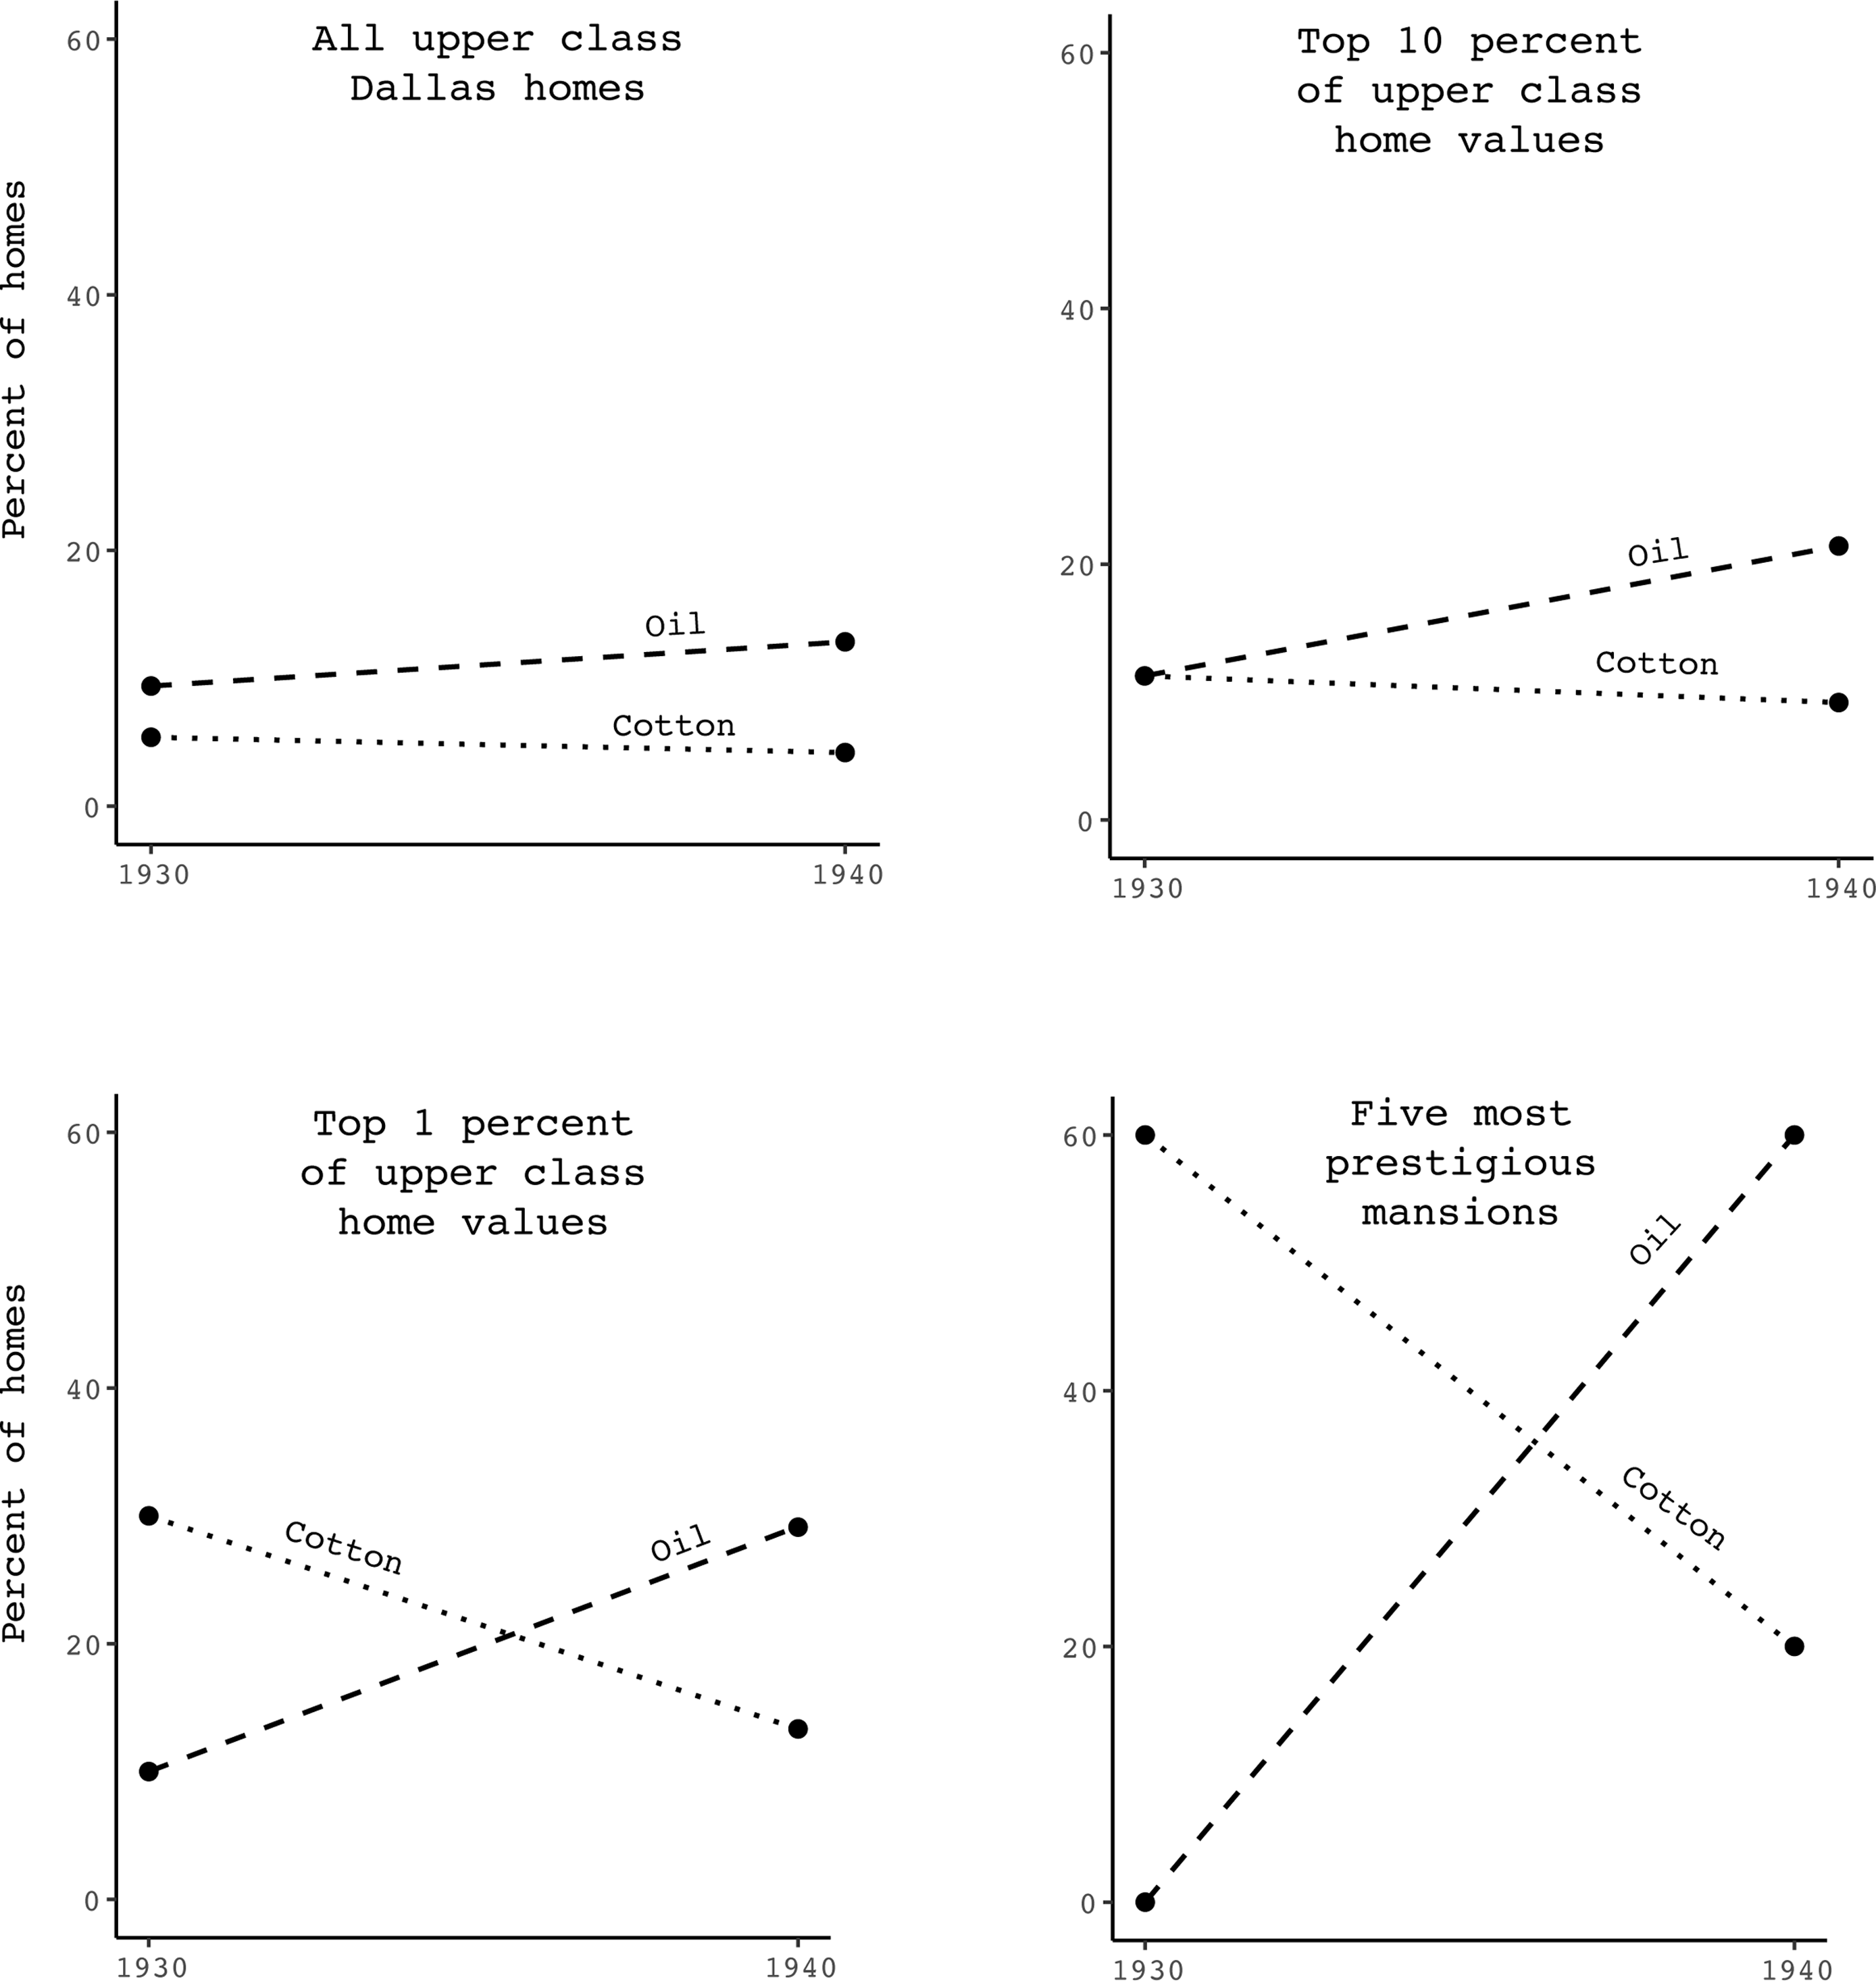
Although cotton and oilmen were never a majority of Dallas upper-class men (see Figure 3), home values from 1930 and 1940 suggest that the cotton and oil kings were disproportionately represented among the visibly richest of rich Dallasites – the 1 percent of the 1 percent. Based on home values, it seems that whereas the upper-class population saw modest change and overall persistence through the oil boom, among the very richest, cotton-to-oil turnover was real and dramatic. Figure 10 depicts the share of high society homes owned by cotton and oil families at various segments of the upper-class home value distribution in 1930 and 1940. Home values are useful for approximating perceived wealth because homes were visible to others, and like wealth more generally, home values were exponentially distributed across the high society population. Within the upper class at both time points, cotton and oil families owned homes at the same rates as other upper-class families. Among all high society mansions, then, the story of cotton and oil families was one of modest change and significant persistence. But the more expensive the high society mansions were, the more the share of cotton families declined, and the more the share of oil families increased. At the top 10 percent of upper-class home values, cotton and oil families began with similar proportions of elite homes, and ten years later, oil families had acquired a slightly larger share and cotton families a slightly smaller one. At the top 1 percent of homes, the pattern was stronger: cotton families began with a much larger share than oil families and ended with a much smaller one.
Turnover from cotton to oil among Dallas upper-class homeowners.
Note: These calculations are based on the home values in the manuscript 1930 and 1940 US Census. I have collected home values for all homeowners listed in the social registers from 1925–1942. Their homes were much more valuable than homes in the city overall. The median 1930 upper-class home value was $15k, compared to $4,932 across the city; in 1940, it was $10k, compared to $2,995 across the city. Across the entire county, the dataset covers most of the most expensive homes: 721 of the 792 homes in the top home value bracket listed in the aggregate Census in 1930 and 412 of the 478 homes in the top home value bracket in the entire county in 1940 ($20,000+ in both years). The five most prestigious mansions in 1930, based on home values and extensive qualitative research, were 4700 Preston (cotton to oil), 4800 Preston (no change-car dealer), 4500 Preston (no change-cotton), 4301 Lakeside (cattle to oil), and 2821 Turtle Creek (cotton to oil).

Turnover was starkest at the very top of the distribution. In 1930, the five most expensive, high-status homes in Dallas saw a huge turnover. These estates were (and are still) enormously prestigious in Dallas, resting on multi-acre, walled-off lots in the heart of the city. Three of the five belonged to cotton families in 1930, and zero belonged to oil families. Over the following decade, two cotton couples and one cattle couple sold their estates to oil people, leaving oilmen with three of the local palaces and cotton men with only one. These transfers were major news among the elite, many of whom regularly attended parties and other social events at the famed estates. At least two memoirs from upper-class people unrelated to any of the actual residents mentioned the transfer of 4700 Preston, “the most prestigious address in Dallas,” from cotton baron Mike Thomas to oilman John R. Black (Hill et al. Reference Hill, Boyar and Boyar1994: 152, Macatee Reference Macatee2008: 56).Footnote 10 At the level of the high society population, the oil boom years may have been characterized by modest change and considerable persistence, but at the level of tycoons, prototypes, and palaces, the oil boom years were a revolution.
This turnover among Dallas’s local palaces can help explain why elites saw massive turnover despite overall upper-class persistence. I make this argument in five parts: (1) prototypical elites are often associated with regionally specific industries, like cotton and oil; (2) prototypical elites are particularly wealthy relative to other elites; (3) the extreme tails of wealth distributions, where prototypical elites tend to be located, may be especially characterized by “churn” in capitalist societies; (4) the oil boom made some oilmen rich on a scale unprecedented for Texas, attracting considerable attention from the national media, which increasingly characterized all rich Texans as newly rich oilmen; and (5) all of these factors triggered a shift in the prototypical Texan elite from a cotton baron to a new money oilman – a shift some elites promoted because they viewed it as more attractive to outside investors, and others vocally resisted by aligning themselves instead with the older cotton baron prototype.
First, prototypical elites are often associated with regionally specific industries. It is striking that even though Dallas elites tended to describe their world in terms of “cotton people” and “oil people,” and sometimes in terms of cattle barons, most (84 percent) upper-class Dallas men worked in other industries (see Figure 3). Oil, cotton, and cattle were more symbolically important to Dallas high society because they were relatively unique. Silicon Valley is home to wealthy lawyers, investment bankers, and real estate moguls, but it is widely known for tech fortunes. At various times, Chicago’s and Cincinnati’s elites have been associated with meatpacking, Pittsburgh’s with steel, Los Angeles’s with movies, Detroit’s with cars, Boston’s with shipping, and San Francisco’s with gold. In Dallas high society, most men were bankers, lawyers, doctors, insurance executives, or some other lucrative occupation common to every US city. But every twentieth-century regional US upper class had rich bankers and lawyers; cotton, cattle, and oil were regionally specific.
Second, prototypical elites are especially wealthy relative to other elites. While the Dallas upper class overall was much richer than the rest of the city population, within the upper class, the richest families were many times richer than their friends and neighbors. As Figure 9 shows, oil and cotton people were disproportionately represented among owners of the most expensive mansions. This finding strongly suggests that in general, cotton and oil people may have been overrepresented among the richest people in Dallas. The recollections of socialites certainly support this idea. Socialite Elza Ruth Collins (1891–1979), when asked about her impressions of the wealthy Dallas neighborhood she moved to in 1915, said that “first I remember the cotton men … these big cotton men like M. H. Wolf and Mike Thomas were to me billionaires.”Footnote 11 (Mike Thomas is one of the cotton kings who dramatically lost his prestigious mansion to an oilman.) Another socialite remembered that before the oil boom, “cotton was the most spectacular business of the town,” and “many” of the richest people were cotton men, such that “the successful cotton man was the symbol of money in the community as the successful oil man is today” (Rogers Reference Rogers1951: 202–3). As oil replaced cotton at the top of the wealth distribution, socialites saw the prototypical Dallas elite change from “the successful cotton man” to “the successful oil man.”
Third, the extreme right tail of a wealth distribution is likely especially characterized by “churn,” especially as industries boom and bust in capitalist settings. As Figure 1 illustrates, in 1930s Texas, oil boomed and cotton busted. The people whose fortunes were tied most wholly to those industries would then be especially likely to see their fortunes boom or bust accordingly. As I have also argued, this doesn’t mean that cotton men became impoverished and oilmen rose from nothing. When vast fortunes fluctuate in a dynamic market, tycoons may regularly swap spots at the pinnacles of rich lists, even as they rarely fall or rise far relative to the full wealth distribution.
Fourth, upper-class Dallasites were not only seeing their local palaces change hands from cotton to oil; they were also increasingly confronted with the new international archetype of the Texas “oillionaire.” News media tend to focus disproportionately on certain types of economic elites and largely ignore others, depending on the context and characteristics of elites themselves (Ischinsky Reference Ischinsky2026; Savage et al. Reference Savage, Gronwald, Inkley, Mahmoudzadeh and Pagnini2026). After the East Texas Oil Boom, national and international media became increasingly obsessed with Texan oil wealth. Life and Fortune ran regular, breathless features on the “new” Texan rich. Reporters and novelists flocked to Texas to chronicle the wild spending and brash behavior of the “new money” Texas oilmen (Bainbridge Reference Bainbridge1961). In 1957, Fortune published a landmark rich list – a precursor to the Forbes 400 – that categorized its millionaires into only two ways, “Inherited Wealth” and “Oil.” The accompanying editorial characterized the “new rich” as mostly Texan oilmen, even though Texans represented only a quarter of the “self-made” fortunes, and even though most of the supposedly “self-made” Texan oil millionaires were born to rich parents (Smith Reference Smith1957). In the midst of this publicity, Dallas socialites found that when they made their regular pilgrimages to Europe, New York, and California, strangers began to assume that because they were rich Texans, they must be “nouveau riche oil millionaires” (Lewis Reference Lewis1984: 76).
All of these factors triggered a shift in the prototypical elite from a cotton baron to a new money oilman. As one Dallas heir remembered, “the Texan Oil Man became both for better or worse a mythic figure” (Maxson Reference Maxson2011: 42). Both in and outside Dallas, the archetype of a Texan was changing. Gordon-Reed (Reference Gordon-Reed2021: 17–29) observes that even today, “the image of Texas has a gender and a race: Texas is a White man,” but that the kind of white man has changed over time. She explains that from the perspective of early wealthy white Texans, the archetypal Texan was a “Slave Plantation Owner.” The first wealthy, white settlers were mostly enslavers; indeed, they started the Texan “War of Independence” to secure legal protection for enslavement.Footnote 12 But the locally prevalent Slave Plantation Owner archetype was subsumed under three newer, nationally known Texan archetypes. When a few cattle fortunes exploded to stratospheric heights after the Civil War, the Texan became a Rancher and a Cowboy. Then came oil wealth, and “the Oilman soon challenged the Cowboy and the Rancher as the archetypal Texan” (Reference Gordon-Reed2021: 20). The new Texan, in his narrative distance from plantation slavery, and his association with West Texas, “a part of the state relatively devoid of Black people,” “quiets the noise a bit and avoids the tragic element in Texas history,” which is, of course, slavery, land theft, and genocide (Reference Gordon-Reed2021: 29). Texas became a newly rich white boy.
From the perspective of some Dallas power brokers, avoiding the “tragic element” of slavery and genocide was a public relations strategy. Around the time of the oil boom, many local power brokers, particularly the ones whose businesses were closely tied to investors outside the South, began to talk about Dallas and themselves differently. Their imagined Dallas shifted from a Confederate stronghold headed by aristocratic patriarchs to a shiny cowboy utopia built wholesale and history-free by enterprising businessmen (Graff Reference Graff2008; Phillips Reference Phillips2006). Oilmen fueled this narrative shift, framing themselves as lucky, genius entrepreneurs rather than the upper-class scions they typically were. The narrative caught on; socialite Rogers (Reference Rogers1951: 294) opined that the oil boom filled Dallas with the “clean wealth” of oil, which was both self-made and “untainted by blood money.” The discursive shift aligns with the narrativized transition from cotton, associated with enslavement, to oil, associated with supposedly rags-to-riches, independent white men. Perhaps the transition was uncomfortable for some socialites whose self-image was more closely tied to the “blood money” of inherited enslaver wealth. It may have been particularly uncomfortable for upper-class women, who, excluded from the meritocratic logics of men, relied solely on the logics of inheritance and white supremacy to justify their wealth and status. It makes sense, in that context, for many upper-class Dallasites to emphatically distance themselves from the new money Texas oilmen.
Regardless, the symbolic transition was a successful one. It was reflected in and reinforced by the dominant narrative of “new money” oil people overtaking “old money” cotton people, by the tangible cotton-to-oil turnover at the upper echelons of elite mansions, and by the press’s perpetual fascination with fabulously rich Texan oilmen. The foundation of white wealth in Texas was enslavement, land theft, and genocide, but the archetypal rich Texan was no longer a Slave Plantation Owner; few Texans were newly rich white men, but Texas is still a new white boy.
Illustrative example: the Caruths and the Byrds
I will now present an example that illustrates all the key themes of these findings. Consider William Walter Caruth I (1876–1949) and D. Harold Byrd (1900–1986), two men who, on the surface, seemed to embody the old money cotton and new money oil archetypes, respectively. Will Caruth inherited thousands of acres of prime Dallas land from his rich enslaver parents, and like his parents, he filled the acreage with cotton. He went to the most elite schools, he joined the fanciest clubs, and he married a debutante who became one of the most powerful socialites in the city. Supposedly, the oil boom years were financially tough for the Caruths: some people said that Will was starving his cows. But, obsessed with cotton and cattle, Will refused to sell a single acre, to the point that when his wife wanted to send their son to Harvard Business School, she had to use her own inheritance to pay his tuition (Sanders Reference Sanders1988). Meanwhile, D. Harold Byrd was a small-town wildcatter who believed in the “value of showmanship”; before he’d even struck it rich, he paid a chauffeur to drive him around in a fancy car because “it exuded an aura of MONEY” (Byrd Reference Byrd1978: 33). While Will was starving his cows, Harold made millions of dollars practically overnight in the East Texas Oil Boom. He decided to move to Dallas, “become a welcome member of Dallas high society, … and eventually get married” (Byrd Reference Byrd1978: 38). The following year he became the very first “Byrd” listed in the Dallas social registers, and three years after that, he married Will’s daughter Mattie.
The old money Caruths loathed Harold, who did look and behave like the classic Texas new money “oillionaire.” He bragged constantly about his fortune, threw extravagant parties, and landed in embarrassing national news stories on spendthrift Texas millionaires. He was aware and unashamed: Byrd (Reference Byrd1978: 39) himself remembered that “whether by design or accident, I [evolved] into what other people from other parts of the country visualize as the archetype of the Texas oil millionaire … They would doubtless accuse me of being boastful, loud, and enamored of ‘bigness’ for its own sake, and I might as well plead ‘guilty as charged’.” Even Mattie disliked her husband, especially in her later years; when she died, she was buried in all her best jewelry, in a casket sealed with concrete and steel, because she didn’t want Harold to give her jewels to his girlfriends (Sanders Reference Sanders1988: 177–8). The Caruths, a quintessential old money cotton family of Dallas, emphatically resented the intrusion of their “new money” oilman.
But as Harold himself explained in his memoir, I’m an Endangered Species: Autobiography of a Free Enterpriser, he was not by any means “crashing” his way into Dallas high society by marrying or amassing money: he was welcomed immediately because of his matrilineal cousins. His mother’s sister’s children Elizabeth, Joel, and Easley Waggoner had grown up in the Dallas upper class and were members of the most exclusive white social clubs in the city. They introduced Harold to Mattie Caruth, who was friends with Joel (Byrd Reference Byrd1978: 49; Galloway Reference Galloway1996). On his father’s side, he was publicly acknowledged as the cousin of two “nationally prominent figures,” US Senator and Virginia Governor Harry Flood Byrd and Arctic explorer Richard Evelyn Byrd.Footnote 13 Even his mother-in-law Earle Caruth, who “was not the least bit charmed by him,” admitted that “there was nothing really wrong with Byrd’s family” (Sanders Reference Sanders1988: 159). In multiple senses, then, Harold was not “new” to money or to the upper class. And though Will Caruth may have starved his cows, the Caruths today are worth billions. Mattie and Harold’s two sons, Harold Jr. (1937–2021) and Caruth (1941–2010), inherited from both parents. This is the truth of Dallas’s new money myth: “new money” was rarely new, “old money” rarely fell far, and they all married each other anyway.
Discussion and conclusion
In sum, the old-to-new money turnover narrative in Dallas was supported by the data in a few ways, in that the oil industry began to generate far more profits than the cotton industry (Figure 1), the upper class featured more oilmen and fewer cotton men over the course of the oil boom (Figure 2), and oil families replaced cotton families in several of the city’s most expensive and prestigious mansions (Figure 10). But the upper-class data contradict the old-to-new money turnover narrative by showing that that cotton families persisted in the upper class at higher rates than other families through the oil boom (Figure 4), cotton men were born into the Dallas upper class at slightly lower rates than oilmen, and the upper class overall (Figure 5), and both oilmen and cotton men were mostly born rich, and rarely born poor (Figure 6). Even the wealthy oilmen excluded from the upper class were rarely born poor (Figure 7), and oilmen in general were included in the upper class at especially high rates relative to other wealthy men (Figure 8). And finally, industries spread and intermingled across the entire upper-class kinship network, such that cotton and oilmen were increasingly interrelated; by 1942 the average upper-class person had an oilman at about the family distance of a brother-in-law (Figure 9).
I offered a generalized explanation for these findings by introducing the concept of “prototypical elites.” I have suggested that prototypical elites across settings are characterized by publicly colossal fortunes tied to regionally specific industries. Upper-class worlds are constitutionally hierarchical in at least two senses: (a) they are defined by their position at the top of various resource hierarchies, and (b) within the upper class, there are still further, increasingly steep internal hierarchies (Hecht Reference Hecht2017; Khan Reference Khan, Morgan, Hirsch and Quack2015). Wealth and income in capitalist economies generally have exponential distributions. Upper classes are concentrated in the tails of those distributions, where the wealth and income gaps grow increasingly large. The hugeness of prototypical elites’ fortunes, and their ties to regionally specific industries, may together help explain the prevalence of the old-to-new money churn narrative. Fortunes amassed in booming industries by individual tycoons tend to be both larger and more volatile than family fortunes spread amongst multiple people and invested across multiple industries (Korom et al. Reference Korom, Lutter and Beckert2017). That means that extreme tails of wealth distributions, where prototypical elites tend to be located, may be characterized by more churn than upper-class populations overall.
The standard narrative of industry and family in high society worlds – in which new industries and newly wealthy families co-emerge, toppling resistant old industries and families – is a folk model of socioeconomic change at the top of the class distribution. This folk model assumes that fortunes from economic booms primarily accrue to strivers from the lower and middle classes: “brilliant individuals who climbed to the top of the wealth pyramid thanks to their exceptional skills” (Alfani Reference Alfani2023: 88). But the kind of person most structurally able to profit from an economic boom is a person born to considerable wealth, status, and power. The brouhaha about vulgar rags-to-riches “oil people” was, at best, an exaggeration. It was an exaggeration that bolstered the legitimacy of supposedly meritocratic or “open” elite, and that served the interests of businessmen who wanted to portray Dallas wealth as clean and new.
Even though the narrative about new oil and old cotton money did not correspond to the actual distribution of class backgrounds within industries (see Figure 3), it did correspond to a material and symbolic shift among the upper echelons of the upper class (see Figures 9 and 10). I illustrate this idea in Figure 11, which compares the new money myth (rags-to-riches new money replaces impoverished old money) to my alternate explanation (churn among prototypical elites). The decline of the cotton industry and the rise of the oil industry fueled regime change among tycoons, challenged established narratives about the basis of regional wealth, and bolstered efforts to market Dallas to investors outside the South. The prototypical wealthy Texan was no longer an aristocratic cotton baron: he was a cowboy-hatted, new money oilman. That image persists today.
Two conceptual models of upper-class mobility during major socioeconomic shifts.

Upper-class people, then, may tend to “see like a rich list:” focusing on turnover among prototypical elites rather than patterns of persistence among the upper class more broadly. So does any quantitative study focused on ultra-wealthy individuals outside the context of their interconnected upper-class communities. Lists of elite individuals are easier to compile than upper-class kinship networks. They yield essential insights about the shifting characteristics of people with extreme wealth and in visible positions of power. But they are poor descriptors of elite mobility patterns within the context of a full population, and they cannot describe the actual relational worlds elites are embedded in. Estimating rates of elite turnover by looking at the very top fortunes – the richest people in a country, or the world – overemphasizes mobility, and underemphasizes persistence. Clint Murchison, the man whose example began this article, was not related to anyone else on the Fortune list, but he was connected to a deep, sprawling kin network of upper-class people across Dallas and East Texas. In other words, being “new” to the list of the richest people in the world is not the same as being “new” to wealth. Multidimensional data that capture the kin networks, social networks, wealth sources, and other characteristics of upper-class communities can better describe the way resources actually move and persist within elite populations over time.
The cultural import of the new money myth extends to the present day. Consider the popular contemporary HBO show The Gilded Age, which purportedly tells the story of the famed new-versus-old money clash in New York City during the late nineteenth century. The plot is based on the legendary fight between “the most culturally dominant person in Gilded Age New York,” old money Caroline Schermerhorn Astor (1830–1908), and supposedly new money Alva Smith Vanderbilt (1853–1933) (Khan Reference Khan, Méndez, Savage and Lareau2026: 154). Tellingly, the HBO version includes Caroline Astor as a named character, but cooks up a replacement for the Vanderbilts – the fictional “Russells.” The Russells fit the new money stereotype exactly; they are ruthless social strivers who ascended to great wealth from poverty. Why include Caroline Astor as a named character, while inventing a replacement for Alva? Likely because the real-life Alva Vanderbilt was decidedly not new to wealth or status, and neither was her husband. Alva, like her rival Caroline, came from a family that had been upper class for generations; she even boasted multiple kin and social ties to the European aristocracy. Alva’s husband William Vanderbilt, like Carrie’s husband William Astor, was the son of a son of a genuinely upwardly mobile tycoon. And just seventeen years after their clash, Caroline’s grandson married Alva’s brother-in-law’s niece, ultimately combining chunks of both their fortunes.Footnote 14 The impulse to invent truly upwardly mobile characters in the Russells illustrates the general cultural drive to shore up the great American meritocracy myth.
The most portable concept from this article is the concept of prototypical elites, which could be a useful concept for research across settings. They seem to play an outsized role in folk understandings of persistence and change among the rich and powerful. But as I have demonstrated, they are not necessarily stand-ins for the 1 percent as a whole. To what extent do various upper-class populations have identifiable prototypical members? How do prototypical elites compare to the family and social networks they are variously embedded in? What factors contribute to changes in elite prototypicality, and what are the consequences, if any, of those changes? This line of investigation would be part of a larger effort to see the ultra-rich and powerful in their fuller family contexts.
I suspect that many other reported clashes between new and old money reflect a shift in the local prototypical elite rather than broader patterns of upper-class mobility. It is difficult to say for sure because data contextualizing tycoons within upper-class family networks are rare and time-intensive to compile. Consistent findings of elite persistence in multiple historical cases, even where elites describe a near-total turnover, suggest that this may be true. Moreover, many such narratives do align with a shift in the prototypical regional elite: in Gilded Age New York, for example, from a Knickerbocker merchant to a railroad baron; in post-Soviet Russia, from a powerful government official to a new money entrepreneur. High-profile, anecdotal cases often neatly illustrate the new and old money story at the level of Aristotelian cognitive typification (Monk Reference Monk2022). They illustrate very real symbolic struggles within elite classes. They reflect the way elites describe their worlds, but they do not reflect the full reality of who elites are, who they marry, and who makes money in ascendant industries.
The finding that class origins differed more by gender than by industry, and that upper-class cotton and oil wives were slightly more likely to have been born poor or middle class than their husbands, points to the need for more work on women’s mobility into the upper class. In this empirical context, the gendered difference is striking particularly because it directly contradicts the way elites themselves described their backgrounds. Throughout this time period and across industries, elite obituaries, memoirs, and family histories generally characterized men as having “earned” their exalted position through hard work and genius, and women as having inherited it. More precisely, the elite life histories of men tended to emphasize that they started off as a messenger boy or an oil roughneck or a cotton picker and then clawed their way up the class ladder through sheer gumption.Footnote 15 Elite women, on the other hand, tended to join as many ancestry societies as possible, and their obituaries regularly mentioned that they were descended from kings – or at least a notable Confederate general. Even though oil and cotton wives were moderately more likely than their husbands to have been born poor, I have never found a single instance of a Dallas high society woman in this era publicly claiming she grew up anything but upper class.
Upper-class white women did not say they accumulated wealth through their own hard work, because they were not supposed to work for pay at all; indeed, not working for pay was a symbol of their families’ upper-class status, and working for pay in almost any job was a potential embarrassment. Even today, the white upper class of the US is characterized by the same gendered division of labor. At the top of the wealth distribution, men overwhelmingly draw large incomes from prestigious jobs, and women spend their days doing unpaid charity and relational labor (Kendall Reference Kendall2002; Yavorsky et al. Reference Yavorsky, Keister, Qian and Thébaud2023). Independently wealthy women, like those listed in the Forbes 400, have always been overwhelmingly heirs (Ischinsky and Tisch Reference Ischinsky and Tisch2023), rather than people who accumulated fortunes in their lifetimes – so much so that Edlund and Kopczuk (Reference Edlund and Kopczuk2009) used the proportion of women among the ultra-wealthy as a measure of the relative prevalence of dynastic wealth (Khan Reference Khan, Morgan, Hirsch and Quack2015). For white women in the United States, the most populated pathway into upper-class adulthood has long been some combination of inheritance and marriage. And for white women born outside the upper class, that leaves marriage. But no upper-class woman wanted to look like a “gold digger,” a woman who acquired money and status solely through her husband (Donovan Reference Donovan2020). A systematic analysis of all women who married their way to wealth is beyond the scope of this article, but it can and should be done, for Dallas and for other upper-class worlds.
The shift from cotton to oil in Texas was not only a symbolic shift of prototypical elites, of course – it was a massive economic, political, and social change. Cotton, inextricably entangled with enslavement, drove the expansion of rich white settlers into Texas, and fundamentally shaped the development of the global capitalist system (Beckert Reference Beckert2014). The subsequent explosion of oil similarly warped the globe up to the present day. It shifted the balance of power across industries and regions, twisted politics at every level, devastated the land and the climate, and played a key role in the Allied victory in World War II (McFarlane Reference McFarlane2017). It not only launched a few Dallas men onto the lists of the richest people in the world; it brought the Texas elite into the national limelight in a way it never had been before, generating new opportunities for investments, business deals, and political positions. From a more macro perspective, it does not matter enormously whether the 1930s oil boom millionaires were born rich or poor. But pretending that the stratospheric profits of emerging industries are primarily distributed to worthy strivers across class backgrounds is to pretend that the American Dream is alive and well. It isn’t, and it never was.
Indeed, the assumption that newly wealthy families and wealth from booming industries are coterminous may be so common precisely because it supports the rags-to-riches stories that have shored up the meritocracy myth since at least the Gilded Age. If profits from emerging industries overwhelmingly flow to “new” families, and if high society in general is best characterized by a struggle between those families and “old” ones, maybe any family has a real shot at becoming fabulously rich. For believers in the ideal or reality of meritocracy, this is a more appealing characterization of elites than would be a statistically realistic assessment of the overwhelming multigenerational continuity of wealth, status, and power. In any case, the evidence presented here demonstrates that widespread stories about new and old money should not be taken at face value. From the perspective of US upper class, the rich Texan has been archetypally a New Boy for at least a century. In reality, Texan wealth has always been like wealth anywhere else in the country: disproportionately amassed by the rich white children of rich white parents.
Supplementary material
The supplementary material for this article can be found at https://doi.org/10.1017/ssh.2026.10142
Acknowledgments
This is the first academic article I ever wrote, and I have been working on it periodically since my second year of graduate school. I am immensely grateful to the many people who have helped me improve it across nearly a decade of scattered revisions. I would like to particularly thank Dalton Conely, Estela B. Diaz, Paul DiMaggio, Shamus Khan, Ellis Monk, Doron Shiffer-Sebba, Paul Starr, Viviana Zelizer, two anonymous reviewers, and the editors for their written comments. I am also indebted to audiences at the annual meetings of the Eastern Sociological Association, the American Sociological Association, and the Social Science History Association, as well as commentors at the Inequality and the Environment Symposium at SciencesPo, the Princeton Prize Fellowship in the Social Sciences, the Princeton Sociology Department, the Center for the Study of Social Organization at Princeton, the Religion and Public Life Seminar at Princeton, the Gender and Elites Workshop at Oxford University, and the Portal to Texas History Fellowship Seminar Series at the University of North Texas, and finally, to Kennedy Primus for invaluable research assistance.