Introduction
Aggregation of insect larvae is a common phenomenon that confers advantages on the constituent individuals (Denno and Benrey Reference Denno and Benrey1997; Parrish and Edelstein-Keshet Reference Parrish and Edelstein-Keshet1999) and so can be termed an Allee effect (i.e., individuals of many species may benefit from the presence of conspecifics, Stephens et al. Reference Stephens, Sutherland and Freckleton1999). Fly larvae from a number of families form such aggregations in a range of food substrates including mushrooms (Jaenike and James Reference Jaenike and James1991; Heard Reference Heard1998), fallen fruit (Atkinson Reference Atkinson1985), and in aquatic situations (Wotton Reference Wotton1992). Perhaps most interest in dense, feeding cohorts has been focussed upon those associated with carrion, in particular larvae of necrophagous blow flies (Diptera: Calliphoridae) (Charabidze et al. Reference Charabidze, Bourel and Gosset2011; Heaton et al. Reference Heaton, Moffatt and Simmons2014; Johnson and Wallman Reference Johnson and Wallman2014). Perhaps gregarious behaviour observed in aggregations benefits individuals in a cohort by ensuring sufficient proteolytic enzymes are secreted over a large surface area, facilitating liquefaction of the food substrate and maximising larval feeding efficiency (Goodbrod and Goff Reference Goodbrod and Goff1990; Green et al. Reference Green, Simmonds and Blaney2003; Rivers et al. Reference Rivers, Thompson and Brogan2011).
While the knowledge of larval aggregations is far from recent (Deonier Reference Deonier1940), basic questions about “maggot masses” have not been sufficiently addressed. We do not know, for example, whether all individuals within a mass exhibit the same behaviour. Is a consequence of larval aggregation a faster rate of development as a result of an increased temperature (Johnson and Wallman Reference Johnson and Wallman2014)? Research on blow flies has shown that larval aggregations generate heat significantly higher than ambient (Deonier Reference Deonier1940; Richards and Goff Reference Richards and Goff1997; Slone and Gruner Reference Slone and Gruner2007; Richards et al. Reference Richards, Price and Villet2009) and that the rise in temperature is proportional to the size of the aggregation (Charabidze et al. Reference Charabidze, Bourel and Gosset2011; Heaton et al. Reference Heaton, Moffatt and Simmons2014, Johnson and Wallman Reference Johnson and Wallman2014). However, in some cases, the resulting temperatures in large aggregations can exceed what is thought to be the lethal limit, causing the occasional larva to perish (Slone and Gruner Reference Slone and Gruner2007; Kelly et al. Reference Kelly, van der Linde and Anderson2009). Because most individuals survive and go on to complete development at such high temperatures, they must somehow regulate their temperature to avoid overheating. Thermal imaging reveals that aggregations are not a uniform temperature and thermal gradients are known to occur in sufficiently large aggregations (Heaton et al. Reference Heaton, Moffatt and Simmons2014; Johnson et al. Reference Johnson, Wighton and Wallman2014).
Many anecdotal reports describe blow fly larvae appearing to circulate within an aggregation between the hot centre and the cooler periphery, and that larvae will select an optimum position for development when presented with a temperature gradient (Catts Reference Catts1992; Byrd and Butler Reference Byrd and Butler1996; Ames and Turner Reference Ames and Turner2003; Slone and Gruner Reference Slone and Gruner2007; Charabidze et al. Reference Charabidze, Bourel and Gosset2011; Hückesfeld et al. Reference Hückesfeld, Niederegger, Schlegel, Heinzel and Spiess2011; Rivers et al. Reference Rivers, Thompson and Brogan2011). It seems plausible that circulating larvae are regulating their temperature by alternating between locations where temperatures are above and below optimum, that is, at the centre and the periphery of a maggot mass. However, it is almost impossible to keep track of a larva in a mass, as they are practically identical and move continuously, so anecdotal reports are unreliable.
The literature does not contain any quantitative investigation of larval circulatory movement in flies save for that of Johnson et al. (Reference Johnson, Wighton and Wallman2014), which reported that larvae of Chrysomya rufifacies (Macquart) and Calliphora vicina (Robineau-Desvoidy) spent 60% of their time within 1 °C of the maximum temperature of the aggregation. However, this figure was based upon monitoring only one individual in each maggot mass, and importantly, no indication of the variation around this figure is given. The authors acknowledged issues with their experimental design, which limited the quality and quantity of data they were able to collect. Most notable was the fact that aggregations were continually divided by cling film, and were repeatedly separated to enable visualisation of the tagged larvae, so causing repeated disturbance. Moreover, the tagged (by food dye) individual had spent more than a day away from its parent mass before it was reintroduced, before data collection. Time spent away from the aggregation may have altered the foraging behaviour of the larva or negatively impacted on its feeding and development. Further quantitative data are called for, by a less disruptive, more realistic approach, though this presents its own challenges as demonstrated by the shortage of such studies in the literature.
Recent advances in the technology of tagging animals have presented further possibilities for investigating larval movement more quantitatively. Boulay et al. (Reference Boulay, Deneubourg, Hédouin and Charabidzé2016) investigated collective decision making in two species of forensically important blow fly, Lucilia sericata (Meigen) and Calliphora vomitoria (Linnaeus). In their paper they describe the use of a novel tagging method for blow fly larvae, which allowed them to differentiate between species in heterospecific experiments. Using a cyanoacrylate glue that fluoresces under ultraviolet light, they were able to apply a visible mark externally to the anterior region of the dorsal surface. It is possible that such a marking might have impeded larval movement. However, the authors reported that this was not the case and tagged larvae were observed to behave as normal. It should also be noted that to limit heat generation within the mass, aggregations were composed of just 40 individuals (Boulay et al. Reference Boulay, Deneubourg, Hédouin and Charabidzé2016). Whilst contributing to our understanding of larval movement, their research focussed on the movement of individuals across a surface, rather than the more realistic case of an aggregation with an identifiable centre and periphery. Another technique for tagging larvae was proposed by Rosati et al. (Reference Rosati, Robinson and Devine2015) who describe marking larvae with fluorescent fingerprint powders, either by ingestion or applying topically. Whilst their results show potential, it should be noted that larvae were not monitored whilst in an aggregation, which could have consequences for the topically applied powders given the nature of the mass.
The aim of the study presented herein was to quantify the movement of individual larvae within aggregations of the blow fly L. sericata using a relatively new tagging technique, and therefore, generate scientifically robust, replicated data. Visible implant elastomer has been successfully used to tag blow fly larvae such that individuals could be tracked within an aggregation in real time (Moffatt Reference Moffatt2013). Visible implant elastomer is a brightly coloured, biocompatible elastomer material, which when injected into translucent animal tissues, cures to form a gelatinous internal tag. Using this technique, blow fly larvae were tagged without impediment to subsequent development in the 80% of larvae that survived the process (Moffatt Reference Moffatt2013). For this research several visible-implant-elastomer-tagged individuals were observed for each mass, after having spent only a short time away from it. Thus, it was intended that the data collected would give a more complete picture of the actual situation than had been published previously.
Materials and methods
Adult L. sericata were housed in cages that were kept in a walk-in incubator. Conditions inside the incubator were maintained at a constant 22 °C with a relative humidity of around 60% and a 16:8 hour (light:dark) light regime. Adults were provided with a constant supply of water and sugar, augmented by pork liver to provide the necessary nutrients for gonad development.
Before setting up each replicate, further pork liver was introduced into fly cages as an oviposition medium for two to three hours, during which time a sufficient quantity of eggs had been laid. Eggs remained in the same conditions for ~24 hours until first instars began hatching. Of these recently eclosed larvae, 500 were transferred to 200 g of pork muscle, which was cut to dimensions of 100×90×25 mm. Care was taken to ensure the feeding substrate contained no bone and minimal fatty tissue. Earlier trials had shown this larva:meat ratio was most suitable, being dense enough to promote the formation of a mass without being so large that tagged larvae would be easily lost within the aggregation. For five aggregations, observations were recorded regarding the shape, size, and position of the mass in relation to the feeding substrate. Measurements were taken for maximum and minimum mass diameter, as well as depth, using a Mitutoyo Absolute Digimatic Calliper (Mitutoyo, Hampshire, United Kingdom) 0–200 mm (accuracy±0.02 mm). All aggregations were circular or slightly oval in shape with diameters ranging from 55 to 70 mm and a depth of ~15–20 mm, or 2–3 larvae deep. Aggregations were often observed to position themselves on two faces of the substrate at any one time, with part of the mass feeding on a vertical face and spreading upwards onto the horizontal, or top, surface of the meat. However, it needs to be stressed that these are generalised measurements for aggregations composed of early third instars. Constant larval movement resulted in slight variations in mass shape and position during the course of the experiment, whilst dimensions such as diameter and depth were expected to increase over time as larvae continued to feed and develop.
The meat and the larvae were held in a plastic container, which measured 270×270×160 mm. The bottom of the container was lined with paper towel to absorb any excess moisture that might result from decomposition and liquefaction of the meat. To ensure the container was well ventilated, a panel (50×100 mm) was removed from the lid and fine netting was secured in its place to prevent larval escape. The lid was removed during data collection so the mass could be properly viewed. The process was repeated to produce 15 replicates.
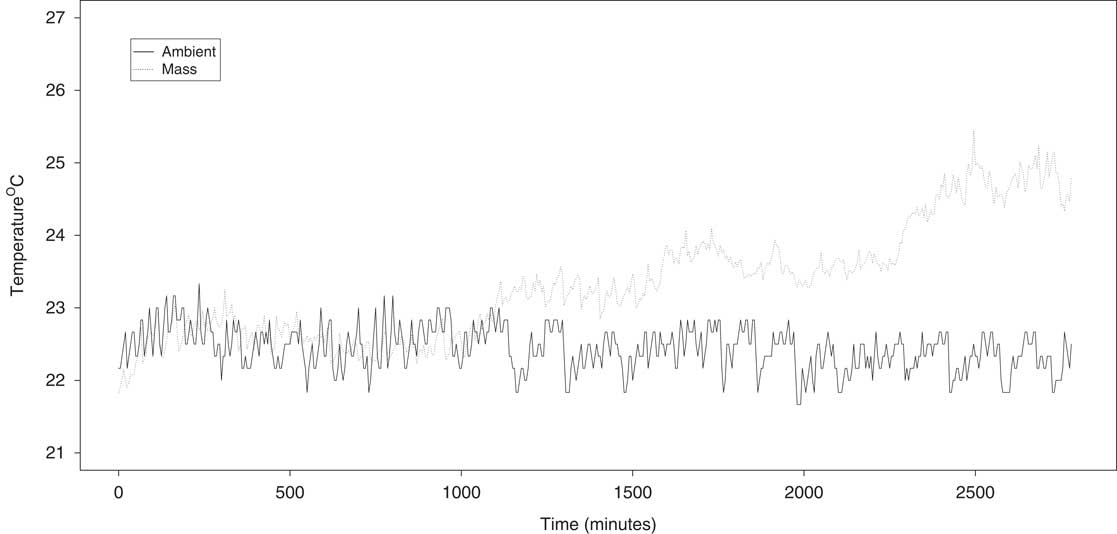
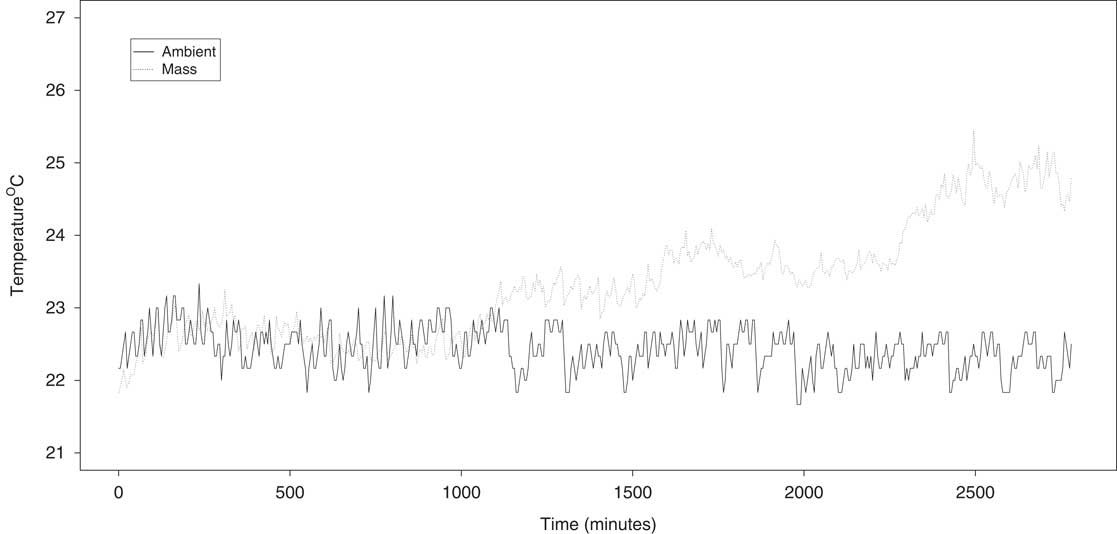
During the trails, three randomly selected aggregations had their surface temperatures recorded at regular five-minute intervals using a FLIR T425 thermal imaging camera (FLIR Systems, Kent, United Kingdom). Data collection commenced at the start of second instar, which permitted time for the larvae to amass, and ceased once larvae began to disperse away from the aggregation. Surface temperatures were recorded instead of internal temperatures as the repeated insertion of a thermometer or temperature probe caused to the larvae to be disturbed and the aggregation to temporarily disperse. Temperature data showed that a typical mass of this size reared under these conditions generated mean surface temperatures of 23.3 °C (standard deviation=0.94), peaking during third instar at ~26 °C (Fig. 1). This was deemed an appropriate temperature range for this experiment as it falls several degrees below the temperatures suspected of triggering stress-induced behaviours, meaning that any circulatory movement observed in the aggregation is not solely attributed to thermoregulation.
Mean surface temperature of the mass (°C) versus time (minutes) for aggregations containing 500 larvae and reared at a constant ambient temperature of 22 °C. Temperatures recorded from the start of second instar.
Tagging larvae
Through regular observation of the developing larvae, the time when more than half of an aggregation had reached third instar was identified, whereupon four individuals were randomly selected and removed. These larvae were injected with visible implant elastomer (Northwest Marine Technology, Anacortes Washington, United States of America) in the 11th segment, dorsally in the midline between two tissue masses (Moffatt Reference Moffatt2013). Each of the four was injected with a different fluorescent colour, which under ultraviolet (black) light makes it easier to see the tag. Once tagged, the four larvae were then placed on a separate piece of pork muscle for around 30 minutes to verify they had survived the tagging procedure unaffected, before being returned to their original mass. From an hour after this, aggregations were observed every 10 minutes for four hours, and each of the four-tagged larvae recorded as being visible and therefore at the periphery, or not visible and so within the mass. Thus data comprised counts of a maximum of 25, which were converted to proportions of observations at the periphery.
Statistical analysis
A generalised linear mixed-effects model (GLMM) using a logit link for binary data, took into account that observations were repeated on the same larvae in different masses, and was used to establish whether there were differences between masses, and differences between larvae in the same masses in terms of time spent at the periphery. The model captured the structure of the data; repeated observations on the same individuals clustered within masses, the significance of each being tested by deletion and comparison using the χ2 statistic. The intraclass correlation coefficient allowed a simple comparison between mass and maggot in terms of the variation they explained. A new variable indicating whether the position of a larva had changed (from visible to not visible or vice versa) between observations also constituted binary data, so was analysed in the same way. While 10 minutes was an arbitrary interval, and speed of circulation cannot be deduced from these observations, this new variable does reflect something of how active the larvae were. Data were analysed using the statistical package R (R Core Development Team 2015) using the lme4 package (Bates et al. Reference Bates, Maechler, Bolker and Walker2015). It should also be noted that whilst the term “centre” is used throughout the results section for ease of interpretation, the exact location of tagged larvae not visible at the periphery cannot be confirmed. Whilst some larvae would indeed have been feeding at the centre, others may have been moving through the aggregation but out of sight.
Results
Larvae tagged with visible implant elastomer were quickly and easily identified within the aggregation, facilitated by the momentary use of black light. The proportions of time spent at the periphery of the aggregation had an approximately normal distribution for all tagged larvae en masse and Grubb’s test identified an outlier (G=3.37, n=60, P=0.012), which was removed from analyses. This atypical larva was observed moving particularly slowly, and spent considerably longer at the periphery than all others. It is possible that this individual was injured during the tagging process though had appeared unaffected immediately afterwards.
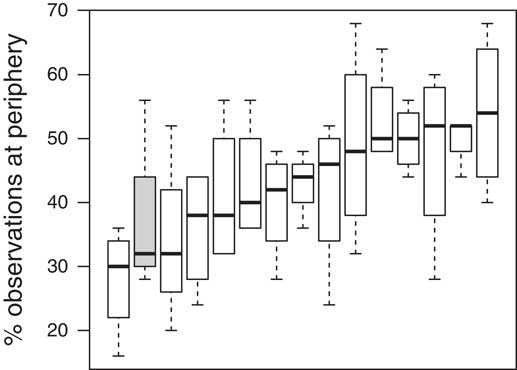
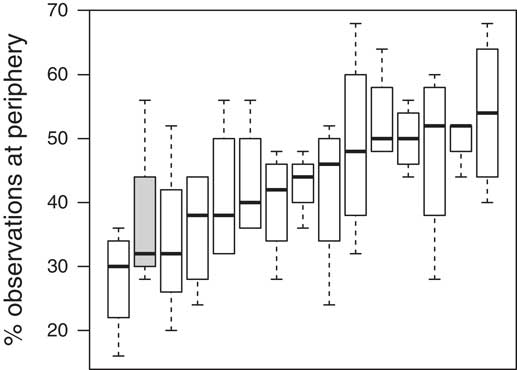
The proportions of time that larvae spent at the periphery are shown as a box and whisker plot for each aggregation in Figure 2, where the wide variation between larvae and aggregations can be clearly seen. Mixed-effects models showed that differences among larvae within aggregations were significant (χ2=78.4, df=58, P=0.038), but that differences among aggregations were also significant (χ2=25.6, df=14, P=0.029); an aggregation influenced the larvae within it, but individual larval variation was still evident. The percentage of time individuals spent at the periphery ranged from 16% to 68% (mean=43%), and within the same aggregation the largest difference between larvae was 32% and 68%. The lowest variation was only 8% with a median of 52%. The intraclass correlation coefficients for aggregation and maggot were 0.040 (61%) and 0.026 (39%), respectively; differences amongst aggregations explained more of the variation than differences amongst maggots.
Box and whisker plot showing the percentage of observations tagged larvae spent at the periphery in each of the 15 experimental aggregations, arranged in order of median values for each mass to facilitate interpretation. Each aggregation had 500 larvae, four of which were tagged, but the one shaded is based upon three of these (aggregation containing the outlier).
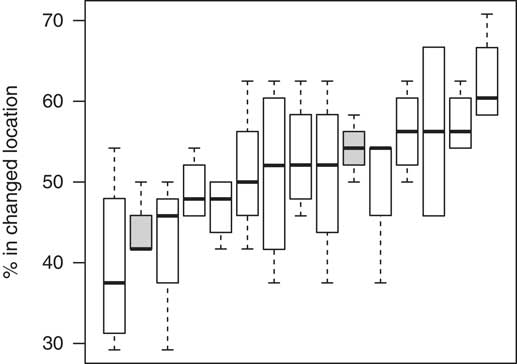
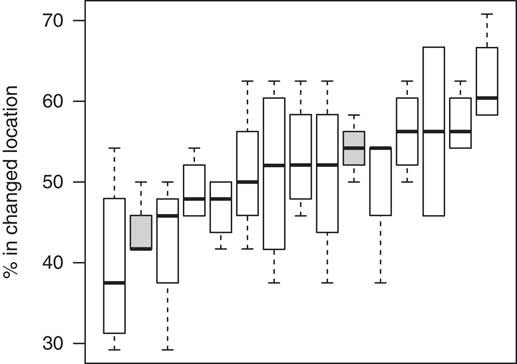
All larvae appeared to be in a state of continuous movement in all aggregations. In fact, 49% of all observations showed a different location on subsequent observations. The 95% confidence interval for the location of the population mean, produced from a GLMM model, was between 47.6% and 50.5% (asymmetry is expected). This is a long way from 0%; the value at which no rotation occurs; clear evidence for the rotation of larvae. There were no differences either among larvae within aggregations (χ2=44.1, df=57, P=0.89) or among aggregations (χ2=17.9, df=14, P=0.21) for this “change metric”, although the actual percentage varied from 29% to 71% as illustrated in Figure 3. The intraclass correlation coefficients showed that practically all variation was explained by the aggregation relative to maggots within aggregations; the aggregation influenced the likelihood of change between observations. A single additional outlier (Grubb’s test: G=3.81, n=59, P=0.001) was identified and removed from this analysis, as it rotated atypically quickly.
Box and whisker plot for the 15 experimental aggregations (n=500) showing the percentage of observations where tagged larvae (n=4) were observed in a different location (periphery or centre) to the previous observation recorded 10 minutes earlier. Data are arranged in order of median values for each mass to facilitate interpretation. Each aggregation had 500 larvae, four of which were tagged, but the ones shaded are based upon three following the removal of an outlier.
Discussion
Blow fly larvae continually rotate between the periphery and the centre of a larval aggregation at a rate influenced by the collective more than the individual. This continual motion may be in response to their immediate environment (Charabidze et al. Reference Charabidze, Bourel, Leblanc, Hedouin and Gosset2008; Boulay et al. Reference Boulay, Betremieux, Hédouin and Charabidzé2015) for which there are a number of possible explanations including thermoregulation, foraging behaviour and avoidance of hypoxic conditions.
It has been suggested on numerous occasions that larvae feeding in aggregations are capable of regulating their temperatures to avoid overheating (Catts Reference Catts1992; Ames and Turner Reference Ames and Turner2003; Slone and Gruner Reference Slone and Gruner2007; Sharanowski et al. Reference Sharanowski, Walker and Anderson2008; Kelly et al. Reference Kelly, van der Linde and Anderson2009; Amendt et al. Reference Amendt, Richards, Campobasso, Zehner and Hall2011; Charabidze et al. Reference Charabidze, Bourel and Gosset2011; Hückesfeld et al. Reference Hückesfeld, Niederegger, Schlegel, Heinzel and Spiess2011). When confronted with a temperature step, blow fly larvae exhibit reflex-like evasive behaviour, retracting their anterior segments and moving away from unfavourable temperatures (Hückesfeld et al. Reference Hückesfeld, Niederegger, Schlegel, Heinzel and Spiess2011). This thermophobic behaviour may also manifest inside an aggregation, directing larvae away from the hot centre and out towards the cooler periphery where they experience evaporative cooling (Catts Reference Catts1992; Ames and Turner Reference Ames and Turner2003; Slone and Gruner Reference Slone and Gruner2007; Charabidze et al. Reference Charabidze, Bourel and Gosset2011; Hückesfeld et al. Reference Hückesfeld, Niederegger, Schlegel, Heinzel and Spiess2011; Rivers et al. Reference Rivers, Thompson and Brogan2011). However, as the aggregations studied in this experiment contained only 500 larvae, it is questionable that any circulation observed was a result of individuals regulating their temperature to avoid potentially harmful overheating. Aggregations of this size are not expected to generate temperatures exceeding 26–27 °C (Heaton et al. Reference Heaton, Moffatt and Simmons2014), several degrees cooler than the proposed stress-inducing temperatures of 50 °C recorded in large aggregations (Richards and Goff Reference Richards and Goff1997; Slone and Gruner Reference Slone and Gruner2007). In smaller aggregations, it may be more reasonable to assume that circulatory behaviour is a result of larvae re-positioning themselves along a thermal gradient for optimal development and not stress relief (Catts Reference Catts1992; Byrd and Butler Reference Byrd and Butler1996; Ames and Turner Reference Ames and Turner2003; Slone and Gruner Reference Slone and Gruner2007; Charabidze et al. Reference Charabidze, Bourel and Gosset2011; Hückesfeld et al. Reference Hückesfeld, Niederegger, Schlegel, Heinzel and Spiess2011; Rivers et al. Reference Rivers, Thompson and Brogan2011), or an innate behaviour better suited to larger aggregations, which are more common in real situations (Vasconcelos et al. Reference Vasconcelos, Soares and Costa2014; Moffatt et al. Reference Moffatt, Heaton and de Haan2015).
Blow fly larvae do not feed continually but regulate their foraging behaviour (Charabidze et al. Reference Charabidze, Bourel and Gosset2011, Reference Charabidze, Hedouin and Gosset2013), where individuals move out to the periphery to search for new feeding sites. It is this which creates the familiar rolling turnover. Larvae feeding in an aggregation might also experience periods of little (hypoxia) or no (anoxia) oxygen, especially if the aggregation is dense or partially submerged in decompositional fluids. Carrion is a hypoxic microhabitat (Hoback and Stanley Reference Hoback and Stanley2001), where larvae and bacteria remove oxygen from the surrounding air. Larval hypoxia could therefore contribute to mass rotation, with individuals moving away from the hypoxic centre to areas at the periphery where oxygen is at greater concentrations (Hoback and Stanley Reference Hoback and Stanley2001). However, whilst this might influence the behaviour of larvae in large masses composed of thousands of individuals, it is unlikely to be an issue in smaller aggregations, similar to those used in this research. It seems likely that circulation of larvae is influenced by all of thermoregulation, foraging behaviour and oxygen requirements, and their relative importance may be related to the size and shape of an aggregation.
The large variation seen in the proportion of time spent at the periphery may be a consequence of the shape of an aggregation. In an aggregation that is relatively flat, the surface area: volume ratio is large and the distance to the periphery is always short, causing the aggregation to lose heat faster (Contreras Reference Contreras1984). In such an aggregation, when a larva is not feeding, it is likely to be visible at the periphery. In an aggregation, which is closer to spherical, the surface area: volume ratio is relatively low and a larva is less likely to be visible at the periphery if not feeding. A better quantification of larval activity would take into account the surface area: volume, but its measurement is extremely difficult, not least because the aggregation is continually moving and changing shape. Whilst all the aggregations monitored in this research were circular in shape, they did vary slightly in diameter and depth. However, it seems unlikely that a difference in depth of up to 5 mm would account for the significant differences observed between larvae and the proportion of time they spent at the periphery.
If differences between aggregations can be explained, at least in part, by the shape of the aggregation, then differences between larvae in the same aggregation must be accounted for in different ways. Whilst some larvae appear to divide their time evenly between the centre and the periphery, significant deviation from this was also evident. If it can be inferred that this variation also extends to the time spent feeding, then it seems likely that the movement in an aggregation is an explanation for differences in development rate of the insects therein. It seems plausible that this is the result, at least in part, of intraspecific competition (Ullyett Reference Ullyett1950; Smith and Wall Reference Smith and Wall1997). Further work needs to be done to establish whether intraspecific competition does indeed drive this phenomenon, and further to establish whether the limited resource is temperature, food, oxygen, or some other requirement.
The results of this study imply that all larvae circulate between the periphery and the centre of the aggregation at a similar rate. However, there are a number of factors related to the tagging procedure and sampling techniques used that could have influenced these findings and should be taken into consideration. It is plausible that some larvae may have been injured during the tagging operation, though did not appear so in the period immediately afterwards. Tagged insects exude a liquid from the entry point of the syringe needle, which makes all appear damaged initially (Moffatt Reference Moffatt2013). Injury may have reduced the ability of the larvae to locomote to some degree, and so modified their movements within the aggregation. The timing of observations might also have influenced the results. If larval rotation is indeed cyclic, as the results of this study suggest, then there is a slight risk that the observations made at regular intervals may have been synchronised with the rate of rotation of some larvae. Further research using similar methods may benefit from continuous observation of at least some aggregations.
Conclusion
This research has provided quantitative, scientifically robust evidence for an often-stated assertion that has so far lacked evidence. Larvae are in a constant state of motion as they circulate between the centre of the aggregation and its periphery. The proportion of time larvae spend at the periphery varies significantly between individuals as well as aggregations, and whilst some larvae appeared to rotate between the two locations faster than others, no significant differences were recorded in this respect. With the development of new tagging techniques, such a visible implant elastomer, there is now potential to collect quantifiable data, which will contribute to further understanding the phenomenon of larval aggregations.
Acknowledgements
Thanks are extended to the anonymous reviewers who made useful and relevant comments on the original submission and who markedly improved the paper. Any errors remaining are our own.