‘A central problem of representative democracy is how to ensure that policy decisions are responsive to the interests or preferences of citizens. The US Constitution deals with the electoral side of this problem by constructing institutional safeguards and incentive structures designed to make elected representatives responsive to citizens. But making policy involves more than decisions by elected legislators and the president.’
McCubbins, Noll and Weingast, ‘Administrative Procedures’, p. 243Footnote 1
‘The most dangerous of all sinister interests is that of the executive Government, because it is the most powerful. It is perfectly possible – it has happened and will happen again – that the Cabinet, being very powerful in the Commons, may inflict minor measures on the nation which the nation did not like, but which it did not understand enough to forbid.’
Bagehot, The English Constitution, pp. 108–9Footnote 2
The responsiveness of government to the preferences of its citizens is considered to be an important indicator of the performance of advanced democracy.Footnote 3 Some go so far as to claim ‘responsiveness is what democracy is supposed to be about’.Footnote 4 The open interplay of policy and public opinion is – at least – an important characteristic of any democratic system of government.Footnote 5 There are numerous studies of democratic responsiveness,Footnote 6 most from the United States, but few consider how this relates to the outputs of bureaucratic systems nor, moreover, its relationship to problems of political control.Footnote 7 Where scholars consider the responsiveness of bureaucratic agents to elected principals as a feature of democratic governmentFootnote 8 – finding evidence that agencies respond to partisan conditions and events – this is premised upon a hierarchical conception of responsiveness to public opinion. That starts at the elected tier of the democratic system and then decays with bureaucratic mutations of legislative and executive intent.
If models of responsiveness are premised upon maximization of aggregate utility, where ‘the public’ are electoral consumers of the sum of rights, protections, goods and services provided by government, the performance of policy subsystems and bureaucratic entities should, for that reason, be considered with regard to their satisfaction of public opinion. That departs from a longstanding tradition of scholarship that critiques the tyranny of an unelected executive under the Westminster system of government.Footnote 9 While problems of bureaucratic control are observed in different forms in different political systems,Footnote 10 the degree of responsiveness of bureaucratic outputs to the preferences of citizens is a valid – and important – indicator of the performance of democracy. Indeed, the Westminster system presents a critical test and paradox of political ‘responsiveness’, with its fusion of legislative and executive powers and tradition of party discipline. The executive (Cabinet) controls the legislative process in Parliament, restricting the influence of public opinion, but enhances the degree of political control over bureaucratic outputs. This article now argues that the thermostatic model of responsivenessFootnote 11 can be represented in the form of an error-correction model where policy and public opinion variables are cointegrated, and extends the focus of its investigation to bureaucratic outputs of government. It then applies that model to assess the performance of British government – and, in particular, the Immigration and Nationality Directorate of the Home Office – in its operation of border controls and administration of claims for asylum, for the period between 1994 and 2007, that is, asylum on the basis of ‘a well-founded fear of persecution’ – defined by the 1951 United Nations Convention relating to the Status of Refugees and updated by the 1967 Protocol relating to the Status of Refugees.
The public thermostat
The public is conceptualized as a thermostatFootnote 12 where it is responsive, through a process of adaptive feedback, to change in its social, economic and political environment.Footnote 13 For a defined population, there is a diversity of individual preferences where some people want more rights, protections, goods or services from government than others, and where the median value in the aggregate distribution of preferences represents the ‘ideal’ position. As such, the public have a preference for either ‘more’ or ‘less’ of specific policies. This does not, however, require that individual preferences relate to a specified amount. That preference is relative because it adjusts in response to the actions of government. When there is an increase (decrease) in policy, the preference for ‘more’ decreases (increases). The public thermostat is represented in the form:

That is where relative preferences (Xt d) are equal to the difference between a preferred, ‘ideal’ level (Xt*) and actual level of policy (Xt). This relative preference for ‘more’ or ‘less’ is, in effect, a first difference of public opinion and is therefore stationary (i.e. its mean, variance and autocorrelation structure are constant over time) both in theory and in practice.Footnote 14
As such, shifts in the policy temperature tend to be correlated with thermostatic shifts in public opinion. This is equivalent to a control that switches on when there is ‘too much’ and switches off when there is ‘too little’.Footnote 15 When there is a difference between the ideal and actual temperature, the public sends a signal about its preference for either more or less. That signal persists until the actual temperature is adjusted so that it is equal to the ‘ideal’ position. Thus, it is through change or persistence in public opinion that feedback signals about preferences and priorities are communicated to elected representatives and public officials. The thermostat metaphor suggests that both change and equilibrium are inherent characteristics of the relationship between policy and public opinion. Also, there is evidence that public opinion is thermostatic in its response to the level of government expenditure in specific domains (such as health, welfare, defence, education) in the United States, Canada and the United KingdomFootnote 16 and the relative liberalism or conservatism of legislative outcomes in the United States.Footnote 17 That suggests that trends of public opinion are often cyclical in nature, since preferences tend to be realigned in response to changes in the behaviour of government (for example, as policies become more conservative, preferences for conservatism decline). At the same time, public responsiveness is also a function of the issue salience of particular domains.Footnote 18
However, ‘issues’ are not necessarily the same as ‘policies’. And, indeed, policies are not necessarily measurable with dichotomous choice between ‘more’ or ‘less’, as is the case for budgetary expenditure or public policy mood.Footnote 19 The model of thermostatic feedback is restricted to cases where the statistical properties of public opinion (for example, mean, variance, autocorrelation) are constant over time. For the public to operate like a thermostat, then, negative feedback cannot be an ‘integrated’ (i.e. unit root) process. Yet, when observed in finite samples, policies or public opinion (such as mood, presidential approval) often tend to mimic properties of unit root processes.Footnote 20 And if public opinion is nonstationary (i.e. its value at any given point in time is a function of past disturbances), then it violates the principal assumption of the thermostatic model. That is, that preferences are relative to the difference between a preferred, ideal level and actual level of policy at a given point in time. So, whilst studies of agenda dynamicsFootnote 21 find that patterns of political attention are punctuated due to interactions of negative and positive feedback over time, those are not perfect ‘thermostatic’ mechanisms, in so far as budgeting, legislative behaviour and public attention tend to be nonstationary processes. Indeed, evidence from defence expenditure in the United States demonstrates that changes in Gallup’s ‘most important problem’ do not structure responsiveness of either the public or policymakers.Footnote 22 Now, that absence of negative feedback might be because the ‘problem’ status of an issue is not relative to its ideal status.Footnote 23 Whilst not thermostatic, the ‘response function’ of public attention differs between issue dimensions.Footnote 24 As such, technicalities of model specification are critical for diagnosis of the equilibrating properties of public opinion.
Political responsiveness
If there is ‘responsiveness’ in a specific domain, changes in government outputs will be positively correlated with preceding changes in public opinion, ceteris paribus. That is to say that shifts in opinion are, on average, followed by corresponding shifts in policy. This view is premised upon the majoritarian model of democracy, where responsiveness is constituted in satisfaction of a numerical majority of the people.Footnote 25 As such, responsiveness implies that utility is maximized for the median individual, in the tradition of the median voter theorem,Footnote 26 not that government policies achieve the Pareto optimization of welfare. This model of political responsiveness can be represented in the form:

In Equation 2 above, α 0 is an intercept term,  is the relative preference for policy, Zt −1 stands for other determinants of policy and εt is an error term. The coefficient β measures the strength of direct responsiveness to preferences, weighted for μj issue salience, and γ measures indirect representation of preferences through the mechanism of elections.Footnote 27 If β > 0, when there is an increase (decrease) in the net preferences for more or less, it is followed by a subsequent increase (decrease) in policy temperature. That constitutes the political response to the public’s signal about its preference for more or less, independent of effects of partisan control and other factors. The original specification of the model for budgeting assumes that political responsiveness is lagged because, in practice, decisions about expenditure are taken in the previous fiscal year.Footnote 28 And, for most policies, there is some lag between a signal of political commitment and its actual consequences.
In different studies, public policies are conceived in the form of budgetary expenditure,Footnote 29 legislative behaviourFootnote 30 and legislative attention to particular topics.Footnote 31 Differences are also found in patterns of opinion-responsiveness of government expenditure in specific domains, in the United States, Canada and the United Kingdom.Footnote 32 Whilst this comparative dimension of the measurement of political responsiveness is a recent development, there is a diverse literature of empirical studies on the dynamic relationship between government policies and public opinion.Footnote 33 However, utility-maximization implies that public opinion should, in the long run, be relative to tangible outputs of government, instead of legislative goals, promises or intentions (though these remain a useful predictor of eventual outcomes).Footnote 34 For instance, public opinion would not be satisfied if government supplied the favoured amount of expenditure or legislative attention, but subject to a significant proportion of waste, corruption or incompetence in pursuit of its stated objectives.Footnote 35 That is aside from weighting preferences about outputs for the issue salience of specific domains.
Thus, there is an understated – but important – conceptual distinction in estimations of the degree of democratic responsiveness between (1) policy, (2) bureaucratic outputs, (3) policy outputs and (4) policy outcomes. Simply, policy is equal to political commitment or intent, as measured in a particular form (such as legislation or expenditure). Bureaucratic outputs are equal to active transformation of policy intent into action either by individual bureaucrats or bureaucratic agencies (for example, inspections, prosecutions or disbursements). Policy outputs are equal to the sum of activities related to policy objectives, inclusive of behaviour of non-bureaucratic actors and exogenous forces (such as numbers of immigrants, convictions, roads and hospitals built). These, sometimes, are equivalent to bureaucratic outputs. Policy outcomes are equal to the verifiable consequences of policy interventions, relative to exogenous forces (like air quality, life expectancy, crime rates, productivity or inflation). These are indicators of the quality of social and economic life. This distinction between units of analysis means that – in practice – policy might fail, despite successful implementation, due to shortcomings in the underlying causal theory or resistance from environmental factors.Footnote 36
Government outputs, public opinion, cointegration and error-correction
There are a priori theoretical reasons to expect that public opinion, with the exception of relative preferences, and government outputs are integrated processes (i.e. that these are additive as a function of past shocks and tend to drift from the mean over time).Footnote 37 That is because of the natural incrementalism of government – with institutional friction that contributes to punctuationsFootnote 38 – and inherent persistence of public attitudes about issues or policies. Indeed, this expectation is consistent with the stability of political systems. As a consequence, government outputs and public opinion might sometimes appear to drift together over time. However, it is proven that regressions of integrated series are biased towards false rejection of the null hypothesis, finding spurious relationships where none exist.Footnote 39 And if series are differenced in order to prevent this, information is lost about the long-run relationships that might exist between variables.Footnote 40 However, it remains possible for government outputs and public opinion to be cointegrated.Footnote 41 That is where a linear combination of nonstationary variables is found to be stationary. As such, cointegrated variables drift together over time and share a similar, but not identical, stochastic trend (being analogous to magnetic attraction between a pair of random walks). The Granger representation theorem proves that multiple cointegrated variables can be represented in the form of an ‘error-correction’ model.Footnote 42 That is where there is a long-run equilibrium, and where shocks or deviations that increase or decrease the ‘normal’ distance between the variables tend to be corrected over time. This attractor characteristic of cointegration implies that at least one of the variables is attracted to the other(s). The short-run error-correction term in this model, therefore, measures the negative feedback that sustains the long-run, cointegrated equilibrium. This re-equilibration is similar, if not equivalent, to relative adjustments of the public thermostat (where, as described earlier, that is equal to the difference between an ideal preference and the actual level).
As such, error-correction models integrate the estimation of both stasis (i.e. equilibrium) and positive/negative feedback (i.e. punctuations or thermostatic adjustments). Indeed, feedback mechanisms are the principal concern of studies of responsiveness and agenda dynamics. This is also consistent with theoretical expectations about political behaviour, since government should respond to deviations from the long-run equilibrium state with a view to re-election and the public should respond to deviations in order to re-calibrate their opinions. Thus, cointegration and error-correction are appropriate representations of the change and equilibrium inherent to policy/opinion dynamics.
The cointegrating relationship that is implied in simultaneous interactions of the public thermostat and political responsiveness can, therefore, be represented as a vector error-correction model in the form shown in the following equations:Footnote 43


where changes in output and public opinion variables (ΔOUTPUTt, ΔOPINIONt) are a function of past n observations of themselves (αb, αe) and past n observations of the other cointegrated variable (αc, αf), plus a vector of exogenous variables that is common to both equations (X) and the vector coefficient (βOUTPUT, βOPINION), a residual generated from the normalized cointegrating equation (εt −1 = OPINIONt −1 − β 0 − OUTPUTt −1) which captures deviation of the previous observation from the long-run equilibrium, and the constant (αa ,0, αb ,0) and error terms ( ). The error-correction component (τOUTPUT, τOPINION) captures the rate of adjustment to the output/opinion equilibrium in response to a shock (εt −1).
If there is a cointegrating relationship between government outputs and public opinion, this should absorb disturbances to the long-run equilibrium. Indeed, it is quite plausible that dynamics of public and political responsiveness might be observed in this form. The error correction component captures the rate at which short-run shocks to either outputs or public opinion are re-equilibrated by the long-run cointegrating relationship between them. As such, this representation implies a general model of policy/opinion dynamics, consistent with theoretical expectations, where short-run disequilibria are incorporated into long-run political relationships through a process of negative/thermostatic feedback (i.e. error-correction).
Border control and asylum in britain, 1994–2007
In Britain, no domestic topic has become as controversial since the election of the Labour government on 1 May 1997 than that of immigration and asylum. Indeed, 11 September 2001 (9/11) transformed population movement and border security into matters of elevated national importance. Of course, underlying historical trends of social and economic globalization preceded this seismic event, entailing the problems that confront elected representatives and bureaucrats at this moment. But is the operation of border controls and administration of asylum by the British government responsive to public opinion? And is public opinion responsive to performance of the government in return? In the remainder of this article a thermostatic, error-correction model is specified to measure the short-run and long-run dynamics of output/opinion responsiveness.
Policy/Bureaucratic Outputs
The operation of border controls and administration of asylum policy is consistent with a conceptualization of this choice between ‘more’ or ‘less’ bureaucratic or policy outputs. Indeed, the structure of administration of the asylum system is itself a dynamic process, where there are a number of potential mechanisms for the application of political control and restoration of a desired equilibrium (although this equilibration is not automatic and relies upon government intervention).
First, the level of inputs into the asylum system – (1) applications – is a function of the interaction of border controls with an exogenous level of potential applications. Secondly, the level of input processing – (2) decisions – is a function of bureaucratic determination of applications. Thirdly, the level of positive resolution of inputs – (3) grants of asylum – is a function of each individual’s human right to asylum on the basis of ‘a well-founded fear of persecution’ – defined by the 1951 United Nations Convention relating to the Status of Refugees and updated by the 1967 Protocol relating to the Status of Refugees. Fourthly, the level of intermediate resolution of inputs – (4) dispensation of ‘leave to remain’ – is a function of the requirement of short-term protection,Footnote 44 where special considerations are required or when removal is precluded under the 1950 European Convention on Human Rights. Fifthly, the level of negative resolution of inputs – (5) refusals – is a function of the number of applications where the different criteria for asylum or leave to remain are not met. Sixthly, the level of actual outputs of the asylum system – (6) removals – is a function of the total number of failed applicants, where rights of appeal have been expended.Footnote 45 Thus, government has power to respond to public opinion at different points in the asylum system. It might target entrants (i.e. applications), accelerate its casework activities (i.e. decisions), revise the existing criteria for determinations (i.e. grants, leave to remain and refusals) or step up the intensity of enforcement (i.e. removals). Of course, change at certain points in the system might displace problems elsewhere. For example, an increase in the level of refusals might contribute to a backlog of cases for appeal and removal.
This analysis is based upon monthly data – for the period between 1994 and 2007 – that is provided for research purposes by the Asylum Statistics Team, Immigration Research and Statistics Service at the Home Office.Footnote 46 The data on removals is missing observations for 1994. This is the most comprehensive dataset available on the asylum system. In fact, official statistics are not available in quarterly format prior to 1994. Note that the results of factor analysis and the time-series diagnostics/models refer to quarterly, not monthly, data.
Factor Analysis
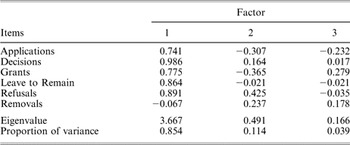
Factor analysis (see Table 1) of output items for asylum policy indicates that these exhibit a significant amount of common variance. The factor structure is as might be expected in theory, since the level of applications for asylum is itself entailed in the subsequent levels of decisions, the level of decisions is the sum of grants, leave to remain and refusals, and the level of removals is a function of the level of failed applications. It is noticeable that there is less commonality with the level of applications and grants of asylum. The former are in part subject to exogenous causes (such as war, conflict or economic conditions in other countries) and the latter are subject to the terms of the 1951 United Nations Convention relating to the Status of Refugees, and thus do not necessarily correspond to the level of ineligible claims. That there is least commonality with the level of removals is as might be expected, since this is furthest removed in the system from the level of applications. This distance increases the likelihood of divergence between inputs and outputs. It nonetheless appears that these input and output items move together over time in the same direction. This means that, on average, an increase in the level of applications is associated with an increase in the level of decisions, an increase in the level of decisions is associated with an increase in the level of grants, and so on. As an aggregator and administrator of cases, there is a degree of harmonization of behaviour of the asylum system.
Factor Loadings of Asylum Policy Items

Public Opinion
It is not unreasonable to suggest that the public possess a relative preference for asylum or immigration, i.e., it desires ‘more’ or ‘less’ of it, depending on its actual level. From time to time, research omnibuses such as the British Social Attitudes Survey (BSA) question the British public about its preference for more or less immigration (with this topic included in relation to settlement of particular ethnic/national groups in 1983, 1984, 1986, 1989, 1990, 1994, 1995 and 1996). The proportion of respondents who believed the number of immigrants to Britain should be ‘reduced a lot’ increased from 39 per cent in 1995 to 49 per cent in 2003. However, continuous time-series data on these or equivalent attitudinal scales do not exist. Whilst it is possible to construct an index of the public mood about asylum and immigration that captures the preference for more or less (see Appendix 1), the lack of dyadic comparisons of public attitudes for the period between 1997 and 2002 restricts its robustness for empirical analysis. Nor are there sufficient observations to extract values of the mood index at quarterly intervals.
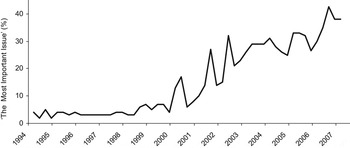
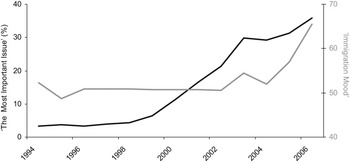
Instead, the most frequent measure of public attitudes relating to asylum/immigration is the MORI Political Monitor.Footnote 47 Since 1974, this has posed the question, ‘What would you say is the most important issue facing Britain today?’ plus, ‘What do you see as other important issues facing Britain today?’ It measures the importance of a specific issue relative to the importance of other issues. The answers of respondents are unprompted and compiled for a selection of issue categories that are relatively stable over time. This includes a category of responses on the importance of the issue of race relations, immigration, immigrants and asylum.Footnote 48 The percentage of respondents identifying this category as the most important issue or one of the other important issues facing Britain is illustrated in Figure 4.
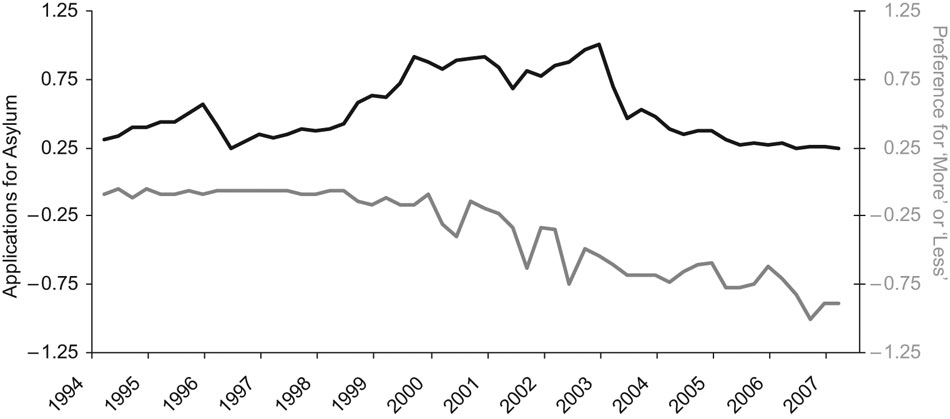
Does the most important issue question capture preferences about the level of immigration and asylum? The correspondence of the public mood in favour of less immigration (see Appendix 1) and public attention to the issue of immigration and asylum is illustrated in Figure 5. The correlation of these series (r 2 = 0.47) is sufficient to suggest that the most/other important issue measure tracks the public preference for less immigration to some degree over the period 1994–2006. It is therefore defensible to use the most important issue as our measure of public opinion. This does not resolve the general question of whether public attention might, in certain circumstances, behave in a thermostatic fashion. The error-correction models that are constructed in later analysis invert values of the most important issue in order that it captures the preference for less, not more.
Unit root, cointegrating vectors and output/opinion dynamics
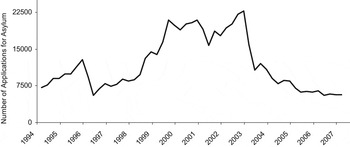
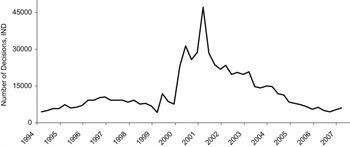
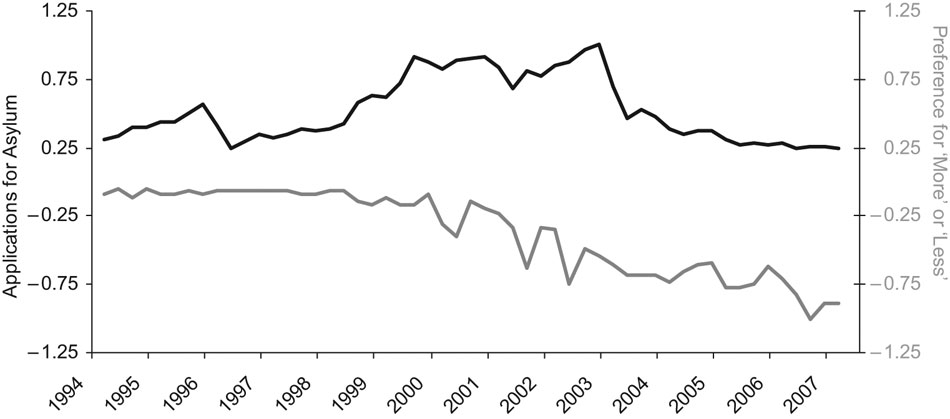
The respective trajectories of public opinion and government outputs that are presented in Figures 1, 2, 3 and 4 are not identical, but do share certain features. Between 1994 and 2001 these observed upward drift, subject to random fluctuations, and downward trends or relative stabilization in the period after 2001 (with the exception of removals of failed applicants, which observed an unrelenting upward trend between 1994 and 2006). Of note is the temporary spike in the volume of decisions in January 2001, which was the result of an underlying increase in the number of refusals and grants of leave to remain. When the most/other important issues measure is inverted to capture the net preference for ‘less’ immigrants and asylum seekers, rather than public attention, its meandering drift over the period between 1994 and 2000 precedes a strong downturn in preferences from 2001 onwards. As such, downward trends in the level of applications and decisions (after the reported ‘crisis’ of the asylum system in 1999/2000) coincided with a decrease in this net preference for immigrants and asylum seekers. Overall, there is clear persistence in dynamics of public opinion and outputs of the asylum system. Moreover, these appear to move together over time.
Number of applications for asylum

Number of decisions processed, IND

Number of removals of failed asylum seekers, IND

The ‘most important issue’ plus ‘other important issues’, 1994–2007

The ‘most important issue’ and ‘immigration mood’, 1994–2006

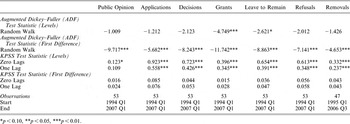
Full results of ‘unit root’ tests in both level and first-differences, lag order tests selected with Akaike’s information criterion and the Johansen test for cointegrating ‘vectors’ are reported in Appendix Table A1. The Augmented Dickey–Fuller test statistics suggest that public opinion and government outputs are integrated processes, with the exception of grants of asylum which are stationary and possible exception of leave to remain (which rejects the presence of unit root at the 90 per cent confidence level, indicating a substantial likelihood that it is stationary).Footnote 49 That is consistent with the findings of factor analysis and also with legal protection of the right to asylum from political interference (under the terms of the 1951 United Nations Convention relating to the Status of Refugees). The KPSS test statistics mirror the findings from the Augmented Dickey–Fuller test,Footnote 50 with the exception of grants of asylum and leave to remain, since it rejects the null hypothesis of stationarity for each series (note, the KPSS test is prone to rejection of the null when a series is fractionally integrated or highly autoregressive,Footnote 51 so inconsistencies in results for grants and leave to remain suggest that these outputs might be ‘long memoried’). That notwithstanding, the evidence suggests that public opinion and the other policy/bureaucratic outputs are first order integrated processes. Because of this, and commonalities between the trajectories of the variables over time, it is possible that these are cointegrated.
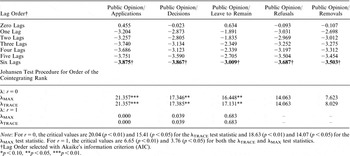
The Johansen test procedure provides a powerful alternative to residual-based tests for cointegration where the relationship between public opinion and outputs is thought to be endogenous.Footnote 52 This determines the cointegrating rank (i.e. total number of cointegrating vectors) with reference to the lags of each variable in an underlying vector autoregressive model. The lag order is selected with Akaike’s information criterion (AIC) and restricted to a maximum of six quarters. For the applications, decisions and leave to remain series, the Johansen test indicates that there is a cointegrating relationship with public opinion.
Error-correction models of output/opinion dynamics
An error-correction model is therefore an appropriate model for exploration of the short-run and long-run relationship between government outputs and public opinion, and the feedback mechanisms that restore this to its equilibrium. Does public opinion respond to change in outputs related to the administration of asylum? Do those outputs respond to changes in the public’s preference for more or less immigrants and asylum seekers? What is the nature of the short-run relationship between public opinion and government outputs, accepting that these revert to a long-run equilibrium?
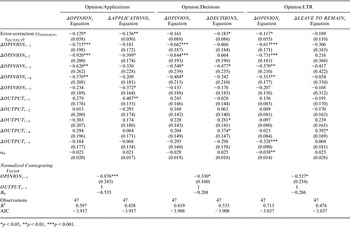
The vector error-correction models of output/opinion responsiveness for applications, decisions and leave to remain are reported in Table 2. These capture the short-run and long-run dynamics of responsiveness, where a normalized cointegrating vector measures the long-run component that is identical for both outputs and opinion variables and the short-run ‘error-correction’ component measures how each variable equilibrates around the long-run component. As such, an error-correction model of responsiveness is able to diagnose the equilibrium relationship of outputs/opinion and the ‘thermostatic’ rate of convergence or divergence of government and/or the public to deviations from that long-run equilibrium. The reported models use normalized versions of each of the series (such that their maximum value is taken as a base equal to one and other values are calculated as a proportion of that value). This adjustment has no effect upon the results of unit root, lag order or Johansen tests but replaces absolute values so that direct comparisons can be made between the output and opinion variables (and in particular for the strength of error-correction).
Vector Error Correction Models of Output/Opinion Responsiveness (1994–2007)

*p < 0.05, **p < 0.01, ***p < 0.001.
As was indicated earlier, there is a positive and sustained long-run relationship between public opinion and the total number of applications for asylum, decisions and grants of leave to remain. As the preference of the British public for fewer immigrants and asylum seekers increases over time, the number of applications for asylum and number of cases administered within the asylum system decreases. For the British public, that dynamic appears to be premised upon a prevailing opinion that an ‘excessive’ number of asylum claimants is undesirable, regardless of the merit of claims. At the same time, the error-correction component (τOPINION, τOUTPUT) estimated for that cointegrating relationship is found to be significant at the 95 per cent confidence level for the number of applications (whilst that component is insignificant for either the output or opinion equation of the model for decisions and leave to remain). This component measures the speed of adjustment to the long-run output/opinion equilibrium in response to shocks. As such, it reveals the degree of equilibration in the relationship between government outputs and public opinion.
For the number of applications, shocks to the equilibrium are corrected at a rate of 14 per cent. So, a one unit deviation from the long-run equilibrium in the previous quarter leads to a 0.14 unit decrease in the number of applications in the current quarter (τOUTPUT = 0.136). As such, 86 per cent of the initial disequilibrating shock remains after one quarter, 74 per cent after two quarters, 64 per cent after three quarters and so on. For the public’s preference for more or less, shocks to the equilibrium are corrected at a rate of 13 per cent. Once again, a one unit deviation from this long-run equilibrium leads to a 0.13 unit decrease in public opinion (τOPINION = 0.129). For the normalized series, a 0.01 unit decrease in applications is equal to an actual decrease of 228 in the number of applications, whilst a 0.01 unit decrease in public opinion is equal to an actual decrease of 0.43 per cent in the relative preference for more or less. The error-correction parameter therefore measures the thermostatic character of output/opinion dynamics. Whenever there is a disturbance of the long-run, cointegrated, relationship between public opinion and the number of applications for asylum, there is a corrective response that restores that equilibrium. The similar values of the coefficients for the output and opinion equations indicate that the degree of responsiveness of both government and the public is equivalent and balanced.
Applications for asylum and public preferences for ‘more’ or ‘less’ (normalized series)
As was noted earlier, for the number of decisions and grants of leave to remain the error-correction parameter is insignificant for the output or opinion equation. Thus, it appears that the cointegrating relationship is not perfectly equilibrating, since disturbances to the equilibrium are not corrected. Factor analysis demonstrated earlier that, as a subsystem, there is a significant amount of common variance between outputs of the asylum system. As such, it is conceivable that this (weak) cointegrating relationship for the total number of decisions and grants of leave to remain is itself a function of the number of inputs into the system (i.e. applications) rather than output/opinion responsiveness of these specific outputs. With no evidence of cointegration for grants or refusals of asylum, this category of discretionary awards exhibits (albeit fragile) responsiveness in the cointegrated long-run correspondence between public opinion and the administration of claims for asylum by the Immigration and Nationality Directorate of the Home Office.
Also, the coefficients from the underlying vector autoregressive model provide additional information on the short-run relationship between the number of applications and the public preference for either more or less. First, it is found that public opinion tends to feedback on itself. Changes in public opinion are correlated (at the 95 per cent confidence level) with preceding changes in opinion at the 1st, 2nd and 3rd lags. Because these coefficients are negative an initial increase in public opinion is succeeded by a series of subsequent decreases. After an initial increase, the preference for more or less immigrants or asylum seekers tends to decline. Secondly, it is found that the level of applications also responds to changes in public opinion at the 2nd and 5th lags. As such, a one unit increase in public opinion (i.e. a decrease in the net preference for less) is correlated with decreases of 0.40 and 0.37 in the level of applications. With the normalized series, an increase of 1 per cent in the preference for less is therefore associated with decreases of 214 and 198 in the number of applications for asylum,Footnote 53 counter to the direction that would be expected. Thirdly, the level of applications responds (positively) to itself at the 1st lag, suggesting there is some persistence for inputs to the asylum system. As such, evidence of responsiveness in the short run is weak, with the exception of the error-correction term.
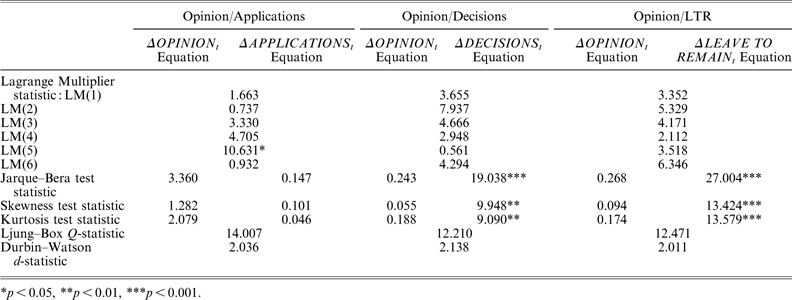
For each of the estimated vector error-correction models, the Durbin–Watson d-statistic does not suggest the presence of serial autocorrelation, whilst the Ljung–Box Q-statistic shows that the residuals have been reduced to white noise (see Table 3). The Lagrange Multiplier test finds a trace of residual autocorrelation for applications at the fifth lag at the 95% confidence level. The Jarque–Bera test for the non-normal distribution of disturbancesFootnote 54 plus tests for skewness and kurtosisFootnote 55 find that the decisions and leave to remain series are non-normal, leptokurtic and skewed. As such, there is further cause for scepticism over the cointegrated output/opinion relationship for these variables.
Diagnostics for Vector Error Correction Models of Output/Opinion Responsiveness (1994–2007)
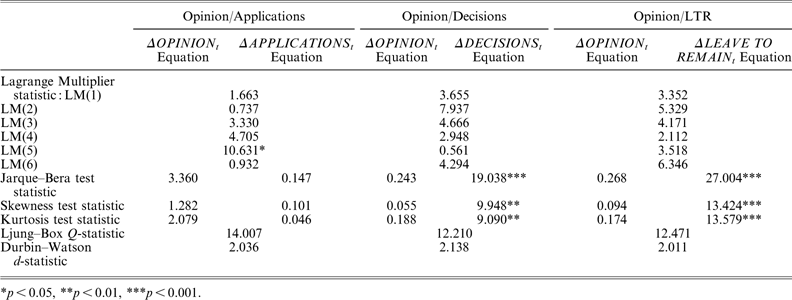
*p < 0.05, **p < 0.01, ***p < 0.001.
Conclusion
The evidence presented on cointegration suggests that there is a positive, sustained long-run relationship between public opinion about the issue of asylum and administration of the asylum system by the British government. That is with particular reference to the total number of applications for asylum. As such, there is correspondence between the public preference for ‘more’ or ‘less’ immigrants and asylum seekers and the actual number of applications. The British public appears to notice and respond to government outputs related to administration of asylum. In response, government control of the total number of applications appears to be a function of the degree of public attention to the issue. For the British government, the level of policy and bureaucratic outputs acts as a valve that releases the pressure exercised by public opinion. As an exception to this, it is noticeable that there is no cointegrating relationship between public opinion and the total number of grants or refusals of asylum and the number of removals. This is as might be expected since these are subject to independent criteria (i.e. the 1951 United Nations Convention relating to the Status of Refugees and 1950 European Convention on Human Rights). These present obstacles to achievement of responsiveness for policy-makers – even under the Westminster system. Output/opinion responsiveness is detected for the number of asylum applications, where government’s management of this exogenous input is subject to fewer legal restrictions than grants of asylum (although displacement of applicants to other countries is constrained by some concordats at the European level). The opinion-responsiveness of applications also corresponds to priorities of policy-makers during this period, such as Objective V of the Home Office’s 2002 Public Service Agreement that sets a target of ‘reducing significantly unfounded asylum claims’. Also, there is also less convincing evidence of output/opinion responsiveness for grants of leave to remain (and, as a result, decisions), where there is most potential for discretion in decisions of the Home Office. As such, this suggests that thermostatic responsiveness tends to be achieved where government is able to exert some control over external factors (such as applications) or exercise discretion in decisions that are not subject to legislative direction (such as leave to remain). Moreover, it is not coincidental that the output/opinion relationship is found to be error-correcting for the level of applications, given that publication of this particular government statistic has been the principal focus of media attention for the past decade or so. This evidence is, therefore, consistent with the importance of conditions of issue salience and government control of both the legislative and executive process. Whilst the issue of asylum is unique in some respects, these conditions can be generalized for output/opinion responsiveness in the Westminster system.
Where short-run and long-run dynamics of opinion/output responsiveness are measured with a vector error-correction model, it is discovered that public opinion and government outputs (i.e. applications) each revert to the long-run equilibrium in response to shocks. This finding suggests that in this instance the most/other important issues measure is thermostatic and equivalent to the relative preference for either more or less.Footnote 56 Indeed, public opinion responds with quite surprising precision to the actual performance of the asylum system. In return, the level of applications (and perhaps also decisions and leave to remain) is responsive to disturbances of the long-run equilibrium, whilst the level of grants, refusals and removals is not. It appears, therefore, that responsiveness of the number of decisions is dependent upon the responsiveness of the number of grants of leave to remain. Also, the coefficients of short-run variables that are reported for the series of underlying vector autoregressive models show that increases in the public preference for less immigrants and asylum seekers are, counter to expectations, correlated with subsequent increases in the number of applications (at the 2nd lag). Together, these findings suggest that certain parts of the asylum system are more predisposed – or receptive – to responsiveness than others. Where government activities are subject to defined or external criteria (i.e. grants and refusals), there is less scope for responsiveness. Where these involve either control of external forces or are subject to greater flexibility or discretion, there is more scope for responsiveness. As such, there are clear and meaningful differences in responsiveness of bureaucratic and policy outputs for operation of border controls and administration of asylum. The distinctive pattern of responsiveness found here suggests sophisticated and systematic behaviour of both politicians and bureaucrats.
The Westminster system presents a critical test of models of political responsiveness in its fusion of legislative and executive powers and tradition of party discipline. In Britain, the executive sets the legislative timetable in Parliament and exercises direct control over bureaucratic departments and agencies. This constitutional design restricts the influence of public opinion over the elected legislature, but enhances the degree of political control over government outputs.Footnote 57 As a consequence this link between public opinion about the issue of asylum and the performance of the Home Office provides a notable example of policy/opinion responsiveness under the Westminster system with its fusion of executive and legislative powers. The evidence suggests that this formation of political institutions does not (always) restrict the responsiveness of an elected government to public opinion. Indeed, responsiveness is observed here for a policy subsystem where political control of an unelected bureaucracy is often dependent upon sub-legislative interventions/controls rather than legislation in parliament. As such, these findings are somewhat inconsistent with hierarchical conceptions of policy/opinion responsiveness. Of course, the results for asylum might be attributable to its particular salience. However, in terms of government functions, the control and management of applications for asylum shares characteristics with policing or enforcement regimes, whilst administration of claims for asylum involves processing requirements that are observed in the administration of welfare or taxation. Thus, this balance of legislative/executive powers is not particular to the issue of asylum.
In addition, the thermostatic properties of output/opinion responsiveness are revealed with representation of ‘error correction’ mechanisms of cointegrated relationships. That distinction between short-run and long-run dynamics might explain the co-existence of punctuated equilibriaFootnote 58 and responsivenessFootnote 59 in political behaviour. As such, it is possible for policy/opinion to persist in long-run equilibrium, but subject to periodic corrections or realignments in response to shocks. The estimation of vector error-correction models incorporates that contrast between near stasis/equilibrium and negative feedback, unlike ordinary least squares regression techniques.
Of course, it is known that the mass media exerts a significant agenda-setting influence and moderates public opinion.Footnote 60 There is also evidence of determination of public attitudes about asylum and immigration by media exposure.Footnote 61 Nonetheless, it is notable that the British public is sensitive, in a meaningful way, to changes in the number of applications for asylum. Indeed, the most important issue appears to capture the relative preference for ‘more’ or ‘less’ and is responsive to change in government outputs. Might this be an exceptional case? Perhaps. After election of the Labour government in 1997, the issue of asylum became a hot topic like no other in home affairs – receiving thousands of column inches coverage in national newspapers about the number of applications and growth of the case backlog at the Home Office. Moreover, this was an issue where the performance of bureaucracy mattered to the public and where the relevant indicators of outputs were publicized and comprehensible. Also, the poll question about the most important issue aggregates responses that refer to race relations, immigrants, immigration and asylum seekers. For the period between 1994 and 2007, popular rhetoric about ‘asylum’ and ‘asylum seekers’ in social, media and political circles ensured that this measure of public opinion captured the relative preference for ‘more’ or ‘less’. And whilst public or media attention is often hysterical in tone, there is a meaningful response of (aggregate) public opinion to changes in the government’s management and control of the asylum system in Britain. Moreover, this appears to have exerted downward force on the total number of applications for asylum. However, it is conceivable that both the short-run and long-run relationships observed here between public opinion and the government administration of asylum might break down with resurgence of public interest in other elements of this measure of the most important issue. Indeed, since 2004 the topic of managed, legal immigration has started to replace asylum at the centre of the political debate about border control and population movements.
Do policy makers really care about public opinion in this particular domain? The answer is a resounding ‘Yes’. Setting aside rhetorical content of government statements aimed at public anxiety, the direct attentiveness of government to public opinion is illustrated by the Cabinet Office’s commissioning of the pollsters MORIFootnote 62 and ICMFootnote 63 to conduct survey research into public attitudes towards the asylum and immigration system. Whereas the construction of vector error-correction models provides a statistical representation of the relationship between public opinion and government outputs, such open consultation of public opinion is suggestive of the existence of an underlying causal relationship. At the very highest tier of the democratic system, elected politicians talk about public opinion, directly consult it and preside over outputs that respond to it, at least in administration of specific outputs of the asylum system (and for the period in question).
APPENDIX 1: INDEX OF IMMIGRATION MOOD
The index of immigration mood is estimated using Stimson’s dyadic-ratios algorithm (see Stimson, Public Opinion in America). That first calculates mood (Vt) as an average of the available observations of public opinion in favour of ‘less’ immigration or asylum, at period t, through forward and backward recursion of dyadic ratios, then weighted for the degree of common variance of each opinion with mood itself. This is expressed in the form:
Unit Root Test Results for Output/Opinion Variables (1994–2007)

*p < 0.10, **p < 0.05, ***p < 0.01.
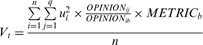
That is where i = 1, n is available observations of public opinion in favour of less, j = 1, q is available dyadic comparisons for opinion j, b is the base period for the recursive metric, METRICb is the value of the metric for period b, and ui 2 is an estimated weight for common variance of OPINIONi and V. The mood index is then smoothed with an exponential algorithm, yt = αxt + (1 − α)xt −1, to dampen the volatility of random errors from sampling fluctuations. That recalculates immigration mood as a weighted moving average of past and future values.
The mood index is extracted from a total of sixty-seven response items for sixteen different question wordings about the topic of immigration (using opinion data from the BSA, MORI and YouGov over the period 1983–2006). These questions were selected where they provided an indication of the preference for ‘less immigration’ (e.g. ‘less settlement’ of specific nationalities, that immigrants are ‘bad’ for the economy or culture, or that there should be ‘stricter control’ of immigration). As such, this represents an aggregated measure of public sentiment in opposition to the acceptance of immigrants and asylum seekers.
APPENDIX 2: THE JOHANSEN TEST PROCEDURE
For the Johansen test procedure (see Appendix Table A2), the relevant test statistics are the maximum eigenvalue (λMAX) and trace eigenvalue (λTRACE). The maximum eigenvalue test (λMAX) considers the null hypothesis that there are r cointegrating vectors present against the alternative that there are r + 1 present. The trace eigenvalue test (λTRACE) considers the null hypothesis that the number of cointegrating vectors is less than or equal to r against the alternative that there are more than r.
Johansen Test Results for Output/Opinion Variables (1994–2007)

Note: For r = 0, the critical values are 20.04 (p < 0.01) and 15.41 (p < 0.05) for the λTRACE test statistic and 18.63 (p < 0.01) and 14.07 (p < 0.05) for the λMAX test statistic. For r = 1, the critical values are 6.65 (p < 0.01) and 3.76 (p < 0.05) for both the λTRACE and λMAX test statistics.
†Lag Order selected with Akaike’s information criterion (AIC).
*p < 0.10, **p < 0.05, ***p < 0.01.
For refusals and removals, the λMAX and λTRACE statistics fail to reject H0: r = 0 at the 95 per cent level. It is concluded, therefore, that no cointegrating vectors are present.
For applications, decisions and leave to remain, the λMAX and λTRACE statistics reject H0: r = 0 at the 99 per cent level, but fail to reject H0: r = 1 at the 95 per cent level. It is concluded, therefore, that one cointegrating ‘vector’ is present for the long-run relationship that exists between public opinion and (i) applications, (ii) decisions and (iii) leave to remain.
The evidence of cointegrating relationships between public opinion and multiple different outputs is quite plausible, given the significant amount of common variance diagnosed through factor analysis (see Table 1).