INTRODUCTION
The hookworms, Ancylostoma duodenale and Necator americanus infect an estimated 600 million people worldwide and are major causes of global morbidity accounting for as many as 22·1 million disability-adjusted life years (DALYs) lost annually (Bethony et al. Reference Bethony, Brooker, Albonico, Geiger, Loukas, Diemert and Hotez2006; Chan, Reference Chan1997). Hookworm infections belong to the so-called neglected tropical diseases and occur mostly in the poorest regions of tropical and subtropical countries (Bethony et al. Reference Bethony, Brooker, Albonico, Geiger, Loukas, Diemert and Hotez2006; Hotez et al. Reference Hotez, Brindley, Bethony, King, Pearce and Jacobson2008). School-age children, pregnant women and the developing foetuses are particularly at risk of suffering severe morbidities from hookworm infections (Brooker et al. Reference Brooker, Bethony and Hotez2004).
Currently, control of hookworms relies essentially on regular anthelmintic treatment, mostly in the framework of mass drug administration campaigns (Harhay et al. Reference Harhay, Horton and Olliaro2010; Hotez, Reference Hotez2008; Hotez and Pecoul, Reference Hotez and Pecoul2010). Despite this, only five drugs (the two benzimidazoles albendazole and mebendazole, pyrantel pamoate, levamisole and ivermectin) are recommended by the World Health Organisation (WHO), which have all been used since decades (WHO, 2011). In terms of cure rates only albendazole is highly effective against hookworms (Keiser and Utzinger, Reference Keiser and Utzinger2010). In addition, resistance to these drugs is already widely spread among livestock (Wolstenholme et al. Reference Wolstenholme, Fairweather, Prichard, Von Samson-Himmelstjerna and Sangster2004) and therefore there are concerns about the emergence of drug resistance among human helminth populations. Hence, there is a pressing need to discover and develop alternative anthelmintics (Geerts and Gryseels, Reference Geerts and Gryseels2001; Kaplan, Reference Kaplan2004) and robust tools to monitor helminths drug susceptibility.
Today, the few ongoing drug discovery efforts on human nematodes rely on low- to medium-throughput in vitro whole organism drug screening. In more detail, the current assay of choice, the motility assay, is based on the microscopic evaluation of the worms' viability, following drug exposure and subsequent stimulation of worms (Gill et al. Reference Gill, Redwin, Van Wyk and Lacey1991; Kotze et al. Reference Kotze, Clifford, O'grady, Behnke and Mccarthy2004; Satou et al. Reference Satou, Koga, Koike, Tada and Nikaido2001). The motility assay can be performed with different developmental stages, and requires little laboratory equipment. However, it is time consuming and prone to subjectivity upon reading. The development of a novel medium- to high-throughput in vitro assay with a simple readout would therefore be a great step forward in the field of nematocidal drug discovery.
In this work, we aimed to evaluate several potential alternative in vitro assays to evaluate drug effects on A. ceylanicum. We assessed two viability markers, Alamar Blue®, an indicator for metabolic cell function (Räz et al. Reference Räz, Iten, Grether-Buhler, Kaminsky and Brun1997) and the MTT reduction assay, which is based on a colourimetric reaction involving pyridine nucleotides cofactors (Berridge and Tan, Reference Berridge and Tan1993; Mosmann, Reference Mosmann1983). In addition, we measured acid phosphatase, which is secreted in large amounts by several nematode species in feeding stages, possibly to promote extracorporeal digestion and tissue penetration (Maki and Yanagisawa, Reference Maki and Yanagisawa1980; Martinez-Grueiro, Reference Martinez-Grueiro2002) and which is a good indicator of the worms' fitness. We also evaluated the feeding inhibition assay (Hawdon and Schad, Reference Hawdon and Schad1990; Kopp et al. Reference Kopp, Coleman, Mccarthy and Kotze2008), and two fairly new technologies, namely isothermal calorimetry (Braissant et al. Reference Braissant, Wirz, Gopfert and Daniels2010) and the xCELLigence System (Roche Inc.) (Smout et al. Reference Smout, Kotze, Mccarthy and Loukas2010). We analysed the effect of albendazole, levamisole and ivermectin on L3, stimulated L3 and adults in these assays and compared findings with results obtained with the current method of choice, the motility assay. Finally, advantages and disadvantages of the individual assays are highlighted.
MATERIALS AND METHODS
Drugs
Albendazole and ivermectin were purchased from Sigma-Aldrich (Buchs, Switzerland), and levamisole-hydrochloride was obtained from Fluka (Buchs, Switzerland). Stock solutions (5 mg/ml) were prepared for all drugs in 100% DMSO (Fluka, Buchs, Switzerland) and stored at 4°C.
Animals and parasite infections
Three-week-old male Syrian Golden hamsters were purchased from Charles River (Sulzfeld, Germany). The A. ceylanicum life cycle has been maintained at the Swiss TPH since June 2009. Briefly, hamsters were immunosuppressed (0·5 mg/l dexamethasone (dexamethasone water-soluble, Sigma-Aldrich) in the drinking water from one day before infection onwards. They were orally infected with 150 A. ceylanicum L3, which had been assessed for viability. Animals were kept in groups of 5 in macrolon cages under environmentally-controlled conditions (temperature: 25°C, humidity: 70%, light/dark cycle 12/12 hours) and had access to water and rodent food (Rodent Blox, Eberle NAFAG, Gossau, Switzerland). The current work was approved by the local veterinary agency based on Swiss cantonal and national regulations (permission no. 2070).
In vitro assays General procedure
L3: In 96-well plates, 30 L3 per well were incubated in 200 μl HBSS supplemented with 25 μg/ml amphotericin B (Sigma-Aldrich), 10 000 U/ml penicillin and 10 mg/ml streptomycin (Sigma-Aldrich) and drug dilutions ranging from 100 to 1 μg/ml, final concentration. The plates were incubated for 72 hours at room-temperature, in dark and humid conditions.
Stimulated L3: Third-stage larvae are in “dauer” stage and do not feed or show any metabolic activity. In the feeding inhibition assay, L3 are brought into the fourth stage, where they resume feeding, and are then exposed to drugs. We used a modified protocol from Kopp and colleagues for this transformation (Kopp et al. Reference Kopp, Coleman, Mccarthy and Kotze2008).
L3 were pelleted (3000×g, 3 minutes) and cleaned in 1% HCl 1 M in tap water for 10 minutes at 37°C and then washed twice in RPMI medium (RPMI 1640 (Gibco) supplemented with 0·5% ALBUMAX II (Gibco), 25 mM HEPES (Sigma-Aldrich), 25 mM NaHCO3 (Sigma-Aldrich), 25 μg/ml amphotericin B (Sigma-Aldrich), 10 000 U/ml penicillin and 10 mg/ml streptomycin (Sigma-Aldrich), 15% v/v foetal calf serum (FCS, Gibco), and 20 mM reduced L-glutathione (Fluka)). Thirty L3 per well were incubated in 200 μl RPMI medium for 24 hours at 37°C. In a next step 100 μl medium were removed and replaced with 100 μl of the respective drug dilution in RPMI medium. The plates were incubated for another 72 hours at 37°C, 5% CO2.
Adult stage: In 48-well plates, 3–4 adult worms of both sexes were incubated per well in 1 ml HBSS medium supplemented with 25 μg/ml amphotericin B (Sigma-Aldrich), 10 000 U/ml penicillin and 10 mg/ml streptomycin (Sigma-Aldrich), 10% v/v FCS (Gibco), and drug dilutions (100 to 1 μg/ml). The plates were incubated for 72 hours at 37°C, 5% CO2.
Larval and adult motility assay
Following incubation of L3 and adults with drugs as described above, larval and adult motilities were evaluated under an inverted microscope (magnification 20×, Carl Zeiss, Germany), following addition of hot water (∼80°C, [100 μl] L3, [500 μl] adult worms) and exposure to the microscope light. Larvae showing no movement after stimulation were classified as dead and the percentage survival was established for each well. The viability of adult worms was assessed using a motility scale from 2 (normal movements, worms healthy) to 0 (no movements, death) and converted into percentage viability. Motility assays were conducted at least twice in triplicate.
Feeding inhibition assay
Following incubation of stimulated L3 (as described above), 100 μl medium were removed from each well and replaced with bovine albumin conjugated with fluorescein isothiocyanate (1·25 mg/ml, final concentration, Sigma-Aldrich) and the plate was incubated for 3 hours at 37°C. Larvae were washed 3 times in PBS, filled in individual 1·5 ml Eppendorf tubes and distributed again into wells. Using an inverted fluorescence microscope (Carl Zeiss, Germany, magnification 100–200×, excitation: 450–490 nm, emission: 520 nm), larvae whose intestinal tract was stained by more than 50% in the length were considered fit and counted (Kopp et al. Reference Kopp, Coleman, Mccarthy and Kotze2008). The percentage survival was calculated for each well. The motility of worms was assessed in parallel without adding hot water. The assay was conducted three times.
Alamar Blue® assay
The Alamar Blue assay was adapted from the protocol developed by Räz et al. (Räz et al. Reference Räz, Iten, Grether-Buhler, Kaminsky and Brun1997). After 72 hours of incubation with drugs (as summarized above), the worms (adults, L3 and stimulated L3) were transferred into 200 μl freshly supplemented HBSS medium (2 adult worms, or 30 L3 per well) in a 96-well plate. Ten μl resazurin (Sigma-Aldrich, 125 mg/l) were added to each well. The plates were then incubated at 37°C, 5% CO2 for 5 hours (up to 24 hours for adults). The resulting absorbance was measured every hour for 5 hours (and once after 24 hours for adults) in each well (excitation: 536 nm, emission: 588 nm, Spectramax® Gemini XS, Molecular devices, USA). The assay was carried out at least twice.
MTT reduction assay
The MTT assay was run according to James and colleagues with slight modifications (James and Davey, Reference James and Davey2007). Drug activity was tested using a single adult worm, or 30 L3 per well (in duplicate) in 96-well plates (total volume 200 μl). After 72 hours of incubation, the worms' viability was assessed microscopically (inverted microscope, magnification 20×) without adding hot water. One hundred μl were removed from each well and replaced with 100 μl MTT (thiazolyl blue tetrazolium bromide, Sigma-Aldrich) solution (2·5 mg/ml final concentration). The plates were incubated for up to 3 hours at 37°C, 5% CO2. The worms were washed once in sterile PBS, transferred to 50 μl DMSO 100% (Fluka, Buchs, Switzerland) and allowed to de-stain for 20 minutes at 37°C. The resulting absorbance was measured at 588 nm, Versamax® (Molecular Devices, USA). The assay was performed at least two times.
Acid phosphatase activity assay
The assays were carried out as described by Martinez-Grueiro et al. (Martinez-Grueiro, Reference Martinez-Grueiro2002) with small changes in the protocol. After 72 hours of incubation, adult worms were transferred into 1 ml supplemented HBSS medium and incubated for another 5 hours at 37°C, 5% CO2. The motility was assessed before adding reagents, without adding hot water. The supernatant was frozen at −20°C or directly used for the following steps. Two times 100 μl of the supernatant were removed and incubated for either 1 or 2 hours at 37°C, 5% CO2 with 50 μl fresh ρ-nitrophenyl phosphate (pNPP, Sigma-Aldrich) solution (10 mM, in sodium acetate buffer pH 4). The reaction was blocked with 70 μl NaOH 0·3 M and the absorbance measured at 405 nm (Versamax®, Molecular Devices, USA). For L3 and stimulated L3, 100 μl supernatant were removed from the drug assay plate directly and incubated for 2 hours with pNPP as described above. The assay was conducted three times.
Isothermal micro- and nanocalorimetry
Isothermal calorimetry measures quantitatively exo- and endothermic heat flow of metabolic processes, and has already shown applicability using different helminth models (Braissant et al. Reference Braissant, Wirz, Gopfert and Daniels2010; Kirchhofer et al. Reference Kirchhofer, Vargas, Braissant, Dong, Wang, Vennerstrom and Keiser2011; Manneck et al. Reference Manneck, Braissant, Haggenmuller and Keiser2011). The endpoint used in this study was the time of death of the worms. A thermostated (37°C) 48-chanel microcalorimeter (TAM 48, TA Instruments, New Castle, Delaware, USA) or a 3-channel nanocalorimeter (TAM-III, TA Instruments, New Castle, Delaware, USA) were used to measure the heat flow of A. ceylanicum over at least 3 days. Briefly, 100, 200 or 500 L3 (microcalorimetry) or 8 adult worms (micro- and nanocalorimetry) were distributed into sterile glass ampoules containing 2·7 ml of supplemented HBSS medium. The system was allowed to equilibrate for at least 12 hours before injection of 0·3 ml pre-warmed drug solutions (or DMSO solutions as control conditions) and allowed to equilibrate again for around 12 hours. The heat flow was continuously recorded in each ampoule and summarized to obtain an effective sampling rate of one data point every 10 minutes. Noise amplitudes observed in heat flow curves reflect the worms' motor activity. The noise amplitude curve, following exponential decay, is based on absolute values of the amplitudes of noise obtained for 20 minutes over the entire course of the experiment. The intersection of the sample curve with the background line defines the death of worms (Kirchhofer et al. Reference Kirchhofer, Vargas, Braissant, Dong, Wang, Vennerstrom and Keiser2011; Manneck et al. Reference Manneck, Braissant, Haggenmuller and Keiser2011). The nanocalorimeter offers a greater sensitivity, in the range of 20 nW. The microcalorimetry assay was performed three times, the nanocalorimetry assay was performed once.
xCELLigence System
The xCELLigence System (Roche Inc.) offers an automated real-time measurement of the cellular electrical impedance (Xing et al. Reference Xing, Zhu, Jackson, Gabos, Sun, Wang and Xu2005) across interdigitated micro-electrodes integrated on the bottom of the 96-well plates (E-plates). An innovative application of the system for nematode worms was recently described, monitoring motilities of Haemonchus contortus, Strongyloides ratti, Ancylostoma caninum and Schistosoma mansoni (Smout et al. Reference Smout, Kotze, Mccarthy and Loukas2010). Measurements were displayed in the RTCA controller software (Roche Inc.) The xCELLigence System was equilibrated either to room-temperature or to 37°C for 2 hours before the experiment was started. Then 100 L3 or stimulated L3 or one adult worm (in a volume of 100 μl) were added to the wells. Measurements started 10 minutes before the pre-warmed drugs were added (100 μl). The impedance was recorded in each well every minute for 72 hours post-incubation with drugs. The signal amplitudes (noise amplitudes) were analysed from each well. As described above, the intersection of the sample motility curve (exponential decay) with the background curve is the endpoint of the analysis and represents death of worms. The assay was performed three times.
Statistical analysis
All data were analysed and plotted in Excel (Microsoft Office 2003). The motility data were analysed with the Fisher's exact test (L3 survival), and Mann-Whitney U test (adults' viability), using StatsDirect (version 2.4.5; StatsDirect Ltd; Cheshire, UK). The correlations between the feeding inhibition assay and the acid phosphatase assay with the corresponding motility assay data were tested using the Spearman rank correlation coefficient, in StatsDirect. Microcalorimetry and xCELLigence raw data were plotted using R (R 2.12.0, R Development Core Team). The exponential decay curve was defined by the equation H0e−μt+c, where μ represents the decay rate of noise amplitudes (motor activity), H0 is the initial starting point, t is time and c is the short term noise of the calorimeter. The repartition of death time points over the course of the experiment was assessed using the Fisher's exact test (StatsDirect).
RESULTS
Larval and adult motility assay
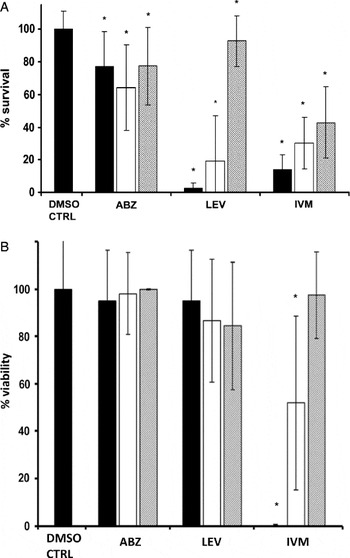
The activities of albendazole, levamisole and ivermectin on L3 and adult worms using the motility assay are summarised in Fig. 1. Briefly, ivermectin showed the best activity against both hookworm stages 72 hours after incubation start, with 100 μg/ml of the drug killing 86·1 and 100% of larvae and adults (both P-values ⩽0·001), respectively. Surviving larvae showed spastic movements, sometimes just at one end. Levamisole exhibited a high activity with only 2·4% of L3 surviving following incubation with 100 μg/ml of the drug for 72 hours (P<0·001). On the other hand adults were nearly unaffected by levamisole (viability >84%, all P values >0·05). Albendazole displayed a moderate effect against L3 (survival of 64·0–77·4% at 1–100 μg/ml, all P-values <0·001), but showed no effect against adults (all P values >0·05).
Anthelmintic activity of albendazole, levamisole and ivermectin against Ancylostoma ceylanicum L3 (A) and adult worms (B). The percentage survival or the viability scores are expressed as percentage of the controls. DMSO CTRL=DMSO control, ABZ=albendazole, LEV=levamisole, IVM=ivermectin. Black bars show 100 μg/ml; white bars show 10 μg/ml; striped bars show 1 μg/ml. The assays were conducted at least twice in triplicates. * p⩽0·05 (A: Fisher's exact test; B: Mann-Whitney U test).

Feeding inhibition assay
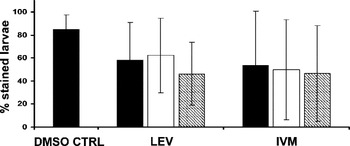
Levamisole and ivermectin were tested against stimulated L3 in the feeding inhibition assay (Fig. 2). On average, 84·9% of the larvae in the control wells displayed a fluorescent intestinal tract, which fulfils the criteria set by Moser et al. for a successful activation (Moser et al. Reference Moser, Freitas, Arasu and Gibson2005). Levamisole-treated parasites exhibited between 49·0 and 66·0% gut staining, whereas survival was 0% at all concentrations using the motility assay (not shown). Fluorescent guts were observed in 49·3 to 56·8% of larvae following incubation with ivermectin, while 47·3 to 74·4% still showed movement in the corresponding motility assay (not shown). With both treatments, no concentration-dependency and a poor reproducibility were observed. No correlation between the feeding inhibition assay and the corresponding motility data was found (Spearman rank correlation coefficient, ρ=0·15, P=0·233 for positive correlation).
Feeding inhibition assay. Percentage of stimulated L3 exhibiting fluorescent intestinal tract following treatment with levamisole or ivermectin. DMSO CTRL=DMSO control, LEV=levamisole, IVM=ivermectin. Black bars show 100 μg/ml; white bars show 10 μg/ml; striped bars show 1 μg/ml. Data points derive from three independent experiments.

Alamar Blue® assay
None of the tested stages (L3, stimulated L3 and adult worms) was able to convert resazurin into resorufin within 5 hours. The medium turned slowly violet only after 5 hours. Twenty-four hours post-incubation, the fluorescence intensity measured was not homogeneously distributed between wells, with emissions ranging from 3059–7427, compared to 2497 on average for the medium only.
MTT reduction assay
Following incubation of L3 and stimulated L3 with MTT, no reduction of the marker occurred and therefore neither the larvae nor the medium changed colour. Adult worms' internal tissues turned violet but their teguments remained colourless. In general, no reproducible staining pattern was observed within one treatment group (and among controls), and staining did not correspond to their capacity to move as observed with the motility assay. No reproducible absorbances could be measured at 588 nm.
Acid phosphatase activity assay
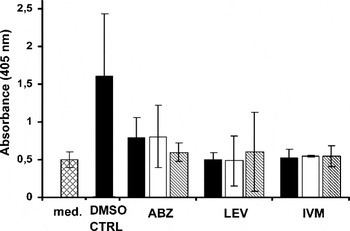
Neither L3 nor stimulated L3 triggered a colourimetric reaction following addition of pNPP (10 mM solution). Adult worms produced measurable amounts of the enzymes. The absorbance measured for control adult worms reached 1·6. However, the signal to noise ratio was low. The background noise produced by medium alone was high (0·5), similar to the absorbance of treated worms (0·48–0·81). In addition, no concentration-dependency was observed (Fig. 3). Finally, no correlation (Spearman rank correlation coefficient, ρ=0·24, P=0·11 for positive correlation) was determined between the results of the acid phosphatase secretion assay and the motility of the worms (assessed before the acid phosphatase activity assay was started).
Acid phosphatase activity assay for sensitivity of Ancylostoma ceylanicum adult worms to albendazole, levamisole and ivermectin. Med=medium only, DMSO CTRL=DMSO control, ABZ=albendazole, LEV=levamisole, IVM=ivermectin. Black bars show 100 μg/ml; white bars show 10 μg/ml; striped bars show 1 μg/ml. Data points derive from three independent experiments.

Isothermal micro- and nanocalorimetry
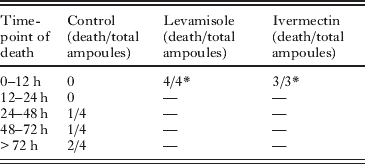
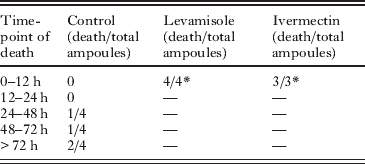
Microcalorimetry: Neither L3 nor stimulated L3 (up to 500 per ampoule) exhibited sufficient heat production for a stable signal. Preliminary experiments revealed that 8 worms was the minimum number of worms to measure a sufficiently large signal, in the range of 2–3 μW. Eight adult worms per ampoule were treated with 100 μg/ml levamisole, 100 μg/ml ivermectin, or the corresponding amount of DMSO. Mortality rates of adult worms were determined by comparing noise amplitudes in their heat flows, which derive from worm motor activities of drug-treated and control worms. The thermogenic noise of 8 dead worms was used as background noise (dotted line) and defined as 0·13 μW (not shown). Fig. 4 shows the heat flow pattern produced by control worms over 72 hours. The time-points of the death of worms are summarized in Table 1. Two control worms died between 24 and 72 hours post injection of DMSO, while 2 control worms were still alive at the end of the experiment. The noise signals were reduced to a level not different than that of dead control worms within 12 hours following addition of levamisole and ivermectin, significantly differently from the controls (both P=0·03).
Heat flow pattern of untreated adult Ancylostoma ceylanicum worms (n=8). The produced noise obtained for 20 minutes is averaged over 72 hours. Noise amplitude values follow exponential decay (solid line). The following equation was applied: H0e−μt+c, where μ represents the decay rate of noise amplitudes (motor activity), H0 is the initial starting point, t is time and c the short term noise of the microcalorimeter. The system background noise is shown as dotted line, defined as 0·13 μW. The intersection of the sample curve (solid line) with the background line (dotted line) is the endpoint of worm motility and corresponds to the death of worms.

Time-points of worms' death measured by isothermal microcalorimetry, over 72 h after treatment with 100 μg/ml levamisole, ivermectin or DMSO (8 worms per ampoule)
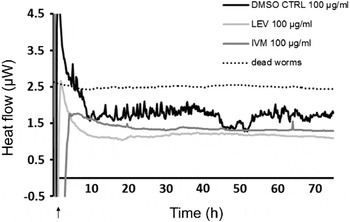
Nanocalorimetry: The absolute heat flow obtained from control worms after equilibration of the system (about 12 hours) remained in the range of 1·5–2·5 μW during the whole experiment (Fig. 5). Heat flows recorded from levamisole- and ivermectin-treated worms were not higher than about 1·5 μW, reflecting the drug effects. Signals from control and drug-treated worms remained stable over the whole experiment duration. Great noise amplitudes were observed in the control ampoule, whereas they were flattened in the treated ones, reflecting the loss of motor activities. The dead worms data were recorded in a separate experiment and no drug or medium was injected. The absolute heat flow from this ampoule was higher, in the range of 2·5 μW, but stable over time and displaying minimal noise amplitudes.
Absolute heat flow of Ancylostoma ceylanicum adult worms recorded with an isothermal nanocalorimeter over 72 hours. 100 μg/ml levamisole, ivermectin or DMSO were injected at time=0, indicated by the arrow.

xCELLigence System
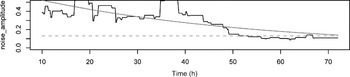
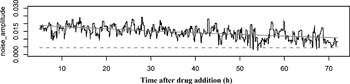
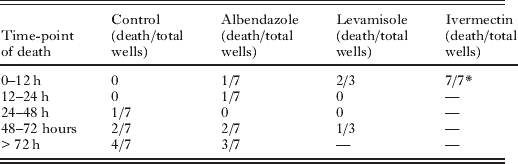
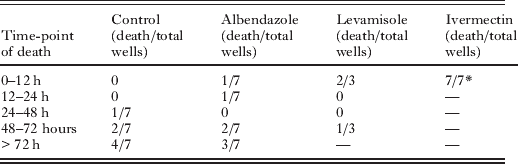
Electrical impedance was measured from adults but was not detected in the 100 L3 nor in the stimulated L3. One adult worm per well was treated with 100 μg/ml albendazole, 100 μg/ml levamisole, 100 μg/ml ivermectin, or the corresponding amount of DMSO. The noise produced by one dead worm was used as background noise (dotted line) and was 0·0044 (cell index, not shown). Out of 7 control worms analysed, 1 worm died between 24–48 hours and 2 worms died between 48–72 hours post-incubation with drugs. Four worms remained alive over the entire examination period of 72 hours (Table 2). Fig. 6 shows the impedance signal curve produced by a representative control worm, still alive 72 hours after addition of DMSO. Ivermectin reduced the impedance signal to a level not different than that of dead control worms within 12 hours following addition of the drug (P⩽0·01). No clear activity pattern was observed for albendazole and levamisole. Worms died at different time points following incubation with both drugs (Table 2) (both P-values >0·05).
Impedance pattern of adult Ancylostoma ceylanicum worms (n=1) measured with the xCELLigence System. The produced noise obtained for 20 minutes is averaged over 72 hours. Noise amplitude values follow exponential decay (solid line). The following equation was applied: H0e−μt+c, where μ represents the decay rate of noise amplitudes (motor activity), H0 is the initial starting point, t is time and c – the short term noise of the xCELLigence System. The system background noise is shown as dotted line, defined as 0·0044 (cell index). The intersection of the sample curve (solid line) with the background line (dotted line) is the endpoint of hookworm motility and corresponds to the death of worms.

Time-points of worms' death measured by the xCELLigence System, over 72 h after treatment with 100 μg/ml levamisole, ivermectin or DMSO (1 worm per well)
DISCUSSION
An ideal in vitro assay for drug sensitivity testing should be precise, sensitive, simple, fast and cost effective. Many in vitro assays used to study drug effects on nematodes have drawbacks (Taylor et al. Reference Taylor, Hunt and Goodyear2002). For instance, the egg-hatch test (Le Jambre, Reference Le Jambre1976) is only suitable for the benzimidazoles, since most drugs have no effect on A. ceylanicum egg hatching (Tritten et al., manuscript submitted). The motility meter was found to lack sufficient sensitivity to detect drug susceptibility of bovine intestinal nematode larval stages (Demeler et al. Reference Demeler, Kuttler and Von Samson-Himmelstjerna2010). Although cheap and simple, the motility assay is time consuming and prone to individual subjectivity. An improved drug sensitivity in vitro assay might therefore aid the development of novel hookworm drug therapies. In the present work, we studied the applicability of six alternative in vitro assays using both A. ceylanicum larval and adult stages, based on well-established methods and more recent technologies.
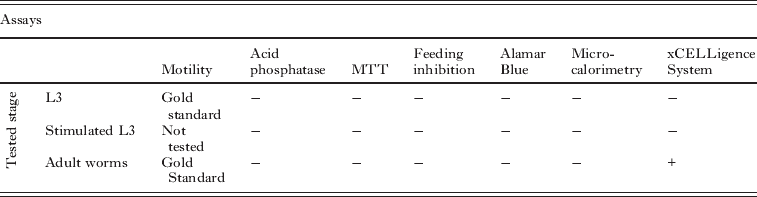
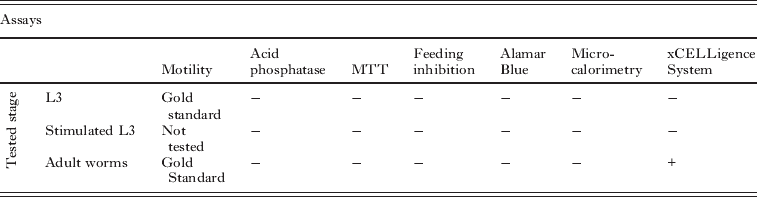
Our findings, summarized in Table 3, show that the xCELLigence System was the only method comparing favourably to the motility assay, whereas isothermal microcalorimetry, the colourimetric assays as well as the fluorescence-based test presented no advantage over the motility assay.
Summary of the tested assays and of their performance in testing drug susceptibility against A. ceylanicum larval and adult stages
None of the tested assays was suitable for stimulated or normal L3, the preferred stage for in vitro testing, since they survive for several weeks after collection, and the use of adult worms requires killing of the hamster host. Third-stage larvae are in the developmentally arrested non-feeding stage, where physiological processes are greatly reduced (Burnell et al. Reference Burnell, Houthoofd, O'hanlon and Vanfleteren2005; O'Riordan, Reference O'riordan and Burnell1989; O'Riordan, Reference O'riordan and Burnell1990), which might explain this result. Furthermore, their mouth and anus are sealed off (Cassada and Russell, Reference Cassada and Russell1975), limiting contacts with the environment. Several genes are differentially expressed upon feeding resumption by stimulated L3 (Moser et al. Reference Moser, Freitas, Arasu and Gibson2005), allowing a parasitic metabolic life, and adults are considered fully metabolically active (O'Riordan, Reference O'riordan and Burnell1989, Reference O'riordan and Burnell1990). However, it has been shown that the onset of development upon feeding resumption leads to more gene repressions than up-regulations (Moser et al. Reference Moser, Freitas, Arasu and Gibson2005).
The xCELLigence System offered the advantage of the format (96-well plate) and sufficiently strong signals could be obtained with only one adult worm per well. On the other hand, one hundred larvae did not yield a signal that could be detected and measured. Smout et al. showed that a large number of Haemonchus contortus or Strongyloides ratti larvae were necessary to exhibit measurable cell indices (Smout et al. Reference Smout, Kotze, Mccarthy and Loukas2010), which is a great disadvantage for medium- to high-throughput assays. The cost of the xCELLigence apparatus and the E-plates might also be a drawback. In addition, untreated control worms died faster than in other in vitro assays, presumably due to incubation in a small amount of medium (200 μl) for 72 hours. Hence, with the xCELLigence it is not possible to run drug assays for long periods.
It is interesting to note that according to xCELLigence, death occurred later in one third of the levamisole-treated worms, compared to data from microcalorimetry. It would be necessary to investigate a larger sample size to find out whether a variation in responsiveness to levamisole exists. However, it is possible that hookworms analysed were not equally fit at the start of the assay. In both assays, the results obtained following treatment with levamisole do not correspond to the motility data.
Although isothermal microcalorimetry is generally accepted as sensitive and accurate, several limitations were noted analysing drug effects on A. ceylanicum. First, it was necessary to place several adult hookworms per ampoule to obtain a sufficiently strong signal, a significant disadvantage in terms of costs and ethical requirements for research involving animal hosts. Similarly to the other assays analysed, it was not possible to run the assay with larval stages. Second, the injection of the drugs triggered a perturbation of the system with great noise amplitudes being recorded for at least 8 hours and it was therefore necessary to re-equilibrate the system for several hours before drug effects on the noise amplitudes produced by the worms could be measured. For fast acting drugs it is therefore not possible to determine the exact time point of death. Our findings are in contrast to studies using isothermal microcalorimetry with the helminths Schistosoma mansoni, Fasciola hepatica or Trichuris muris, where few worms generated sufficiently stable heat flows and quickly re-equilibrated following drug injections (Kirchhofer et al. Reference Kirchhofer, Vargas, Braissant, Dong, Wang, Vennerstrom and Keiser2011; Manneck et al. Reference Manneck, Braissant, Haggenmuller and Keiser2011; Silbereisen et al. Reference Silbereisen, Tritten and Keiser2011). Since the same machine was used in all of these experiments, the observed insensitivity of hookworms compared to whipworms cannot be explained by equipment differences.
Increased sensitivity and signal stability was obtained using nanocalorimetry. However, the observed heat flows in control versus treated worms were very similar and the baseline signal seems to shift from an experiment to the next, as it was observed with the higher absolute heat flow of dead worms, recorded separately. It is not unlikely that microcalorimetry might record some non-biological processes contributing to the higher baseline of dead worms. Possible processes might include chemical/enzymatic reaction initiated by the killing of the worms (performed using ethanol or freezing) or microcalorimeter baseline shift. As observed with microcalorimetry, the motor activity reflected by the noise amplitudes measured in the nanocalorimeter constituted the largest difference between control and treated conditions.
Our results obtained with the motility assay are in agreement with previous findings (Misra et al. Reference Misra, Visen and Katiyar1981; Richards et al. Reference Richards, Behnke and Duce1995; Kotze et al. Reference Kotze, Clifford, O'grady, Behnke and Mccarthy2004). Briefly, albendazole had a weak effect against L3 and a moderate effect against adult worms. The low activity observed against larvae at 100 μg/ml albendazole might be explained by precipitation of the drug in the medium. Levamisole showed excellent efficacy at 100–10 μg/ml against larvae, but lacked activity against adults. Ivermectin strongly affected larvae and adult worms.
The feeding inhibition assay was first described by Hawdon and Schad (Hawdon and Schad, Reference Hawdon and Schad1990, Reference Hawdon and Schad1992), and proved useful in studies with A. caninum (Kopp et al. Reference Kopp, Coleman, Mccarthy and Kotze2008). However, Kopp and colleagues identified lack of sufficient sensitivity with this assay, while testing resistance to pyrantel (Kopp et al. Reference Kopp, Coleman, Mccarthy and Kotze2008). We found this assay to be time-consuming and tricky because of the numerous preparation steps, where larvae can be lost or damaged. In addition, the staining intensity of worms was weak, although the exsheathment did occur. The feeding inhibition assay therefore does not offer an advantage over the motility assay.
Also none of the tested colourimetric assays was found to perform satisfactorily. In general, colourimetric assays are difficult to carry out with organisms as large as A. ceylanicum adult worms, whose size can vary, because the endpoints depend directly on the number of living cells (Mosmann, Reference Mosmann1983; Räz et al. Reference Räz, Iten, Grether-Buhler, Kaminsky and Brun1997). The Alamar Blue assay, which determines the metabolic mitochondrial biotransformation of resazurin into resorufin, was not suitable for larval stages. Furthermore, the conversion of resazurin into resorufin by adult worms was very slow (no fluorescent emission compared to medium within 5 hours), hence the applicability of the Alamar Blue assay was considered limited, in particular since this assay is highly sensitive to contaminations. We expected adult worms to reduce the dye much more quickly, as it is the case for Trichuris muris (Silbereisen et al. Reference Silbereisen, Tritten and Keiser2011) and therefore cannot explain this finding. It might be possible that either resazurin is not taken up sufficiently, or the mitochondrial metabolic activity is lower in A. ceylanicum than in other nematode species.
Upon incubation with MTT, larval stages did not detectably reduce MTT to formazan and revealed no staining. Formazan formation relies on pyridine nucleotides cofactors (Berridge and Tan, Reference Berridge and Tan1993), and as suggested before, larval and adult hookworm metabolisms might greatly differ. It was reported elsewhere that L3 of Caenorhabditis elegans were able to take up MTT, whereas those of H. contortus were not (James and Davey, Reference James and Davey2007). In the same report, the authors suggested that the protective sheath of the L3 might prevent dye uptake, presumably occurring by diffusion. In our experiments, adults got stained, however only in an inhomogeneous and non-reproducible manner, not supporting the hypothesis of dye diffusion. It is worth mentioning that ivermectin-treated worms, paralysed if not dead, were less intensively stained than control or levamisole-treated worms. Overall, our results support the suggestion that MTT uptake occurs via pharyngeal pumping (Smith et al. Reference Smith, Pontiggia, Waterman, Lichtenwalner and Wasserman2009).
Finally, neither L3 nor stimulated L3 were able to trigger any colourimetric reaction in the acid phosphatase assay. Results from the adult acid phosphatase activity assay showed no correlation with the adult motility assay. For example, while according to the motility assay, ivermectin-treated worms were dead, the acid phosphatase production by ivermectin-treated worms was still high at the highest concentration tested. It is possible, that ivermectin-treated worms might not be dead, but paralysed instead (Martin, Reference Martin1997), with some metabolic activity still taking place. In addition, no concentration dependency effect was observed for ivermectin using the acid phosphatase activity assay. In contrast to our study, Martinez-Grueiro showed a clear inhibition of Heligmosomoides bakeri adult worms' acid phosphatase production following treatment with ivermectin.
In conclusion, in the present work seven test systems were examined for their usefulness in investigations of drug effects on hookworms. With exception of the motility assay, the gold standard, none of the presented assays was applicable to L3. Using adult worms, the xCELLigence System compared favourably to the motility assay. It was found convenient especially for fast-acting drugs, required a minimal amount of worms and would offer the possibility to conduct a medium-throughput screening. The results are highly accurate, since a precise endpoint can be obtained. However, additional drugs should be tested to confirm the potential advantage of the xCELLigence System over the motility assay in hookworm assays.
ACKNOWLEDGEMENTS
J. Keiser is grateful to the Swiss National Science Foundation (project no. PPOOA-114941) for financial support. We thank Dr Cornelia Hertel for giving us access to the xCELLigence System, and Frédérique Chammartin for statistical support.