Introduction
In the quest to achieve carbon neutrality and reduce our overall footprints on the environment has become more crucial than ever before to realize new and sustainable green energy technologies, including energy generation, storage, and transportation.
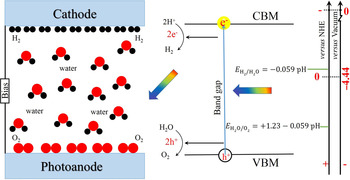
Looking into emerging energy technologies from materials research perspective, photocatalysis, often referred as “artificial photosynthesis,” is the light-induced acceleration of a reaction in the presence of a light-sensitive catalyst, similar to how plants use chlorophyll to convert water and carbon dioxide into oxygen and glucose fueled by sunlight.[ Reference Kapilashrami, Zhang, Liu, Hagfeldt and Guo 1 ] Artificial photosynthesis offers many exciting opportunities for large-scale production of hydrogen gas from water (Fig. 1) and decomposition of water-borne pollutants.
The principle of water splitting on a semiconductor catalyst. The energy level scale is indicated in the figure using either the NHE or vacuum level as reference. The energy difference between the E 0,NHE and E 0,vacuum is 4.44 eV.

As is evident in Fig. 1, crucial challenges associated with photocatalysis include: (i) band gap engineering of the light-sensitive catalyst to optimize the photoelectric effect in the visible wavelength range; (ii) effective separation of photoelectrons and their associated holes preventing their recombination; and (iii) alignment of the relative energy position of the catalyst to that of the reactant in order to discharge the same through a re-dox reaction facilitated by the photoelectrons and holes. Specifically for water splitting, to substantially photocatalyze the reaction without applying external potential, the conduction band minimum (CBM) of the catalyst should be higher than the potential of dihydrogen evolution (H2/H2O): H+ → H2 about 0 eV versus normal hydrogen electrode (NHE), while the valence band maximum (VBM) of the catalyst should be lower than the potential of dioxygen evolution (O2/H2O): O2− → O2 about 1.23 eV versus NHE[ Reference Fujishima and Honda 2 – Reference Jing, Guo, Liang, Zhang, Liu, Li, Shen, Liu, Hu and Zhang 6 ] as indicated in Fig. 1.
Reflecting over the myriad of available material complexes, metal oxide compounds at reduced scale, particularly 3d transition metal oxides (TMOs) have established their prominence in the field in light of their stability, cost-efficiency, and most importantly tunability of their electronic characteristics, which scale with their morphological properties and chemical composition.[ Reference Greiner, Helander, Tang, Wang, Qiu and Lu 7 – Reference Kapilashrami, Liu, Glans and Guo 16 ]
The band structure of 3d TMOs is typically altered and optimized through self-construction, i.e., alteration of their morphological (size/shape) and chemical properties (introduction of impurity elements into the host matrix substituting for either host cations and/or anions). Following recent progresses in material researches, we are not only able to synthesize nanoscale materials complexes with carefully altered and tailored properties with high reproducibility, but also evaluate important materials properties at high precision both ex situ and in situ/operando down at the atomic level with high precision to predict evolution and requirements in and for optimum performance.
We present herein an overview on synchrotron based x-ray spectroscopy and its implementation in materials development for energy application with focus on 3d TMOs. Specifically, this perspective is composed of following three parts: (i) The first part of this paper provides a detailed description of the principles and capabilities of soft x-ray spectroscopies, including x-ray absorption spectroscopy (XAS) and x-ray emission spectroscopy (XES) as well as associated spectral features. (ii) The second part of this paper describes the electronic structure of selected 3d TMOs and the evolution in the same upon alteration of their chemical composition and morphological properties. (iii) The third part of this paper reflects over recent development and advances in the in situ/operando spectroscopy technique that strengthens our efforts in developing new and sustainable green energy alternatives.
Application of synchrotron-based soft x-ray spectroscopy in energy research
Principles of synchrotron spectroscopy
Synchrotron radiation refers to polarized light/radiation of high brilliance produced from charged particles (e.g., electrons) traveling at relativistic speed along a curved trajectory. Synchrotron spectroscopy is the utilization of synchrotron radiation to elucidate details of the electron structure and molecular dynamics in matter. XAS and XES are two principle spectroscopic capabilities employed for detailed projection of the density of unoccupied and occupied states, respectively. Following excitation core levels electrons into higher energy states enables chemical/elemental and orbital selectivity.[ Reference Kapilashrami, Liu, Glans and Guo 16 – Reference Guo, Butorin, Wassdahl, Nordgren, Berastegut and Johansson 20 ]
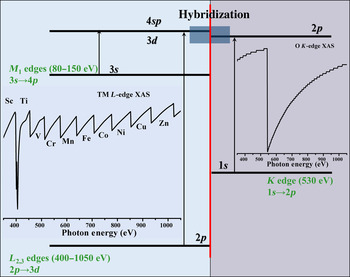
XAS is recognized by the excitation of core electrons to the conduction bands, governed by the dipole selection rule, which creates a vacancy at the core level that is re-populated following a decay of the electrons in the occupied density of states. The interaction between (soft) x-ray photons and condensed matter is so strong that the measureable intensity of transmitted photon flux would require ultra-thin and uniform sample slices, which is unrealistic for most of the materials of interest. Instead of direct recording the transmitted photon flux, the energy distribution as a function of the altering excitation energy by recording the decay process is employed to obtain an absorption spectrum. For a given element, different edges therein can be selectively excited, depending on the excitation energy that provides accurate information on band-to-band and orbital transitions (Fig. 2). Typically, XAS is recorded either in the bulk-sensitive total fluorescence yield (TFY) detection mode by measuring the emitted photons with a photodetector or in the surface-sensitive total electron yield (TEY) detection mode by recording the surface drain current. The TFY and TEY signals reflect sample information of probing depth up to several hundred nanometers and tens nanometers, respectively.[ Reference Ye, Kawase, Song, Feng, Liu, Marcus, Feng, Cairns, Guo and Zhu 21 ]
Principle of the transition process and simulated soft x-ray absorption spectrum of selected 3d TM reflecting their typical L-edge spectral features and K-edge spectral features of oxygen.

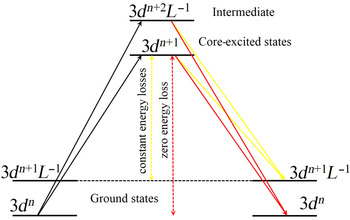
In contrast to XAS where the excitation energy is altered, in XES core electrons are excited at constant excitation energy and the emission is recorded (using a grating spectrometer wherein the intensity distribution as a function of photon energy) as core holes are re-populated by electrons in the occupied density of states. Following the decay route of valence electrons in the emission process, the detection depth of XES is hundred nanometers, as compared with few of nanometers in the case of XAS. Furthermore, emission spectroscopy is categorized in two techniques depending on whether core electrons are excited at energies far beyond the absorption edge a.k.a. normal x-ray emission (nr-XES) or at energies tuned to the absorption spectral features a.k.a. resonant inelastic x-ray scattering (RIXS). While nr-XES describes the total density of occupied states, RIXS relates to the eigenvalues of the ground states through the intermediate states. Figure 3 presents the typical energy-level diagram of a TMO where the spin–orbital splitting on the 2p and 3d has been simplified (L refers to the ligand – O and 3dn +1 is the electron transfer from ligand to TM cation).[ Reference Harada, Kinugasa, Eguchi, Matsubara, Kotani, Watanabe, Yagishita and Shin 22 ] Excitation of a valence electron at 3dn to 3dn +1 intermediate state gives rise to electron decay to the ground states of 3dn +1 L −1 and 3dn , giving rise to both energy loss (inelastic peaks) and zero energy-loss (elastic peak) spectral features.
The schematic band level diagram of RIXS process of the 3d TMOs.

Typical spectral features of 3d TMOs
TiO2 and Fe2O3 are amongst the most widely studied photoelectric materials complexes and two promising TMOs for photoelectric applications (particularly photocatalysis) in light of their readily tunable electronic properties and inherent chemical stability, biocompatibility, zero toxicity, and availability at low production cost.[ Reference Kapilashrami, Liu, Glans and Guo 16 ] In the following sections, we will discuss the electronic properties of intrinsic TiO2 and Fe2O3 and the evolution in the same upon alternation of their chemical composition and morphological properties by reflecting over their respective XAS and XES spectral features.
XAS spectral features of 3d TMOs
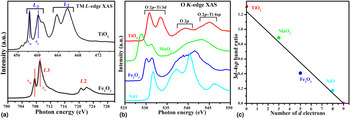
The absorption spectral features at the L-edge (L 2 and L 3) of transition metals (TMs) arise from 2p 1/2 and 2p 3/2 core levels, respectively, following spin–orbital coupling. The Ti L-edge of TiO2 and Fe L-edge XAS of Fe2O3 have been displayed in Fig. 4(a). In the case of TiO2, the L 3 and L 2 peaks arise from Ti 2p 3/2 and 2p 1/2 core transitions to unoccupied Ti 3d 5/2 and 3d 3/2 states and are typically observed in the energy range 458–462 and 462–468 eV, respectively. As shown for spectra of both TiO2 and Fe2O3, the L 2,3 edges further split to the t 2g and e g peaks following the crystal field splitting, which originates from the electrostatic field following repulsive interaction between 3d TMs cations and O anions.[ Reference Li, Wang, Zhao, Wang, Song and Sham 23 ] While e g orbital points toward the O site, which aligns with the electrostatic field orientation, t 2g orbital points between O sites. A stronger crystal field effect on the e g orbital results in a shift of e g toward higher energies further way from t 2g. In absorption spectra, the energy separation between e g and t 2g represents the crystal field strength.[ Reference Kronawitter, Bakke, Wheeler, Wang, Chang, Antoun, Zhang, Guo, Bent, Mao and Vayssieres 24 – Reference Krüger 26 ]
(a) Ti L-edge of TiO2 and Fe L-edge XAS of Fe2O3; (b) O K-edge XAS of TiO2, MnO2, Fe2O3, and NiO; (c) variation in 3d–4sp band intensity ratio as a function of the number of electrons in the TM 3d state, references of TiO2, MnO2, Fe2O3, and NiO, were applied to obtain the plot.

If we consider TiO2, the O K-edge XAS of the TMO reflect O 1s excitation to unoccupied O 2p states, O 2p–Ti 3d and O 2p–Ti 4sp hybridization.[ Reference Li, Wang, Zhao, Wang, Song and Sham 23 ] These features are typically grouped into two regions, below and above the ionization threshold recognized by (i) O 2p–Ti 3d (in the energy range 530–536 eV) and (ii) O 2p–Ti 4sp and O 2p (in the energy range 536–550 eV). Similar to the Ti L-edge XAS, the crystal field splitting of the 2p–3d hybridization is observed at about 530–536 eV in the O K-edge XAS. Figure 4(b) presents the XAS of few selected TMOs wherein the crystal field splitting varies depending on the electronic configuration of the TMO. While most 3d TMOs show similar O K-edge spectral profile, the same for ZnO deviates due to the 3d 10 configuration of the Zn cation, which results in the absence of O 2p–Zn 3d hybridization feature.[ Reference Kapilashrami, Kronawitter, Torndahl, Lindahl, Hultqvist, Wang, Chang, Mao and Guo 9 ]
The relative ratio between the spectral features above and below the ionization threshold relates to the number of partially unoccupied TM 3d states available for hybridization with unoccupied O 2p states. Upon plotting the band intensity ratio of the region below/above the ionization threshold against the 3d electrons numbers, the O K-edge XAS across the 3d TMOs in Fig. 4(b) can be quantitatively analyzed [Fig. 4(c)]. Furthermore, with shrinking of the metal 3d orbitals in the late 3d TMOs diminishes the p–d hybridization effects, leading to the termination of the linear interpolation at d 9 instead of d 10.[ Reference Kronawitter, Bakke, Wheeler, Wang, Chang, Antoun, Zhang, Guo, Bent, Mao and Vayssieres 24 ] As shown in Fig. 4(c), the relationship between the peaks intensities and the d electron number was fitted to be a linear function. The observed linear function between band intensity ratio and electron population in the TM 3d state in Fig. 4(b) provides a framework to roughly estimate the hybridization level between O 2p and metal 3d orbitals, particularly when studying interfaces of heterostructure TMOs, e.g., electron enrichment at the interface between Fe2O3 and TiO2.[ Reference Kronawitter, Bakke, Wheeler, Wang, Chang, Antoun, Zhang, Guo, Bent, Mao and Vayssieres 24 ]
XES spectral features of 3d TMOs
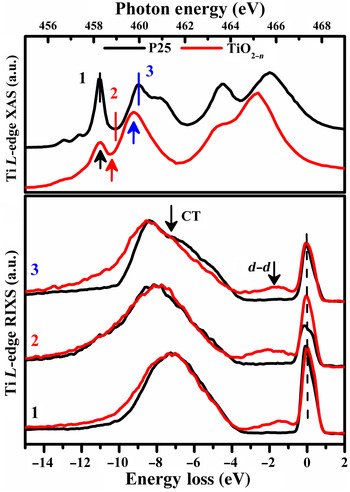
Similar to resonant Raman scattering, RIXS is plotted on an energy-loss scale. As indicated in Fig. 3, inelastic peaks with constant energy loss follow the elastic peak at 0 eV are detected since the energy of the excited states is measured following resonant excitation and de-excitation processes. Looking at the RIXS spectra of TiO2 films at excitation energies as indicated in Fig. 5 two main features are observed: (i) an elastic peak at 0 eV and (ii) inelastic features at −4 to −15 eV. Note, the inelastic peak comprised both fluorescence signals (from Ti 3d → 2p) and Raman scattering (originating from occupied O 2p orbitals to unoccupied Ti 3d orbitals).[ Reference Harada, Kinugasa, Eguchi, Matsubara, Kotani, Watanabe, Yagishita and Shin 22 , Reference Kronawitter, Bakke, Wheeler, Wang, Chang, Antoun, Zhang, Guo, Bent, Mao and Vayssieres 24 , Reference Guo, Glans, Liu, Chang and Vayssieres 25 ] The appearance of the energy-loss features indicates the occurrence of the strong Ti 3d–O 2p hybridization. For the RIXS spectra, d–d excitation feature as labeled in Fig. 5 is particularly interesting. The d–d excitation process, otherwise not allowed in the XAS process, is detected in the excitation and de-excitation process, once the 3d orbital is partially occupied. Given the 3d 0 configuration of Ti4+ ions in the TiO2 d–d excitation is not observed, as indicating in the Fig. 5. On the contrary, the d–d features at energy range of −0.6 to −3 eV is readily observed for TiO2−n sample.[ Reference Glawion, Heidler, Haverkort, Duda, Schmitt, Strocov, Monney, Zhou, Ruff, Sing and Claessen 27 , Reference Augustsson, Henningsson, Butorin, Siegbahn, Nordgren and Guo 28 ] The d–d excitation features originate from two scenarios. Assuming the 3d 1 configuration for sample TiO2−n , the 2p core level electron can be excited to the unoccupied Ti3+ t 2g and Ti3+ e g, once the excitation energy tuned at energy 1 and 2 as labeled in Fig. 5, respectively. Following the previous 3d electron at the occupied Ti3+ t 2g will refill the 2p core vacancy, leading to the formation of the d–d excitation features. These two features are named as Ti3+ t 2g resonance and Ti3+ e g resonance, corresponding to the selected excitation energy locating at t 2g and e g XAS resonances, respectively.[ Reference Kronawitter, Bakke, Wheeler, Wang, Chang, Antoun, Zhang, Guo, Bent, Mao and Vayssieres 24 ] The energy difference of the Ti3+ e g resonance d–d feature with respect to the elastic peak represents the magnitude of the crystal-field splitting, wherein the ground state is without the core hole potential effect.[ Reference Higuchi, Tsukamoto, Watanabe, Grush, Callcott, Perera, Ederer, Tokura, Harada, Tezuka and Shin 29 , Reference Chen, Dong, Asokan, Chen, Liu, Guo, Yang, Chen, Hsu, Chang and Wu 30 ]
Ti L-edge RIXS spectra (bottom panel) of P25–TiO2 and TiO2−n collected with excitation energies at the Ti L-edge XAS spectra (top panel). The RIXS spectra are plotted at energy loss scale by subtracting the emission energy from the corresponding excitation energies.

Electronic structure of TMOs
The overall band structure of TMOs, including the relative energy position of their energy band edges, local electronic structure surrounding the constituent atoms as well as chemical composition and morphological properties (size/shape) are crucial to their performance in photoelectrochemical reactions.[ Reference Ni, Leung, Leung and Sumathy 31 ] Particularly, down scaling the size of, e.g., nanoparticles (NPs) alters the electronic properties in that the energy levels in the materials become much more discrete and well defined.[ Reference Kapilashrami, Liu, Glans and Guo 16 ] Introduction of impurity elements into the 3d TMOs’ lattice may greatly alter their conduction and valence band, depending on the nature and concentration of the impurity elements.[ Reference Kapilashrami, Zhang, Liu, Hagfeldt and Guo 1 , Reference De Angelis, Di Valentin, Fantacci, Vittadini and Selloni 32 ] Since ultimately the local interaction between impurity elements and the host matrix including related alteration in the local charge symmetry surrounding the host atoms/molecules defines the materials overall properties and performance in devices. It is of great interest to establish a solid correlation between “synthesis—electronic structure—device performances”.
Studies of pristine 3d TMOs: size effects on the TiO2, Fe2O3, and ZnO
Alteration of the electronic properties following size reduction is often referred to as quantum confinement effect. One striking signature of this effect is the widening of the band gap.[ Reference Takagahara and Takeda 33 – Reference Raty, Galli, Bostedt, van Buuren and Terminello 35 ]
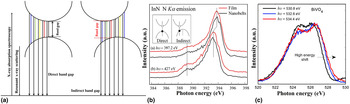
The band gap is typically categorized as: (i) direct or (ii) indirect. As demonstrated in Fig. 6(a), x-ray spectroscopy offers important capabilities to both project and differentiate between direct- and indirect band gaps. In the case of a direct band gap material complex, the highest onset position of the XES, i.e., the VBM, occurs at the excitation energy tuned at the lowest absorption energy, i.e., the CBM. Therefore, with increasing excitation energy, absorption to unoccupied states occurs well above the CBM, inducing the emission occurs lower than the VBM under the momentum conservation rule. Thus, the highest position of the emission spectra can be obtained when the excitation energy tuned at the CBM position. And as the excitation energy increased, the redshift of emission spectra will be observed. This process has been clearly recorded on the N K-edge RIXS spectra of IaN, showing as the redshift of the emission spectra since the excitation energy increasing from 397.2 to 427 eV [Fig. 6(b)].[ Reference Dong, Gou, Chen and Chang 36 ] On the contrary, in the case of indirect band gap semiconductor, the emission occurs at the lower lying occupied states than the VBM when the excitation energy tuned at the CBM position. When the excitation energy increases, the yielded emission occurs from the occupied state closer to the VBM, inducing a blueshift of the emission spectra with the increasing excitation energy starting from the CBM position. Therefore, RIXS spectra with the excitation energies in the vicinity of the absorption threshold are commonly monitored to judge the semiconductor band gap category. Through the RIXS investigations, the aforementioned blueshift of the x-ray emission, which corresponds to the occurrence of the indirect band gap, has been seen in diamond, Be chalcogenides, metal doped and pristine BiVO4, and Fe2O3.[ Reference Cooper, Gul, Toma, Chen, Liu, Guo, Ager, Yano and Sharp 37 – Reference Jovic, Laverock, Rettie, Zhou, Mullins, Singh, Lamoureux, Wilson, Su, Jovic, Bluhm, Sohnel and Smith 41 ]
(a) Schematic representation illustrating the excitation dependence RIXS process for direct and indirect band gap measurements. O K-edge RIXS spectra of BiVO4 with indirect band gap have been recorded in (b), while N K-edge RIXS spectra of InN with direct band gap have been recorded in (c). (b) Reprinted from Ref. Reference Dong, Gou, Chen and Chang36. Copyright (2007) with permission form Society of Photo Optical Instrumentation Engineers. (c) Reprinted from Ref. Reference Jovic, Laverock, Rettie, Zhou, Mullins, Singh, Lamoureux, Wilson, Su, Jovic, Bluhm, Sohnel and Smith41. Copyright (2015), with permission form The Royal Society of Chemistry.

To further demonstrate the correlation between size and band gap we refer to previous studies on the electronic properties of Fe2O3 by Vayssieres et al.[ Reference Gilbert, Frandsen, Maxey and Sherman 40 , Reference Vayssieres, Sathe, Butorin, Shuh, Nordgren and Guo 42 ] Previously, Gilbert et al. and Vayssieres et al. have investigated the size-dependent electronic structures evolutions of hematite. Gilbert et al. have monitored the band gap by using the O K-edge XAS/XES.[ Reference Gilbert, Frandsen, Maxey and Sherman 40 ] By tuning the excitation energies across the XAS onset through the e g feature position to above the non-resonant post-edge, a new state was clearly observed at the high-emission energy region. The blueshift of the emission spectra is a strong indication that Fe2O3 is an indirect band gap semiconductor.[ Reference Gilbert, Frandsen, Maxey and Sherman 40 ] Therefore, the band gap has been determined by measuring the energy differences between the inflection points near the CBM of the O K-edge XAS and VBM of the O K-edge nr-XES, respectively. As a consequence, the obtained bulk hematite band gap value showed great consistence with the value obtained from the optical spectroscopy. Following, the size effects in the electronic structure of Fe2O3 have been investigated by monitoring the bulk and nanoscale hematite NPs with three different sizes, namely the bulk materials, 30 and 8 nm NPs. By employing the O K-edge XAS/nr-XES spectra of these three samples, no detectable shifts have been noted. It indicated that the band gap values of hematite samples with particle size down to 8 nm were identical. However, it has also been demonstrated that significant quantum confinement effect occurred on the hematite ultrafine nanorod arrays.[ Reference Vayssieres, Sathe, Butorin, Shuh, Nordgren and Guo 42 ] Vayssieres et al. have monitored the band gap by using the Fe L-edge XES, including the nr-XES and RIXS. For the Fe L-edge nr-XES, two broad features L α and L β are observed, which originate from the transition from the 2p 1/2 and 2p 3/2 to the 3d orbital, respectively.[ Reference Duda, Nordgren, Dräger, Bocharov and Kirchner 43 ] The branching ratio of the L β /L α is directly influenced by non-radiative Coster–Kronig transition between L 2 and L 3 in the absorption process, which is determined by the band gap value.[ Reference Skinner, Bullen and Johnston 44 ] It has been well established that the higher band gap value gives rise to the higher intensity ratio of the I(L β )/I(L α ). Besides the judgment driving from the nr-XES, RIXS can also be employed to determine the band gap value. The 3d 5 configuration of the Fe cations in hematite induces the appearance of several well-identified d–d excitation and charge transfer features, which locate at 1.0, 2.5, 3.3, and 5.6 eV below the excitation energy.[ Reference Vayssieres, Sathe, Butorin, Shuh, Nordgren and Guo 42 , Reference Akl 45 ] The 1 eV energy-loss feature originates from the multiple excitation transition; the 3.3 and 5.6 eV features correspond to the charge transfer between the O 2p and Fe 3d bands; and the 2.5 eV feature reflects the band gap transition. It was found that the I(L β )/I(L α ) ratio increased and the band gap transition feature blueshifted when the nanorod diameter tuning from bulk down to 4–5 nm. The findings indicated that the quantum confinement effect occurred on the hematite nanorods. The widening of the ultrafine hematite nanorods band gap suggested that it is possible for the water photo-oxidation happens without external applied bias with well-designed material.
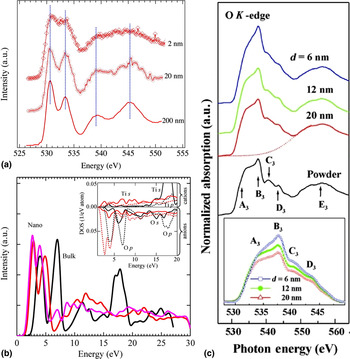
To further elucidate the quantum confinement effect on the TMOs. TiO2 NPs with different sizes have been investigated by experimental and theoretical simulations. The decrease of the NPs size induced the increment of the surface to volume ratio, which reflects the higher portion of the surface atoms in the NPs. Due to its core-like nature, the Ti 3d orbital becomes less dominating in comparison with the Ti 4s4p orbitals by decreasing the TiO2 particle size.[ Reference Vayssieres, Persson and Guo 46 ] The orbital ratio change can significantly alter the spectra profiles of the O K-edge XAS through hybridization between the Ti orbitals and O orbitals. O K-edge XAS of TiO2 NPs with sizes of 200, 20, and 2 nm are recorded in Fig. 7(a). By reducing the particle sizes, two spectra profiles changes can be observed: (i) the broadening of absorption features and (ii) the decreasing of the peaks intensities below the ionization threshold. They can be ascribed to the loss of the crystalline structures and the appearance of strong covalency at small particle size. The local average arrangements on the Ti sites induced the broadening of the absorption features when the TiO2 structures showed a loss of the long-range order at a length scale of about 1 nm.[ Reference Li, Wang, Zhao, Wang, Song and Sham 23 , Reference Li, Sham, Ye, Zhu and Guo 47 ] Moreover, the covalency reduced the occupation level of the original fully filled 2p states, thereby influencing the strength of the hybridization between O 2p and Ti 3d. Strong covalency of the NPs and decreased Ti 3d orbital portion induced the decreasing of the O 2p–Ti 3d features at reduced particle size. The computed spectra in Fig. 7(b) demonstrate a redshift with decreasing particle size that reduces VBM–CBM energy separation. Furthermore, observing from the XAS spectra profiles and combining with the aforementioned 3d–4sp band intensity ratio evolutions,[ Reference Kronawitter, Bakke, Wheeler, Wang, Chang, Antoun, Zhang, Guo, Bent, Mao and Vayssieres 24 ] it can be inferred that the number of unoccupied d states available for mixing with O 2p states decreased at the 2 nm TiO2 NPs with respect to that at the 200 nm TiO2. This shows great accordance with the size-dependent Ti 3d/4sp band distribution.
(a) The O K-edge XAS of TiO2 NPs with particle sizes of 2, 20, and 200 nm; (b) the simulation results of the O K-edge XAS of nano and bulk TiO2 NPs, the atomic resolved density of state of s- and p-like states were shown in the inset; (c) O K-edge XAS of ZnO quantum dots with particle sizes of 6, 12, 20 nm, the O K-edge spectra after background subtraction were shown in the inset. (a, b) Reprinted from Ref. Reference Vayssieres, Persson and Guo46. Copyright (2011), with permission form AIP publishing. (c) Reprinted from Ref. Reference Ray, Low, Tsai, Pao, Chiou, Yang, Chien, Pong, Tsai, Lin, Cheng, Hsieh and Lee48. Copyright (2007), with permission form AIP publishing.

As discussed above, the size effect in 3d TMOs can be derived from the surface curvature, which showed great relevance with the radial distribution of the 3d/4sp bands. One should be noted that this effect may not be the prominent reason for the spectra profiles changes of all the 3d TMOs. In the case of ZnO, Zn cation showed 3d 10 configuration, where no unoccupied d band sites are available for mixing with O 2p. The particle size-induced change of radial distribution of 3d/4sp bands is missing. Ray et al. have investigated the O K-edge XAS of ZnO quantum dots (QDs) with particle sizes from 20 nm down to 6 nm.[ Reference Ray, Low, Tsai, Pao, Chiou, Yang, Chien, Pong, Tsai, Lin, Cheng, Hsieh and Lee 48 ] The features B3 at the energy region of 530–545 eV showed a significant decrease, as shown in Fig. 7(c). Considering the signature quantum confinement effect induced optical properties were absent in the ZnO QDs and the particle size is higher than the exciton Bohr radius (1–2 nm), the quantum confinement effect was considered not to be responsible for the electronic structure changes. With angle-dependence XAS studies, it has been well documented that the feature B3 originated from the O 1s to O 2p π orbital transition, which lies along the c-axis of the QDs.[ Reference Chiou, Jan, Tsai, Bao, Pong, Tsai, Hong, Klauser, Lee, Wu and Liu 49 , Reference Guo, Vayssieres, Persson, Ahuja, Johansson and Nordgren 50 ] The decrease of the particle size made the particle much closer to the sphere and no favorable orbital orientation existed. As a consequence, the poor alignment between the O 2p π orbital and electric field was obtained, inducing the lower intensity of peaks B3. With the increase of the particle size, the orientation became ordered and good alignment between O 2p π orbitals and electric field was achieved, thereby stronger intensity of peak B3 was observed. Through these investigations, the size-dependent electronic structures on both cations and anions of various 3d TMOs have been well resolved by employing the soft x-ray spectroscopies. The unique advantages of soft x-ray spectroscopies have been well exhibited in these systems, due to the fact that the changes on the morphology (size/shape) directly tailored the materials properties by altering the electronic structures of the materials.
Properties of doped 3d TMOs, examples of TiO2
In addition to chemical composition, many materials properties (e.g., electronic, optical, and magnetic) can be altered by controlling the lattice defects (e.g., oxygen vacancies, cation vacancies, cation, and oxygen interstitials) therein, both at the surface and in bulk.[ Reference Kapilashrami, Zhang, Liu, Hagfeldt and Guo 1 , Reference De Angelis, Di Valentin, Fantacci, Vittadini and Selloni 32 , Reference Ra, Nakayama, Cho, Wakihara and Uchimoto 51 – Reference Wang, Zhang, Li, Li and Lin 58 ] Specifically, extraction/insertion of O atoms from/to stoichiometric materials may induces the reduction/oxidization properties as it disturbs the local charge symmetry surrounding the constituent atoms across the lattice, example includes: TiO2−x , Ti1+x O2 and TiO2+x , Ti1−x O2, respectively. Normally, these scenarios can be ascribed to the change of the oxygen environment. Few studies relevant to the oxygen interstitials are available up to date. It has shown that, oxygen rich is realized by forming a bridge oxygen bonding (–O–O– bond) instead of being stabilized in the crystal structure interstice.[ Reference De Angelis, Di Valentin, Fantacci, Vittadini and Selloni 32 ] The formation of the –O–O– bond required special treatment. Commonly, it was investigated in a model system and was constructed and studied on single-crystal samples, while the scanning tunneling microscope was always employed to monitor relevant properties.[ Reference Matthey, Wang, Wendt, Matthiesen, Schaub, Lægsgaard, Hammer and Besenbacher 59 , Reference Hansen, Lira, Galliker, Wang, Sprunger, Li, Lægsgaard, Wendt, Hammer and Besenbacher 60 ] Moreover, the theoretical simulations indicated that this kind of bond can be good electron trap, where the extra electrons from the O can occupy the σ* states. Consequently, the drastic change on the band structures can be predicted. Therefore, it can be expected that XAS/XES can provide further insight on this bond and its relevant properties, which is in a big lack up to now.
Oxygen vacancies, i.e., removal of a neutral oxygen atom, is readily induced by thermal annealing, UV illumination and/or doping.[ Reference Gray, McCain and Masse 61 , Reference Ganduglia-Pirovano, Hofmann and Sauer 62 ] It is generally recognized that formation of Ti3+ is favored with the creation of the various deficiencies at anion lattice sites,[ Reference Kapilashrami, Zhang, Liu, Hagfeldt and Guo 1 , Reference De Angelis, Di Valentin, Fantacci, Vittadini and Selloni 32 , Reference Chernyshova, Hochella and Madden 63 ] particularly existence of Ti3+ species following O vacancies has been widely studied.[ Reference Aiura, Nishihara, Haruyama, Komeda, Kodaira, Sakisaka, Maruyama and Kato 64 , Reference Henrich and Kurtz 65 ] Removal of an oxygen atom leaves two excess electrons at the vacancy site. Surrounding Ti sites include the original six folder Ti4+ and undercoordinated Ti3+. Each undercoordinated Ti3+ traps an excess electron, while second electron remains delocalized.[ Reference Mattioli, Alippi, Filippone, Caminiti and Amore Bonapasta 66 ] Reflecting back on the correlation between lattice defects and relative energy separation between CBM–VBM, oxygen vacancies in TiO2 can produce a delocalized donor state near the bottom of the conduction band, or a state within the band gap, 1 eV below the CBM.[ Reference De Angelis, Di Valentin, Fantacci, Vittadini and Selloni 32 , Reference Yan, Sun, Pan, Liu, Yao, Wu, Song, Zeng, Xie, Hu and Wei 67 ]
However, it should be noted that, the true origin of partially reduced TiO2, i.e., anion deficiency or excess of cations is still under debate.[ Reference De Angelis, Di Valentin, Fantacci, Vittadini and Selloni 32 ] Theoretical studies have indicated that (in most cases) the Ti interstitial model can be utilized in a way analogous to the of O vacancies model. Clearly, defect structure, i.e., nature and concentration of defects, strongly correlates to the electronic properties in semiconductors and play an important role towards improving and optimizing their overall functional properties.
As previously mentioned, there are various routes to induce oxygen vacancies. Among these, doping is still the most commonly employed method by which metal ions of lower valence state than parent 3d TM cations are introduced into the TMO host lattice.[ Reference Wang, Ye, Feng, Chi, Guo and Yin 68 ] Similarly, cation vacancies also induce partially occupied orbitals within the band gap, which is typically manifested as change in the relative intensity of t 2g/e g spectral features. Also, the peak intensities decrease and changes of the t 2g/e g peak intensity are easily detectable within systems.[ Reference Rusydi, Dhar, Roy Barman, Ariando, Motapothula, Yi, Santoso, Feng, Yang, Dai, Yakovlev, Ding, Wee, Neuber, Breese, Ruebhausen, Hilgenkamp and Venkatesan 69 , Reference Osorio-Guillén, Lany and Zunger 70 ] However, one should be aware of the solubility of impurity elements, before they agglomerate and result in phase separation, which is typically <5% for TMOs, depending on crystal structure. While this may seem low, it has been reported that even at doping concentrations as low as 0.1% (equal to 5 × 10¹⁹ donors/cm3) may induce the donor level within the band gap near the CBM.[ Reference Wang, Ye, Feng, Chi, Guo and Yin 68 ] Going back to TiO2, since formation of oxygen vacancy is always associated with the presence of Ti3+ Ti L-edge RIXS d–d spectral feature is a fingerprint on occurrence of oxygen-related lattice defects. Moreover, since the oxygen vacancy induced donor state overlaps with the CBM it decreases the probability of core level → conduction band transitions and clearly evident in the absorption spectra. As a result, the relative intensity at the O K-edge XAS pre-edge features decreases. This has clearly been exemplified by Yan et al. in Ref. Reference Yan, Sun, Pan, Liu, Yao, Wu, Song, Zeng, Xie, Hu and Wei67 and Wang et al. in Ref. Reference Wang, Ye, Feng, Chi, Guo and Yin68 wherein the authors have reported on the evolution in the TiO2 XAS upon doping with Co and Ba, respectively.[ Reference Yan, Sun, Pan, Liu, Yao, Wu, Song, Zeng, Xie, Hu and Wei 67 , Reference Wang, Ye, Feng, Chi, Guo and Yin 68 ]
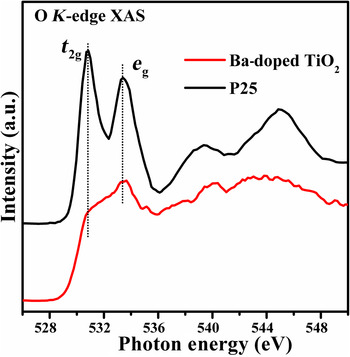
As shown in Fig. 8, the O K-edge XAS spectra showed dramatic changes with the introduction of the Ba to the TiO2 lattice. The decrease of the t 2g peak is a strong evidence for the formation of the oxygen vacancy. Also, the broad post-edge features can be attributed to the distortion of the crystal structure, which implies that the dopant also induced the change of the lattice structures.
The O K-edge XAS of P25–TiO2 and TiO2 doped with Ba. The O2p–Ti3d hybridization peak splits to t 2g and e g subpeaks due to the crystal-field strength.

Different from metal doping, non-metal doping influences the valence band via electronic transitions between the impurity 2p (N, F, and C) and 3p (S) orbitals, and the Ti 3d orbital.[ Reference Chen and Burda 71 ] Nitrogen doped TiO2 is a good example of non-metal doping induced localized states near the valence band region within the band gap. Further, the change of the anion sites altered the short-range and medium-range cation environments concomitant with the crystal structure change.[ Reference Braun, Akurati, Fortunato, Reifler, Ritter, Harvey, Vital and Graule 72 ] As a consequence, on the N-doped TiO2, it has been noted that: (i) the intensity of antibonding O2p absorption feature increased in the O K-edge XAS and (ii) the changes of the crystal structure favored the rearrangement of the e g orbitals, representing with an additional e g state peak formed between the t 2g and e g peaks.[ Reference Braun, Akurati, Fortunato, Reifler, Ritter, Harvey, Vital and Graule 72 ] Furthermore, due to the localized state in the band gap, the energy barrier of the formation of an oxygen vacancy was substantial reducing, favoring the creation of the oxygen vacancies at the high N-doping level.[ Reference De Angelis, Di Valentin, Fantacci, Vittadini and Selloni 32 ] With quantitative analysis on the O K-edge XAS of N-doped TiO2 and the catalytic performance, the structure–performance correlation is obtained.
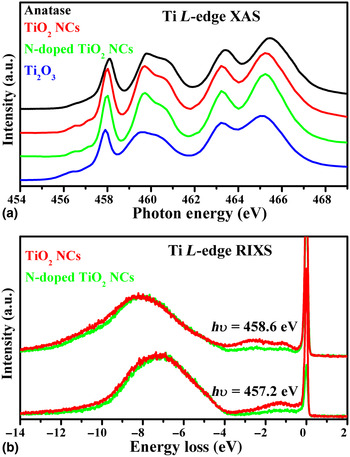
Besides, Chuang et al., has observed the electronic structures evolutions of N-doped TiO2 nanocrystals (NCs) by employing the Ti L-edge XAS and RIXS. Herein shows the electronic structure environment of nitrogen-doped TiO2 (NTO) and pristine TiO2 NCs by both the nanoscale and nitrogen-doping influences, shown in Figs. 9(a) and 9(b). The absorption peaks of TiO2 NCs are very similar to that of NTO NCs, and there are characterized as the anatase phase by the comparison of standard TiO2. The main spectral performance is recognized as Ti 2p to 3d transition, separated by 2p 1/2 and 2p 3/2 levels due to the spin–orbit coupling. Besides, the fine structure for t 2g and e g states is derived from the crystal field splitting of Ti 3d state, where its split structure can be indicative of the specific lattice and electronic environment. On the other hand, one 3d electron (3d 1 configuration) in the standard Ti2O3 exhibits the slightly energy-forward shift of peaks and wide spectral width in the absorption spectra, different from empty 3d electron in TiO2. Figure (b) shows the Ti L-edge resonant emission spectra of TiO2 and NTO NCs, to signify the variation of charge transfer and d–d excitation under the nanoscale dimension. The excitation energy selected to the Ti 2p–3d absorption region certifies the origin of Raman and fluorescence components different. The spectra as a function of the energy loss (from the excitation energy) exhibit two Raman peaks (0–4.0 eV) and one broad fluorescence structure (4.0–12.0 eV), while the incident x-ray energy is fixed at the excitation energy by hv = 457.2 and 458.6 eV [black bars in (a)]. The Raman peak at 1.3 eV in the lower excitation energy (457.2 eV) is shifted to higher energy-loss position at 2.6 eV as probed at the higher excitation energy (458.6 eV), attributed to the delocalized d–d electron interaction. The peak at 2.6 eV and new raising peak at 1.2 eV are assigned to the electron coupling between t 2g–e g and t 2g–t 2g sublevels individually.[ Reference Chen, Dong, Asokan, Chen, Liu, Guo, Yang, Chen, Hsu, Chang and Wu 30 ] The involvement of nitrogen-doping contribution lowers the signal of Raman peaks by the co-existed bonding environment between anion oxygen and nitrogen site. The band in the energy-loss range of 4.0 and 12.0 eV is assigned to the charge transfer hybridization, depending on the excitation energy selection. The detailed band-structure mapping of TiO2 NCs is shown in the previous literature. Its nitrogen doping into the pristine TiO2 NCs causes the band narrowing near the bottom level of valence band. In short, while the nanoscale fabrication is applied to reduce the bulk TiO2 materials, the lattice vacancy formation on the NCs surface results in the Ti3+(3d 1) transition and the following inter/intra d–d interaction. Taking into account the doping N atom, the hybridization between cation Ti and ligand O site give the insensitive change in the unoccupied state, but the unique Ti3+(3d 1) configuration offers the strong electron correlation to vary the valence band and d–d coupling during the absorption/de-excitation process.
(a) Ti 2p absorption spectrum of of TiO2, N:TiO2 NCs, and standard TiO2/Ti2O3 samples, by means of total electron yield mode. (b) Ti L-edge RIXS spectra measured at the different incident energies.

While computational studies on the role of oxygen vacancies on the electronic properties of 3d TMOs has reached a state of maturity systematic experimental practices on the same is lacking and needs to be addressed in order to bring further advances in materials development.
Recent progress on in situ/operando x-ray spectroscopy techniques
While x-ray spectroscopy (predominantly ex situ) has been widely employed to study materials properties in various capacities to gain deep insight on important materials properties, very few have taken a step further to investigate the same under nearly identical to operational conditions. Along this line, Braun et al. have contributed significantly on the pioneering of in situ/operando x-ray spectroscopy studies.[ Reference Braun, Sivula, Bora, Zhu, Zhang, Grätzel, Guo and Constable 73 , Reference Bora, Braun, Erat, Ariffin, Löhnert, Sivula, Töpfer, Grätzel, Manzke, Graule and Constable 74 ]
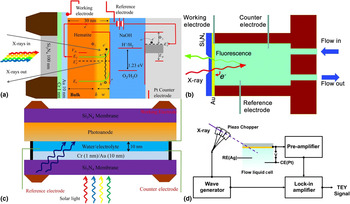
At first, hematite films on fluorine doped tin oxide (FTO) were treated under solar illumination with external electrochemical potential. It has shown that significant changes on the O K-edge XAS profiles occurred on the post-treated sample, including the changes of peaks intensities and the appearance of a new feature between the O2p–Fe3d and O2p–Fe4sp features.[ Reference Bora, Braun, Erat, Ariffin, Löhnert, Sivula, Töpfer, Grätzel, Manzke, Graule and Constable 74 ] The newly formed feature has been confirmed to be relative to a state near the VBM, origination from the transition from O 1s to the upper Hubbard band with a strong Fe 3d character. This observation suggested that the electronic structures of hematite changed during the electrochemical oxidation process. With further studies, it has found that the spectral profiles resembled those of the Si-doped hematite well, providing further support for the origination of the potential induced electronic structure changes. Inspired and promoted by this work, Braun et al, utilized an in situ/operando design to achieve the direct observation of the electronic structures of an operating 1% Si-doped hematite photoanode that was used to catalyze photoelectrochemical water splitting.[ Reference Braun, Sivula, Bora, Zhu, Zhang, Grätzel, Guo and Constable 73 , Reference Axnanda, Crumlin, Mao, Rani, Chang, Karlsson, Edwards, Lundqvist, Moberg, Ross, Hussain and Liu 75 ] It has shown that, O K-edge XAS of the photoanode did not show significant change with external potential applied in the dark condition. On the contrary, two new features formed when the external potential applied between 300 and 700 meV with solar light illumination. The two newly formed features are ascribed to an O 2p-type hole transition into the charge transfer band and the strong Fe 3d-type hole transition into the upper Hubbard band, respectively, from low to high-energy region. This is the first time to carry out the direct in situ/operando analysis of the electronic structure of a photoanode. A large portion of the reason of the successful operated experiment should be ascribed to the well-performed in situ/operando electrochemical cells. The schematic diagram of the experimental device has been displayed in Figs. 10(a) and 10(b).
(a, b) The schematic representation of cell assembly and mapping of the in situ/operando x-ray cell; (c) the model of a newly developed cell, the sunlight and x-ray beams go through the electrolyte layer and the electrode/electrolyte interface can be observed; (d) a x-ray modulate device that can separate the electrochemical current and x-ray beam induced current, which can provide clean TEY signal at the electrode/electrolyte interface. (a) Reprinted from Ref. Reference Braun, Sivula, Bora, Zhu, Zhang, Grätzel, Guo and Constable73. Copyright (2012), with permission form American Chemical Society. (b, d) Reprinted from Ref. Reference Wu, Weatherup and Salmeron77. Copyright (2015), with permission form The Royal Society of Chemistry.

Soft x-ray region, such as O K-edge and TM L-edge, measurements require vacuum condition because of the strong interactions between photons and gas molecules under ambient pressures. The vacuum requirement makes it challenging to carry out direct measurements on liquid and/or solid layers using conventional experimental setups. One strategy to overcome the pressure gap between the measurement system and the reaction system is to use x-ray transparent membrane to encapsulate liquid containing reaction system. With substantial efforts in instrument development, such encapsulation or liquid cell strategy has been proved to work well. Common materials for such x-ray transparent membranes include Si3N4, SiO2, Si, and graphene. Of them, Si3N4 window is the most commonly employed material to separate the cell chamber from the UHV (ultrahigh-vacuum) system. The Si3N4 window (typically 100 nm) can tolerate up to 1 MPa pressure difference, while ensuring the sufficient x-ray transition. The liquid layer (electrolyte) was incorporated in the cell by the Si3N4 window, and the liquid inlet and outlet allowed refreshing electrolytes during the experiments. The Si3N4 window was coated with Cr and Au to improve the conductivity and the adhesive to stabilize the hematite anode. This multilayer film acted as the working electrode, while the Pt wire and Ag/AgCl were employed as counter and reference electrodes, respectively. The three-electrode configuration made it possible to run electrochemistry inside the cell and perform in situ/operando soft-x-ray absorption spectroscopy (sXAS) measurements. During the electrochemical process, the hematite film was controlled to be either in dark or under illuminated with a solar simulator, the light of which was directed through the Si3N4 window. This specially designed device facilitated the in situ/operando studies of catalyst that can be utilized in photochemical and electrochemical reactions.
Classic electrochemistry theories, mostly continuum theories, suggested that electrode/electrolyte interface plays a vital role in various electrochemical systems. It is crucially important to understand the interfacial properties involved in relevant electrochemical reactions to achieve optimum performance of the electrochemical devices. Therefore, the capability to directly and accurately characterize the properties of the interfaces is extremely important to the energy community. In most work, since the mean free path of electron is generally low (a few nanometers), the emitted electrons cannot pass through the Si3N4 window, only FY signal can be recorded to characterize the bulk liquid and/or solid layers. Consequently, the obtained XAS signal is dominated by the buried sub-layer of films, while the electrode/electrolyte interface signals are not prominent, due to the large detection depth of fluorescence signal. Thereby, some new cell designs have been proposed, which may be helpful to get more accurate information relevant to the electrode/electrolyte interface, as shown in Fig. 10(c). A small modification is applied on the previous cell configuration. In this design, the thickness of the electrolyte has been controlled to be a thin layer. By reducing the thickness of the liquid layer and replacing the counter cell body with a Si3N4 window, it is able to directly monitor the front side of the materials of interest, which is the surface immediately attached to the electrolyte. Considering the attenuation of x-rays through the electrolyte, the detection depth is highly reduced, wherein more surface relevant information can be provided in comparison with that detected from the backside. One obvious shortage of this experimental setup is that this design only allows for probing the changes on the catalyst cation site, due to the interruption of the electrolyte signal with strong oxygen contribution. Considering the strong hybridization between the O and cations in 3d TMOs, the information obtained from this design is still valuable for the better interpretation of the electrode/electrolyte interface under operation.
As discussed in the previous sections, the TEY detection mode, which originates from the measurement of the secondary electron cascade, offers more surface sensitive information compared with the TFY detection mode. This has fueled up the scientists to monitor the interfacial properties under TEY detection mode. With proper modifications on the cell configuration shown in Fig. 10(b), the TEY signal can be recorded under open circle potential state by monitoring the secondary electrode cascade through the working electrode. However, this approach meets a big technical challenge under reaction conditions with external voltage, ascribing to the interrupt of the electrochemical potential induced ionic current. The reaction-related ionic current is several orders of magnitude higher compared with the photon-induced current. As a result, the TEY measurements were hindered under the operando condition. With substantial efforts devoted to the instrument development, a vacuum-capable liquid cell and an x-ray modulation system were developed. By applying this system, the dominant ionic current can be separated from the tiny TEY current via a frequency modulation method under electrochemical conditions. Specifically, this system contains a three-electrode vacuum-based liquid cell, a high-frequency chopper, and a lock-in amplifier, as shown in Fig. 10(d).[ Reference Velasco-Velez, Wu, Pascal, Wan, Guo, Prendergast and Salmeron 76 , Reference Wu, Weatherup and Salmeron 77 ] A piezo-actuated chopper was introduced to modulate the incoming x-ray beam at a designed frequency. Intermittent x-ray generates an AC component in the overall current (including both ionic and TEY current), which can then be filtered out using lock-in amplifiers and other necessary electronics. The new development of in situ/operando interface-sensitive sXAS provides new opportunities to investigate various solid/liquid interfaces in various important electrochemical systems. Combining this state-of-the-art x-ray modulation device setup and the in situ/operando cell design showing in Fig. 10(c), the electrode/electrolyte surface and buried subsurface can be simultaneously detect by TEY and TFY, respectively, providing better understanding on the properties of the 3d TMOs under operating condition.
These three different vacuum-capable cells combining with the in situ/operando sXAS method enable the studies of different aspects of the electrode/electrolyte interface under reaction conditions, for instance the adsorption and deposition of solute species on electrode surface in Mg-ion batteries, morphological and chemical changes of graphene-based electrode under the influence of electrolytes and potentials, and potential-dependent orientations of interfacial solvent molecules at Au/water interface, just to name a few. These examples have demonstrated the capability of in situ/operando sXAS techniques in the investigation of different aspects of the solid/liquid interfaces. Considering the interference of the oxygen signals in the electrolyte, the observations on the oxygen signal can only be achieved from the backside, where bulk-sensitive signals are recorded. Therefore, the interfacial studies on the cation sites (TMs) can be valuable information for the studies of 3d TMOs properties during a photoelectrochemical reaction. We hope that the in situ/operando characterization basin on the cell configurations shown in Figs. 10(c) and 10(d) can provide exciting new opportunities for the scientists to take a closer look at the electrode/electrolyte interfaces and open the way to the investigation of various solid/liquid interfaces in the important heterogeneous reactions evolved in the photoelectrocatalysts field.
Conclusion and outlook
The cases showcased in this perspective include investigation of self-constructed and doped 3d TMOs, and introductions of in situ/operando x-ray cell designs that the unique advantages of synchrotron based x-ray spectroscopy. Self-constructions of 3d TMOs are mainly realized by controlling morphological properties. Introducing impurities to the 3d TMOs significantly influence the band structure as localized impurity states are formed closely above or below the VBM and CBM, respectively. In situ/operando characterization combines unique capabilities to emanate fingerprints on the electronic structure (on surface, at interfaces, and in bulk), band gap, and band levels in real-time under conditions nearly identical to operational mode. This together with the ability to tailor the intrinsic properties of functional semiconductors at reduced scale and manipulate the morphological properties not only holds great promise for advancement in the field of renewable energy, but also offers great insight into the fundamental materials properties. Owing to the spatial confined, we focused on the application of TMOs on the field of photocatalysis, it should be noted that 3d TMOs based materials can also be employed in other renewable energy technical applications including Li-ion cells, non-photoelectrocatalysis and thermoelectric materials. We hope this perspective can also open the way to the investigations of various systems relating to these techniques.
Finally, it should be mentioned that, even if the application of photoelectron spectroscopy (PES) to the 3d TMOs studies is highly limited and interrupted by the capping agent and surface residential, the information driving from the PES are still valuable. The PES provides the information of the energy difference from the core level to the Fermi level, making it a strong support to the XAS/XES information for better interpretation of the electronic structures near the Fermi level. One way to circumvent the detection depth issue is to increase the x-rays source to higher photon energies, such as pushing to 2000 eV or above. Also, if tender x-rays are utilized as excitation source, some photochemical and electrochemical systems can be combined to provide in situ/operando investigations, which is beyond our topic in this perspective and have been detailed in other works.[ Reference Axnanda, Crumlin, Mao, Rani, Chang, Karlsson, Edwards, Lundqvist, Moberg, Ross, Hussain and Liu 75 , Reference Wu, Weatherup and Salmeron 77 ]
One important point that needs to be addressed is the consequence of exposing a specimen to a highly energetic probe. Continuous illumination with high flux x-rays and the subsequently x-ray-induced emitting electrons may not only deteriorate sensitive samples (e.g., biological samples), but also lead to unintentional electron doping, which will falsify information of the electronic structure. Thus, it is important to take appropriate precautions to reduce the negative impact of x-ray radiation, e.g., reducing the x-ray flux, defocusing x-ray beams to low the photon density, and applying cooling to the samples.
We hope all the information can provide better insight into the 3d TMOs materials synthesis and characterizations and finally achieve the further improvements of relevant to energy application.
Acknowledgments
The Advanced Light Source is supported by the Director, Office of Science, Office of Basic Energy Sciences, of the U.S. Department of Energy under Contract No. DE-AC02-05CH11231. Y.Y. acknowledges the support of ALS Doctoral Fellowship. C.H.C. acknowledges financial support from projects 104-2112-M-032-005-MY2. The XAS and RIXS experiments at the ALS were performed on the beamlines 6.3.1.2 and 8.0.1.4. High-resolution Ti L-edge RIXS experiments were carried jointly by the University of Tokyo on beamline 7.0 LSU at SPring-8, Japan (under Proposal No. 2012A7428, 2012B7438, and 2013A7450). The authors thank Yoshihisa Harada's group for the technical support.