1. Introduction
Climate change is likely to be problematic for the food security of farmers in Pakistan. Annual average mean temperatures in the country have increased by 0.47 °C since 1960, with current projections from regional climate models predicting that temperatures in the last quarter of this century will increase by around 3 °C relative to 1961–90 (Chaudhry et al., Reference Chaudhry, Mahmood, Rasul and Afzaal2009; Islam et al., Reference Islam, Rehman and Sheikh2009). Observed rainfall has also become more erratic with extreme precipitation events now increasingly common (Turner and Annamalai, Reference Turner and Annamalai2012; Hijioka et al., Reference Hijioka, Lin, Pereira, Corlett, Cui, Insarov, Lasco, Lindgren, Surjan, Barros, Field, Dokken, Mastrandrea, Mach, Bilir, Chatterjee, Ebi, Estrada, Genova, Girma, Kissel, Levy, MacCracken, Mastrandrea and White2014). As a largely arid country, future climate change is likely to exacerbate already challenging growing conditions. With 45 per cent of the labour force employed in agriculture and 24 per cent of gross domestic product derived from the agricultural sector (Government of Pakistan, 2010), the resilience of agricultural production to climate change is of high importance to the continued development of Pakistan's economy.
Many studies predict that climate change will have a negative effect on average crop yields (Auffhammer and Schlenker, Reference Auffhammer and Schlenker2014). Economic studies typically estimate the cost of climate change using cross-sectional (Mendelsohn et al., Reference Mendelsohn, Nordhaus and Shaw1994) or panel estimation techniques (Deschenes and Greenstone, Reference Deschenes and Greenstone2007). Similar methods applied in Pakistan have estimated significant negative effects due to climate change for widely-grown staple crops like rice and wheat (Siddiqui et al., Reference Siddiqui, Samad, Nasir and Jalil2012). What is less clear from these approaches, however, is the impact that adaptation might have in offsetting the effects of climate change. Whether effective means of adaptation can be identified is a key part of reducing the uncertainty of climate impacts and informing policy about how best to reduce these costs in the future (Fankhauser et al., Reference Fankhauser, Smith and Tol1999; Auffhammer and Schlenker, Reference Auffhammer and Schlenker2014).
To estimate the impact of adaptation, we study its role in explaining the crop productivity of farmers who have already altered their agricultural activities in response to perceived changes in climate. We focus our interest on autonomous adaptations, which are those undertaken by individual farmers.Footnote 1 These adaptations are key to altering agricultural systems in the future, given that they are likely to be implemented most efficiently based on farmers’ private interests (Mendelsohn, Reference Mendelsohn2000). Identifying the impact that adaptation measures have on current yields is important to understanding whether already available technologies or practices could ameliorate projected adverse impacts of climate change. In addition, by measuring the impact of adaptation on current farm yields, we consider whether there are gains to food security in the short-term. If such gains exist, identifying barriers to adaptation and encouraging use of these practices should be a primary consideration for policymakers interested in immediate economic development goals.
This paper is the first to study the impact of climate change adaptation strategies in Pakistan.Footnote 2 We use a new cross-sectional data set collected in 2013 from a specifically designed survey of 1422 farm households of the Sindh and Punjab provinces. The study was conducted to understand how agricultural households in the major agricultural areas of the country undertake agricultural production and how this is affected by a range of household and institutional factors. The survey also collected detailed information on the range of adaptation strategies that farmers use to adapt to climate change. The various strategies employed include switching crop types or varieties, changing farm inputs, as well as soil and water conservation practices.
The decision to employ adaptation practices may be the result of both observable and unobservable differences between farmers, so careful treatment of selection into adaptation is required in order to identify causal effects. Our data mean that we are limited to cross-sectional estimators to address these important empirical issues. Our identification strategy uses two approaches which control first for selection on observables, and then for selection on unobservables following Di Falco et al. (Reference Di Falco, Veronesi and Yesuf2011). A suite of tests establishes robustness in each case. In this way we estimate the impact for farmers that adapted and the potential gain for non-adapting farmers.
Unlike previous studies of this type, e.g., Di Falco et al. (Reference Di Falco, Veronesi and Yesuf2011), our analysis is undertaken at the crop-level. We separately estimate the impact that adaptation has on the productivity of two of the most widely grown crops in Pakistan: wheat and rice. Since climate change may affect the productivity of these crops unevenly (Siddiqui et al., Reference Siddiqui, Samad, Nasir and Jalil2012) and agronomic constraints and farm management options differ across these crops, it is important to understand whether adaptation has heterogeneous effects for different crops. Additionally, consideration of the institutional determinants and constraints to adaptation is of high interest in a country with a complex mix of formal and informal institutions. Identifying the key determinants of adaption to climate change, and the chief constraints, will provide assistance to policymakers in their attempts to design adaptation policies (Di Falco, Reference Di Falco2014).
The results of this study show that the productive benefits of adaptation differ between rice and wheat, and also across farmers. For wheat, we estimate a positive but not statistically significant impact of adaptation for both observed and unobserved selection. For rice, however, the estimated impact implies productive gains of around 20 per cent accounting for observable covariates and 9 per cent when accounting for unobservable factors. For both crops there is evidence of selection into adaptation suggesting that farmers who have adapted to climate change in Pakistan are more productive than the average farmer. There is also suggestive evidence about characteristics that drive the decision to adapt. Credit is important for adaptation, but only in particular forms. Formal credit is positively associated with adaptation, while households that received credit from informal sources, such as middlemen, were significantly less likely to adapt. This points to the importance of a well-functioning formal credit market for funding changes in farm practices. There also seems to be significant scope to expand the reach of extension services to encourage adaptation since these services are only utilised by a small proportion of the sample. Finally, the estimated potential gains from adaptation for non-adapting farmers are consistently positive across specifications. The fact that this group does not adapt despite the positive potential gains is an indication of either significant transaction costs to adaptation for this group, or the need for large increases in complementary inputs that are unavailable to non-adapters.
From a practical perspective, this paper offers a useful methodological approach to evaluating the impact of and constraints to adaptation. The results will be helpful for the Punjab and Sindh's Planning and Development Departments (P&DDs) in their ongoing evaluation of climate-related crop losses at the national and regional level. In particular the results identify some of the critical regional and crop-specific factors that provincial and national governments can address in implementing the priorities of the Provincial and National Climate Change Policies in a way that complements agricultural development more generally.Footnote 3
The remainder of the paper is structured as follows. Section 2 describes the survey and the variables used in the paper. Section 3 outlines the empirical specification of the study with section 4 presenting the results. Finally, section 5 discusses implications of the results.
2. Data
2.1 Data collection
We use data collected during April–June 2013 from a detailed household survey to specifically address the determinants and impact of climate change adaptation for agricultural households in Pakistan. A copy of the survey is available in online appendix B. The survey collected data on agricultural practices, households characteristics, as well as a range of institutional characteristics. In total, 1422 households were surveyed in the provinces of Sindh and Punjab, the two most commercially important agricultural areas. Within these provinces, seven sites were then chosen to reflect a range of agro-climatic conditions and cropping patterns. To ensure this variation in our dataset, the Pakistan Meteorological Department rendered sub-district scale (25 km resolution) average annual precipitation and temperature data from 1990–2012. Two of the four Punjab sites are in a rainfed or barani belt, while the other two are in a cotton/wheat belt; and, of the three Sindh sites, two are also in the cotton/wheat category, while one is a rice/other category. The non-barani sites are predominantly irrigated, either through surface or groundwater.
We followed a multi-stage stratified cluster sampling approach following the approach used by the Pakistan Bureau of Statistics. Within the two selected districts (Sindh and Punjab), Union Councils were randomly selected and villages (the clusters) were then randomly sampled with probability proportional to population. The sampling was stratified by Union Councils with large (>10) or small (<=10) numbers of villages, and no less than 10 villages and up to 15 were selected within each strata. Households were also stratified into three bands according to farm size: small farmers (<12.5 acre holding), medium (>12.5 acres but <24 acres) and large (>24 acres). For both Punjab and Sindh, we determined the appropriate sample size based on a 95 per cent confidence interval for the estimates. In sum, this sampling approach was taken to produce a sample that was representative at the regional level with the objective of informing policy.
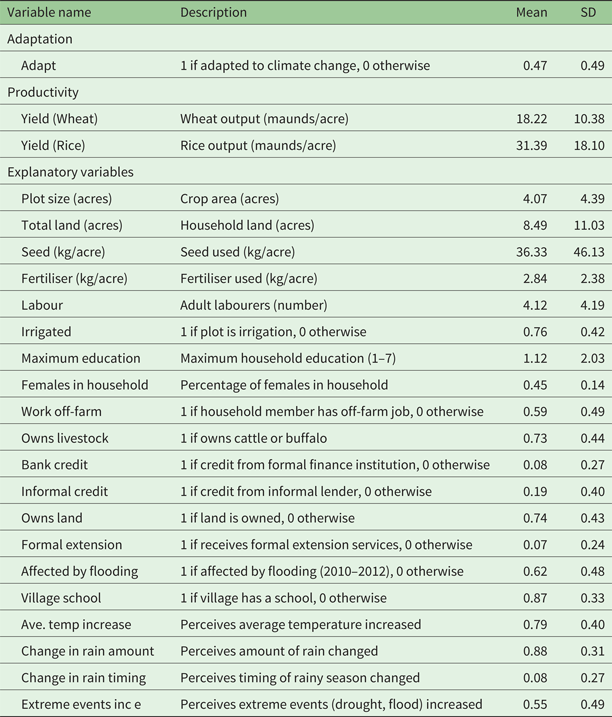
Survey modules on household characteristics, farm production and inputs, institutional features, and adaptation practices were collected as part of the survey. Table 1 summarises variables used in the present study and their sample mean for sample households.
Variable summary

2.2 Definition of adaptation
In this paper, we are careful to focus only on actions taken by farmers in response to or anticipation of factors attributed to climate change. Since farmers may undertake some of these strategies as part of the process of agricultural development, we require that these strategies be undertaken in response to climate change for it to constitute adaptation. Accordingly, in one section of the survey, farmers were asked: ‘How has your household adapted to cope with climatic changes?’Footnote 4 For the present study, our interest is in the impact of autonomous, on-farm adaptation measures on productivity. In the survey, some farmers identified off-farm work as their adaptation strategy. We do not include this strategy in our definition of adaptation since its impact on farm productivity is ambiguous, although we include this variable in the set of controls to study.Footnote 5 Similarly, we further exclude public infrastructure investments, such as damming, since these are not part of the farmers adaptation choice set.
On-farm adaptation strategies can be grouped into categories. These are alterations in crop timing, crop switching, agricultural inputs, or the adoption of soil or water conservation technologies. These are listed and described in detail in table A1 in the online appendix. The majority of farmers use a combination of these strategies, with the average number of strategies undertaken by farmers being 2.14.Footnote 6
Changing crop timing can avoid planting or harvesting during adverse seasonal climatic conditions. For instance, higher average temperatures may mean that the planting of summer crops needs to be brought forward to reduce exposure to high temperatures in early growing stages. Survey responses showed that 25 per cent of farmers who adapted used this strategy. Of those who changed crop timings, the majority had reverted to later sowing or earlier harvesting of crops. For wheat, farmers have switched to planting in November rather than October. Harvesting has also taken place earlier in April or in late-May. For rice, some farmers have switched to planting in April rather than May.
Changing variety or type of crop could be beneficial if certain crops grow better in more adverse conditions. For instance, a farmer facing an increased likelihood of drought may switch to faster maturing varieties of the same crop or switch to a different crop that is more tolerant to lower water availability (Burke and Lobell, Reference Burke, Lobell, Lobell and Burke2010). A study by Kurukulasuriya and Mendelsohn (Reference Kurukulasuriya and Mendelsohn2008) found that incorporating crop switching into calculations using the Ricardian framework significantly lowers the cost of climate change across African farms. One-third of adapting farmers had done so by switching crops. One concern is that by including crop switching (which includes both switching types and/or varieties) in the definition of adaptation at the household level, we may not pick up the productivity effects, since farmers may be switching out of the measured crop type. However, the survey revealed that of households that only adapted by using crop switching, only nine households switched crop variety into something other than rice or wheat. The vast majority of these households (45) switched into new varieties of wheat or rice, which in over two-thirds of these cases meant the adoption of two recently released wheat varieties, Sehar-2006 and Shafaq-2006.
Farmers may also change the input mix they apply to crops in response to past or expected climate change. Perhaps the most obvious strategy is increasing the amount of water applied to crops to counter extreme heat and/or low precipitation. Along with this, the survey also showed that a substantial number of farmers increased the amount of fertiliser used. This is the dominant adaptation type with over half of adapters changing inputs in some way.
Increased temperatures and more erratic rainfall may have significant impacts on the state of both soil and water resources, meaning that investments to conserve these resources help farmers adapt to climate change. Higher temperatures are likely to increase the rate at which water is lost from the soil, meaning that they will have to exert more effort into maintaining soil moisture. In addition, heavy rainfall would increase the amount of soil erosion, placing greater emphasis on the need to invest in techniques to reduce these impacts. Investments to counter these effects in Pakistan include contour planting, use of shelterbelts, or manure application. Overall, soil conservation was used by half of adapters.
Given the aridity of the climate, more efficient use of water is paramount to adaptation strategies in Pakistan (Baig et al., Reference Baig, Shahid and Straquadine2013). These strategies are clearly important since 47 per cent of adapters use them. Farmers could utilise rainwater harvesting methods or the construction of bunds around fields to reduce run-off. Water conservation used by farmers in our sample show a distinct pattern. In areas where irrigation is scarce, bunding is the primary strategy used. In areas where irrigation is available, more emphasis is put on more water-efficient methods such as furrow irrigation.
2.3 Crop types
We study farmers who grow either wheat or rice. The average productivity of farmers for each crop is shown in table 1. In contrast to Di Falco et al. (Reference Di Falco, Veronesi and Yesuf2011), who estimate a model using an aggregation of five major crop types, we study each crop separately. Aggregation of different crops into a single production function, however, may have significant disadvantages to studying food security of households.Footnote 7 Aggregation may confuse analysis when growing conditions differ significantly or inputs are used differently. Similarly, the seasonal nature of production in Pakistan over the Rabi (harvested in spring) and Kharif (harvested in autumn) seasons may also complicate the interpretation of an aggregated production function. To account for this, we estimate separate regressions for each crop.
The primary crop grown in our sample is wheat. Production takes place over the Rabi season when temperatures and rainfall are lower than in the summer. Eighty per cent of farmers in Pakistan grow wheat and it makes up 37 per cent of energy intake of the population. A lack of suitable irrigation infrastructure and access to inputs are argued to be behind low yields (FAO, 2013). The implications for wheat yields in the face of climate change are important to whether farmers adapt. Sultana et al. (Reference Sultana, Ali, Mohsin Iqbal and Khan2009) use agronomic crop models to predict the impacts of climate change on wheat yields across climatic zones in Pakistan. They conclude that increases in temperature will decrease wheat yields in arid, semi-arid and sub-humid zones, although increases in temperature could increase yields in humid areas. Shifting growing to cooler months could be an effective adaptation to mitigate the effects of higher temperatures. Siddiqui et al. (Reference Siddiqui, Samad, Nasir and Jalil2012) estimate the yield response of district-level wheat to temperature and precipitation changes in Punjab and conclude that projected climate change would non-negatively impact the production of wheat.
Rice is one of the most important Kharif (summer) crops grown in Sindh and Punjab. It is important as both a food crop and a cash crop. Growth requires access to a good water supply, mostly by irrigating the crop during the hot summer months, although it is sometimes grown under rainfed conditions. Since high summer temperatures are already present across rice growing areas in Pakistan, increased temperatures driven by climate change have been projected to negatively affect rice productivity (Siddiqui et al., Reference Siddiqui, Samad, Nasir and Jalil2012).
2.4 Variables
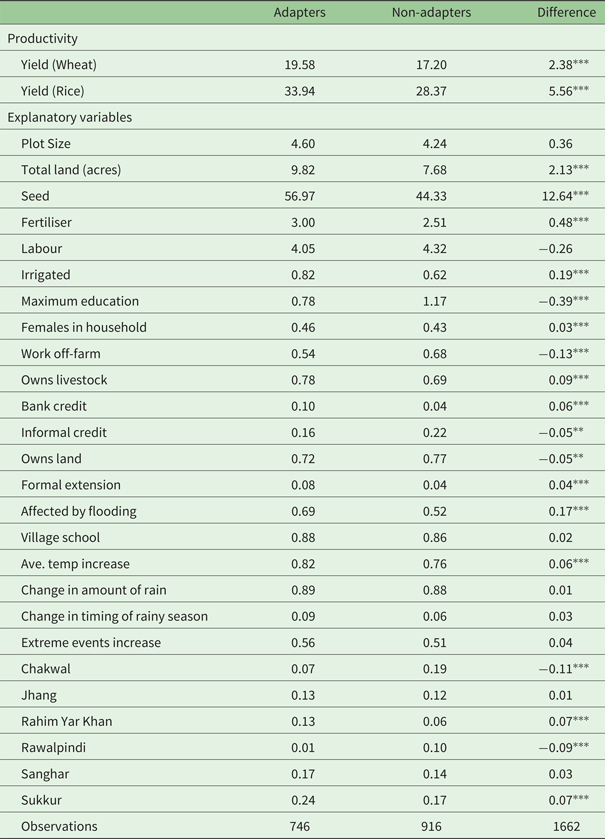
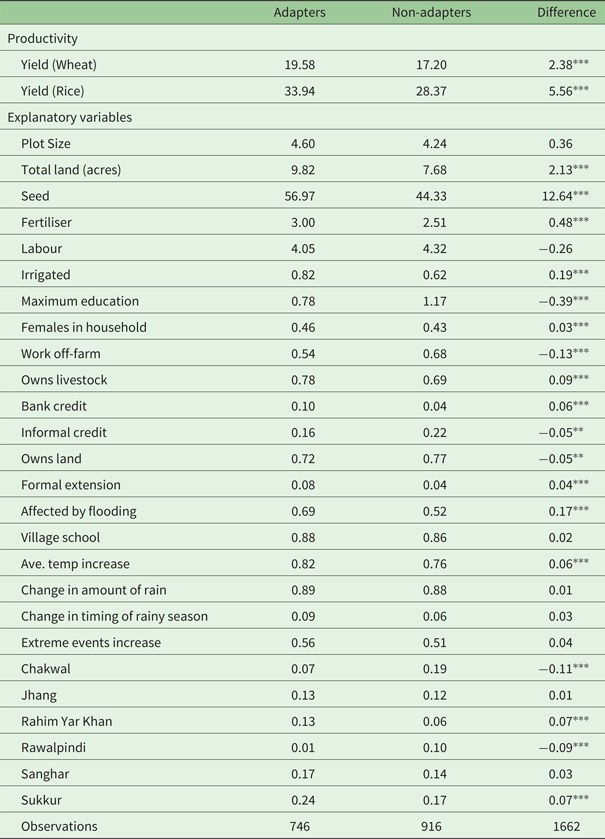
The variables shown in table 1 are used to conduct the empirical analysis described in the next section. Table 2 additionally displays the difference in the sample mean of these characteristics between adapters and non-adapters. As defined previously, adaptation is a dummy variable indicating whether or not the household has adapted to climate change. In our sample, just under half the households have undertaken on-farm measures to adapt to climate change.
Characteristics of adapters and nonadapters: differences
*p<0.1, **p<0.05, ***p<0.01.
Agricultural input data was collected at the plot level to account for the fact that households often grow more than a single crop.Footnote 8 We also include the total landholdings of a household to examine the relationship between farm size and adaptation. On average, households in our sample are two acres larger than the national average which stands at 6.4 acres (Government of Pakistan, 2010). Adapters tend to be households that farm more land. Plot-level inputs include seed, fertiliser, and labour. Differences between adapters and non-adapters suggest that adapters are more input intensive.
We include a dummy variable indicating whether a plot is irrigated to account for the likelihood that irrigated yields are higher than rainfed yields. A high proportion of farms (76 per cent) are irrigated, underscoring the importance of irrigation for farms across Punjab and Sindh.
We also include a set of variables to control for observable differences between households. To control for the education status of households, we include a variable for maximum education of a household (one if member can read and write to seven for an advanced degree). On average, levels of education are low, although most households are equipped with basic reading and writing skills.
We include a variable to measure the gender composition of the household. Women play an important part in farming activities, supplying a large amount of labour. Their role in farming activities is often constrained, since they are excluded from many of the most productive activities, such as operating machinery (Samee et al., Reference Samee, Nosheen, Khan, Khowaji, Jamali, Akhtar, Batool and Khanum2015).Footnote 9
A crucial aspect in the decision to conduct on-farm adaptation may be the existence of off-farm employment. We include a dummy variable indicating whether a household member is engaged in off-farm labour. Nearly 60 per cent of households have at least one member off-farm. Non-adapters are significantly more likely to have at least one member that works off-farm.
Along with the decision to supplement income off-farm, the ability to generate other forms of agricultural income may also affect whether farmers engage in adaptation involving their cropping activities. Livestock was included to indicate whether the household owned cattle or buffalo which can be used for dairy farming. The majority of households in our sample own livestock, although adapters are more likely to do so.
Numerous studies have cited the difficulty of obtaining credit as a crucial factor in determining the ability of farmers to adapt to climate change in other settings (Maddison, Reference Maddison2007; Deressa et al., Reference Deressa, Hassan, Ringler, Alemu and Yesuf2009). Credit markets are an important feature of Pakistan's rural agricultural economy owing to the range of different types of lenders that offer credit (Aleem, Reference Aleem1990). They may be an important part of the adaptation decision because some adaptations require significant up-front investment that may have to be leveraged with credit.
We distinguish between two types of credit. Formal credit is provided by established institutions like banks and microfinance organisations. Chandler and Faruqee, (Reference Chandler and Faruqee2003) find that formal credit only accounts for 7 per cent of households who are in receipt of credit, but makes up 22 per cent of the volume of loans. Informal credit is provided by a range of actors, such as family members or landlords. Salient in Pakistan is the role of the middleman who often supplies credit in exchange for providing farmers with marketing services. There is a common perception that middlemen charge high rates of interest on loans (Haq et al., Reference Haq, Aslam, Chaudhry, Naseer, Muhammad, Mushtaq and Farooqi2013), although it is argued by Aleem (Reference Aleem1990) that higher rates of interest reflect high screening costs and the riskiness of lending to farmers. We test for the role that different types of credit play by including dummy variables for farmers in receipt of both formal and informal credit. Only a small proportion of households in our sample have access to formal credit, while a fifth of households are reliant on informal credit. More adapters use formal credit whereas non-adapters use more informal credit.
A variable to indicate whether the household owns their land is included to test whether property rights are an important institutional determinant of adaptation. Different land rights may affect the decision to adapt. For instance, Jacoby and Mansuri (Reference Jacoby and Mansuri2008) link higher investments in land-improving practices with the security of tenure in Pakistan. Similarly, Ali et al. (Reference Ali, Abdulai and Goetz2012) show that investments in land and farm productivity are lower for leased land relative to owned land in Punjab. Of the farmers sampled here, three-quarters own their land.
Formal extension services may be one way in which farmers learn about new farming information. Those that are best informed about suitable adaptation practices may be more likely to adopt these practices. For instance, work by Hussain et al. (Reference Hussain, Byerlee and Heisey1994) concludes that the Training and Visit extension programme in Punjab in the late 1980s was successful at encouraging the adoption of new agricultural technologies. A surprisingly low proportion (7 per cent) of farmers are in receipt of these services in our sample, although this is more likely for adapters.
Given the heavy losses endured due to flooding between 2010–2012 in areas of Sindh and Punjab, the experience of extreme events may condition whether farmers adapt to climate change. Experience of extreme events may prime the farmer to the possibility of such events in future. On the other hand, extreme events may have prolonged effects that constrain a farmer's ability to invest in costly adaptive measures. We include a dummy variable to indicate whether households have experienced income losses due to flooding in the last three years. Over 60 per cent of farmers experienced losses due to flooding in the years prior to the survey, with more adapters having experienced flooding than non-adapters.
Factors at the village level could reflect the relative development of some areas over others. To proxy for the composition and level of village public investment, an indicator for the presence or absence of a school in the village was used. Schools are present in the majority of villages sampled.
The final four variables in the table relate to farmers’ subjective opinions about whether the climate is changing. We investigate which aspects of the climate farmers think have changed. The first variable in this set shows that the majority of farmers, 79 per cent, perceive average temperatures to have increased, although this proportion is greater for adapters. An even larger proportion (88 per cent) felt that the amount of rain was changing, reflecting the observation that the South Asian summer monsoon has become more erratic (Singh et al., Reference Singh, Tsiang, Rajaratnam and Diffenbaugh2014). Only a small proportion of farmers (5 per cent) perceive the timing of this phenomenon to have changed, however. Given the experience of extreme events previously mentioned, we also include a variable that relates to whether extreme events, defined as droughts and floods, have increased in frequency. Over half the sample perceives this to be the case.
3. Empirical methodology
In this section we outline the empirical approach used to estimate the impact of adaptation on crop yields in Pakistan. To do this we pursue two strategies that seek to estimate the causal effect of adaptation, given the cross-sectional data available. Farmers that choose to adapt are likely to be a non-random, self-selected group, where selection may occur on the basis of observable characteristics or unobservable ones. An example could be that households that have better farm management skills are likely to be more productive and also have a higher propensity to adapt their farming activity to climate change. In this case, the influence of such an unmeasured characteristic could lead us to over-estimate adaptation's impact on crop productivity. To account for these potential selection processes, we undertake the following empirical approach.
First, we take a starting position that selection is on the basis of observable characteristics. Matching techniques, in particular Propensity Score Matching (PSM), are then used to balance the observable characteristics between adapters and non-adapters, and estimate the treatment effect on yield. Since selection on observables is potentially unrealistic, two subsequent methods are then used. First, we test the sensitivity of the PSM results to selection on unobservable characteristics by using Rosenbaum bounds analysis (Rosenbaum, Reference Rosenbaum2002). This method simulates selection on unobservables by perturbing the estimated propensity score with changes in its unobservable component, and then re-estimating the treatment effect and its standard errors. The basic idea is that if, after matching, two farmers with the same observed characteristics differ in the odds of being treated, then the study may be subject to unobserved bias. Any sensitivity of the treatment effects would then be a sign of the importance of unobservable characteristics. Second, we use a control-function approach to explicitly account for the role of unobservable characteristics in the adaptation decision. Specifically, we use endogenous switching regressions, which can estimate treatment effects in the presence of unobserved heterogeneity.
3.1 Propensity score matching
PSM techniques have frequently been applied in empirical settings to estimate causal effects where individuals may select into a treatment group (e.g. Dehejia and Wahba, Reference Dehejia and Wahba2002). In the case where farmers who adapt to climate change are systematically different from farmers who have not adapted, it may not be valid to attribute differences in observed productivity to adaptation. PSM proceeds by matching those farmers in the treated and non-treated groups with similar propensity to be treated (Rosenbaum and Rubin, Reference Rosenbaum and Rubin1983). If the matching process is successful, the distribution of the observed covariates should be similar for those who adapted and their matched counterfactual.
To implement this technique, we first estimate the propensity score separately for farmers who crop wheat and rice using a probit regression. Then, a nearest neighbour PSM algorithm with replacement is used to match farmers, assuming common support (Rosenbaum and Rubin, Reference Rosenbaum and Rubin1983). A number of tests are then undertaken to evaluate the extent to which PSM has balanced the observed characteristics.
Following this, the treatment effects of adaptation are estimated. We focus on two parameters. First, the average effect of adaptation on those that adapted is calculated as the average treatment effect on the treated (ATT). Intuitively, this compares the observed productivity of adapters with their estimated productivity had they not adapted. Second, the average treatment effect on the untreated (ATU) is also calculated. In this case, non-adapters’ observed productivity is compared with their estimated productivity had they adapted. This parameter is useful for assessing whether any potential productive gains from adaptation could be extended to the population of non-adapters, hence it is useful for determining policy scope. We finally test the sensitivity of these parameters to unobserved variables affecting selection by using Rosenbaum bounds.
3.2 Endogenous switching regression
In order to address the potential for selection on observables when estimating the impact of adaptation, we use an endogenous switching regression model. This method is based on that of the Heckman (Reference Heckman1979) selection model that treats selection bias as an omitted variable, the distribution of which can be estimated. This methodology has previously been applied to the study of climate adaptation and crop productivity by Di Falco et al. (Reference Di Falco, Veronesi and Yesuf2011) in Ethiopia.
We use the standard treatment effects framework to estimate yields of farmers in a counterfactual adaptation scenario. A full description of this approach is provided in the online appendix, with the essentials outlined below. Adaptation is defined as the treatment variable which can take discrete values 0 or 1, where D={0, 1}. The selection equation (equation (A.1), online appendix) is estimated using a probit model. Each treatment state has a specific yield equation y ji = Xjiβj + ε ji, with j=1, 2 reflecting the adaptation and non-adaptation states respectively. Following Heckman et al. (Reference Heckman, Tobias and Vytlacil.2003), the expected value of the productivity Y 1i for farmers that adapted is written as:
 $$E(Y_{1i}|D=\hbox{1})=\bi{X}_{{\rm 1}i}\bi{\beta }_{\rm 1}+\sigma _{\omega {\rm 1}}\lambda _{{\rm 1}i}.$$
The vector X1i contains explanatory variables and β1 the estimated coefficients.  $\sigma_{\omega1}$ is the covariance between the error in the selection (ωi) and production equation (ϵji). The term λ1i is interpreted as an inverse Mills ratio (Heckman, Reference Heckman1979), which is included in the productivity equation as an explanatory variable to account for any unobserved selection bias.
In the same way, the outcome Y 2i for non-adapters is expressed as:
 $$E(Y_{2i}|D=0)=\bi{X}_{{\rm 2}i}\bi{\beta }_{\rm 2}+\sigma _{\omega {\rm 2}}\lambda _{{\rm 2}i}.$$
These equations represent the observed outcomes for the adapters and non-adapters. The switching regression framework can also be used to estimate counterfactual outcomes for adapters and non-adapters. For the adapters, the counterfactual is the scenario where they do not adapt, represented by:
 $$E(Y_{i2}|D=1)=\bi{X}_{{\rm 1}i}\bi{\beta }_{\rm 2}+\sigma _{\omega {\rm 2}}\lambda _{{\rm 1}i}.$$
The case where non-adapters do adapt can be represented similarly as:
 $$E(Y_{i1}|D=0)=\bi{X}_{{\rm 2}i}\bi{\beta }_{\rm 1}+\sigma _{\omega {\rm 1}}\lambda _{{\rm 2}i}.$$
Using a generalised treatment effects framework, the impact of adaptation can be estimated for adapters and non-adapters.
 $$\eqalign{ATT & =E(Y_{i{\rm 1}}|D=\hbox{1})-E(Y_{i{\rm 2}}|D=\hbox{1})\cr & =\bi{X}_{{\rm 1}i}(\bi{\beta }_{\rm 1}-\bi{\beta }_{\rm 2})+(\sigma _{{\rm 1} \omega }-\sigma _{{\rm 2}\omega })\lambda _{{\rm 1}i}.}$$
The predicted impact of adaptation on those that did not adapt, the ATU, is defined as
 $$\eqalign{ATU & =E(Y_{i{\rm 1}}|D=\hbox{0})-E(Y_{i{\rm 2}}|D=\hbox{0}) \cr & =\bi{X}_{{\rm 2}i}(\bi{\beta }_{\rm 1}-\bi{\beta } _{\rm 2})+(\sigma _{{\rm 1}\omega }-\sigma _{{\rm 2}\omega })\lambda _{{\rm 2}i}.}$$
Section 4 reports the estimates of these impact parameters.Footnote 10
Estimation and identification using the endogenous switching approach requires the inclusion in the selection equation of at least one variable that affects the probability of adapting but not the productivity of farmers.Footnote 11 Di Falco et al. (Reference Di Falco, Veronesi and Yesuf2011) use climate information sources as selection instruments. We argue against the use of these instruments in the context of this study, given that we identified that farmers gathered advice on farming practices and climate information from a range of sources, including landlords and middlemen. Since these agents may have important implications for farmers’ productivity, other than through adaptation, we choose not to follow in the use of these instruments.
The variables we include relate to farmer perceptions about climate change. We argue that farmers who perceive certain changes in the climate are more likely to adapt. Although we would expect that the perception of climate change in general is a prerequisite for farmers adapting, perceiving different types of change may be important predictors of adaptation. For instance, farmers perceiving increases in average temperatures may be more likely to adapt than farmers who perceive other types of climate change. The validity of the selection instruments also relies on the assumption that perceptions do not drive the productivity of farmers except through the decision to adapt. Although this assumption cannot be directly tested, a way of providing support for this assumption is to test whether or not the included selection instruments drive the productivity of farmers who do not adapt. Evidence for this would provide support for the validity of the identifying assumptions. Table A2 (online appendix) shows how strongly the selection instruments perform in (a) predicting the probability of adaptation and (b) predicting productivity of non-adapters. The four climate perception variables are jointly significant in the adaptation equation at the 5 per cent level for wheat and at the 10 per cent level for rice. Additionally, an F-test of joint linear significance of these variables in the productivity equation for non-adapters rejects the null hypothesis for both wheat and rice. This provides evidence that these variables are not correlated with the productivity of farmers.Footnote 12
4. Results
4.1 Household determinants of adaptation
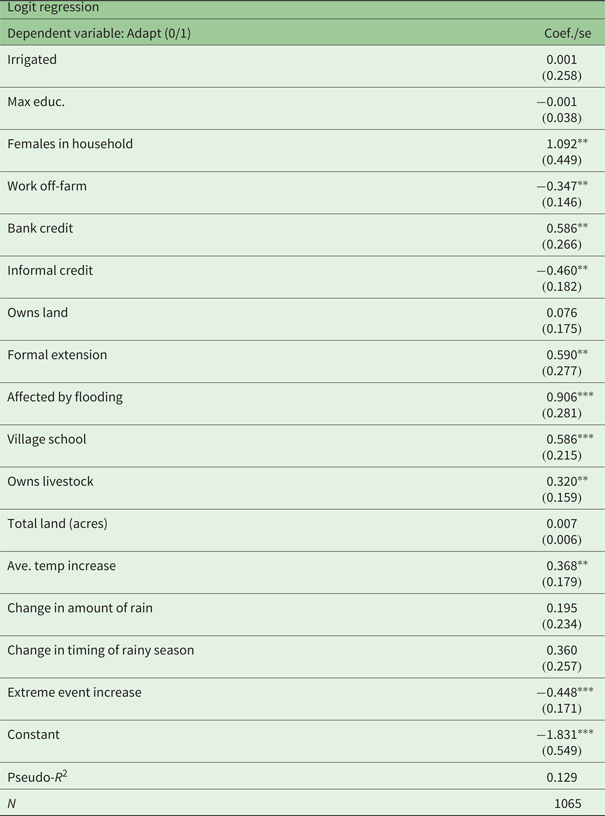
We begin by looking at the determinants of the binary adaptation decision. To do this, we use a logit model using the sub-sample of farmers who crop either wheat or rice. The results are shown in table 3. Each explanatory variable is measured at the household level. We do not include variables measured at the plot level, such as production inputs, in this regression. A set of district fixed effect terms are included in the regression to control for average regional characteristics such as climate and farming practices which vary across the country. Although the estimated coefficients cannot be interpreted causally, we investigate the correlation between adaptation and these variables to see if they have the expected relationship on the probability of adaptation.
Household determinants of adaptation: logit regression

Regression includes regional dummy variables.
Standard errors are heteroskedasticity robust.
*p<0.1, **p<0.05, ***p<0.01.
The results indicate that gender could play in the adaptation decision, since households with a higher proportion of women are more likely to undertake adaptation. There is also some support for the hypothesis that adaptation on-farm is substitutable for working off-farm, as those households with a member off-farm are significantly less likely to adapt. In addition, formal credit is positively related to the propensity to adapt, whereas informal credit is negatively related, providing evidence that credit channels affect the costs and benefits of investing in new technologies. As is noted by Chandler and Faruqee (Reference Chandler and Faruqee2003), this may be because informal loans are typically granted to fund consumption over short durations. Informal loans tend to fund consumption-smoothing activities, rather than productive investments on-farm.
As expected, households who receive extension from the government or NGOs are more likely to adapt. Previous exposure to floods is positively related to adaptation, perhaps supporting the view that experience of extreme events primes households to adapt. Households who also own livestock are positively associated with adaptation.
The significance of the extension service variable highlights the important role extension services play in facilitating farm adaptation. This accords with previous evidence that generally finds that extension services have positive effects on the adoption of productivity-enhancing technologies (Birkhauser et al., Reference Birkhauser, Evenson and Feder1991; Hussain et al., Reference Hussain, Byerlee and Heisey1994). Previous experience of flooding and ownership of livestock are also shown to be positively related to adaptation. Subjective opinions of climate change are also related to whether households have adapted. It seems that adaptation is more likely among those who perceived that average temperatures have been increasing. However, those not reporting on increasing numbers of extreme events, such as droughts or floods, are less likely to adapt.
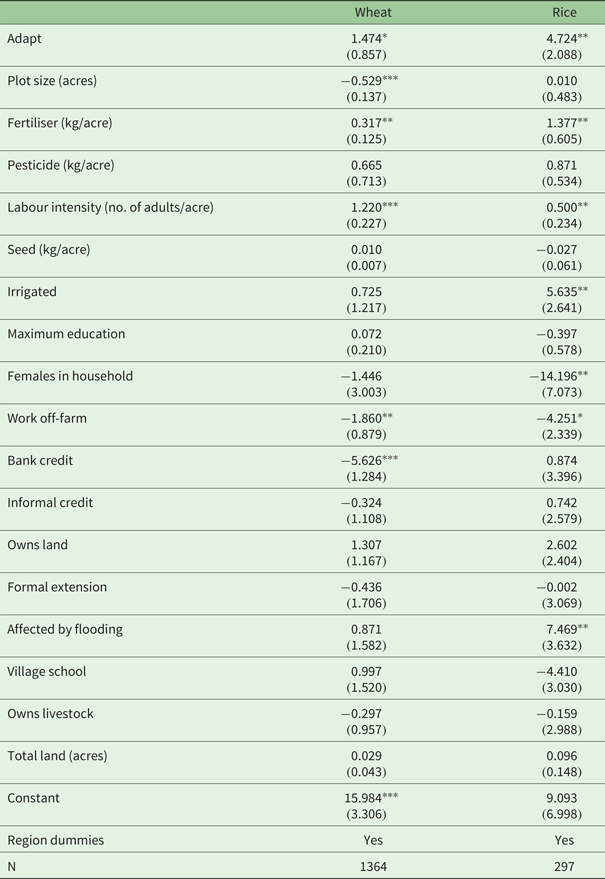
With the adaptation decision modelled, we now estimate a baseline model of the impact of adaptation on yields by crop. Table 4 shows the coefficient estimates for farmers who crop wheat and rice using OLS regression. The coefficient is significantly positive at the 10 per cent level for wheat, providing preliminary evidence that adaptation is associated with higher wheat yields. Given average wheat yields of 18.39 maunds/acre, this suggests a gain in productivity of approximately 8 per cent. For rice, the OLS estimate for adaptation's impact is positive and significant at the 5 per cent level. The magnitude of this coefficient implies that gains from adaptation could be as high as 21 per cent, given average rice yield of 22.67 maunds per acre.
Ordinary least squares regressions to estimate the impact of adaptation

Regression includes regional dummy variables.
Standard errors are heteroskedasticity robust.
*p<0.1, **p<0.05, ***p<0.01.
Irrigation is associated with strong productive benefits, highlighting the importance of water use for a water-intensive crop like rice. Households who earn income off-farm seem to be less productive. There is also evidence to suggest that households who use credit from formal sources are also less productive.Footnote 13
Characteristics associated with labour availability have a negative effect on productivity. In particular, a higher proportion of females and off-farm work is associated with lower productivity. Reasons for the lower productivity of households with a high number of females may relate to the fact that in some cases, despite the availability of farm equipment, women's access to this is undermined, thus reducing the productivity of their labour supplied (Samee et al., Reference Samee, Nosheen, Khan, Khowaji, Jamali, Akhtar, Batool and Khanum2015).Footnote 14
Households with experience of flooding are shown to be more productive for rice. Although we must be cautious in interpreting this effect causally, there are two plausible reasons for this. Firstly, flooding can lead to the transportation and deposit of organic matter that increases soil fertility. Secondly, flooding could increase the amount of irrigation available, most likely from canal irrigation.Footnote 15
4.2 Matching results
The balance tests for the matching algorithm are shown in table A3 (online appendix). We see that matching on the propensity score leads to a much better overall balance of covariates across groups of adapters and nonadapters. For wheat, a high degree of success can be seen, with the matched sample leading to low overall explanatory power of the probability of treatment. The bias of the covariates across the samples is also substantially reduced, with mean and median overall bias now falling below 4 per cent. The Rubin B and R tests also fall within the bounds suggested by Rubin (Reference Rubin2001) to constitute sufficient balance. For rice we also see a substantial reduction in bias in the matched sample. The mean and median bias is reduced as well, although it does not quite reach the 5 per cent threshold generally accepted in observational studies (Caliendo and Kopeinig, Reference Caliendo and Kopeinig2008). The results of the Rubin R test suggest that matching may not have entirely eliminated differences across treatment groups, perhaps due to the relatively small sample of rice farmers.
Prior to matching, observations that do not share a common support are dropped. For wheat, this leads to dropping 70 observations (5 per cent of the total wheat sample). For rice, the number of observations lacking common support is 48, which equates to 16 per cent of the total rice sample.
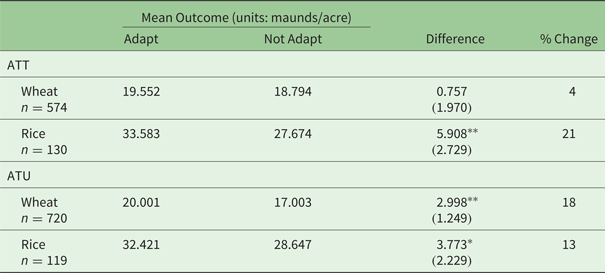
The results of the treatment effect of adaptation from the matching exercise are shown in table 5. Standard errors are calculated by bootstrapping over 300 iterations. For wheat, the effect of adaptation for those that adapted (ATT) is estimated to be positive but insignificant. For rice, productivity is estimated to increase by 21 per cent by undertaking adaptation practices. This result is significant at the 5 per cent level. These results are broadly in line with those estimated by OLS. Similarly, the effect of adaptation for those that did not adapt is also estimated to be positive and significant, with gains of 18 per cent for wheat farmers (significant at the 5 per cent level) and 13 per cent for rice farmers (significant at the 10 per cent level).
Impact of adaptation on yields of adapters: propensity score matching estimates

Standard errors are calculated by bootstrapping over 300 replications.
*p<0.1, **p<0.05, ***p<0.01.
Increases in yield of around 13–18 per cent are economically meaningful magnitudes, but are these estimates robust to the identification assumption associated with selection on observables? To test this, we examine how sensitive the results are to the influence of unobservable characteristics through the Rosenbaum bounds test. We implement this test by adjusting the sensitivity parameter, γ, by increments of 0.1 starting at 1. Each time 0.1 is added to γ, the unobservable components are multiplied by a higher number, increasing the odds that a farmer adapts, despite having the same observable characteristics. The full set of these results is shown in tables A4–A7 in the online appendix and the results are summarised here. For wheat, the ATT seems sensitive to changing γ, becoming insignificant when γ equals 1.3, suggesting that small differences in unobserved covariates could affect the results. The ATU parameter estimate is slightly more robust to changes in γ, becoming insignificant when γ equals 1.4. For rice, incremental changes in γ follow a similar pattern to those of wheat. The ATT becomes insignificant when γ equals 1.4 and at 1.5 for the ATU. Overall, the results are somewhat robust to changes in unobservables, but the ATT results do not withstand large differences.
We also test the robustness of these results to subsets of the adaptation strategies within the PSM approach. We divide adaptation strategies into three subsets: soil and water conservation (SWC) only, cropping changes only, or some combination of both. These results are shown in online appendix table A8, and indicate the particular importance of SWC as an adaptation strategy. SWC strategies are predicted to yield positive benefits for non-adapting wheat farmers, and for adapters and non-adapters for rice. These results are significant at the 10 per cent level.
From the PSM results, we conclude that although in most cases adaptation is estimated to have a positive effect on treatment, we cannot rule out the potential role of unobservable differences between adapters and non-adapters. In the following section, we attempt to deal with potential selection on unobservables by employing an endogenous switching regression.
4.3 Endogenous switching regressions
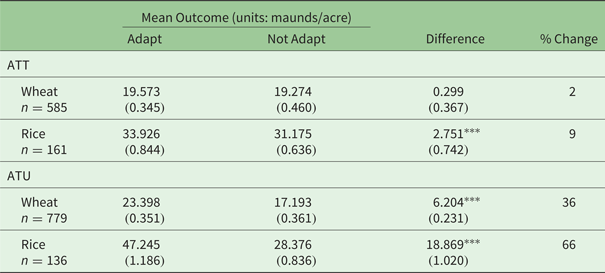
Table 6 shows the estimated change in crop productivity due to adaptation. The full set of coefficient estimates are displayed in tables A9 and A10 in the online appendix. For wheat, the selection bias corrected estimate of adaptation is estimated at 0.299 maunds per acre and not statistically significantly different from zero. For rice, the treatment effect estimated by the endogenous switching approach is 2.751 maunds per acre. In contrast to the impact estimate for wheat, this is significantly positive, indicating productivity benefits of around 9 per cent for farmers that adapted. The results underline the importance of accounting for unobservable differences between adapting farmers and non-adapters. Specifically, since the robustness tests showed sensitivity to potential unobservable characteristics, this appears to explain why estimates obtained by least squares and PSM were larger than those when accounting for unobserved selection.
Impact of adaptation on yields: endogenous switching regression estimates

Standard errors are heteroskedasticity robust.
*p<0.1, **p<0.05, ***p<0.01.
The results for rice compare in magnitude to those in a recent meta-analysis of the effect of temperature and adaptation on crop yields at the regional scale using crop simulation models. For instance, Challinor et al. (Reference Challinor, Watson, Lobell, Howden, Smith and Chhetri2014) find that adaptations at the crop level for both rice and wheat increase yields by 7–15 per cent on average.Footnote 16 The benefits of adaptation are also studied by Soora et al. (Reference Soora, Aggarwal, Saxena, Rani, Jain and Chauhan2013) for rice yields in India using a simulation model. They find that in irrigated rice areas, agronomic improvements – such as shifting cropping dates and switching rice varieties – offset expected climate change damages of around 5 per cent up until 2040.
The average treatment effect on the untreated (ATU) is shown in table 6. Estimated gains from adapting for this group of farmers are much larger than for adapters. For wheat farmers, we estimate that the adoption of adaptation strategies could lead to yield gains of around 36 per cent. The gains for rice are even larger at over 60 per cent.Footnote 17 These results are large and, indeed, surprising, given the relatively smaller gains estimated for adapters. The explanation may lie in the counterfactual that is being estimated. As noted by Shiferaw et al. (Reference Shiferaw, Kassie, Jaleta and Yirga2014), the ATU reflects the difference in outcomes if non-adapters had similar characteristics to adapters. As such, these differences could reflect the potential effect of relaxing constraints on some of the unobservable characteristics of non-adapters, e.g., labour market constraints, and associated benefits this would have on productivity.
As a robustness check, we run an additional specification controlling for weather variables. This is done to examine if weather conditions during the sample period, which could have primed farmers to attribute short-term variations to long-term changes and could also have affected productivity, change the results. The results in table A11 (online appendix) show that inclusion of weather variables in the endogenous switching regressions does not change the interpretation of the main results.Footnote 18
The importance of accounting for selection on unobservables, and the associated selection bias, can also be seen in the estimation of the correlation coefficient between the unobservable components of the switching equation and the outcome equation, ρ. The derivation of this parameter is given in the online appendix. Tables A9 and A10 show that ρ is statistically significant for both rice and wheat producers. This is indicative of the presence of positive unobserved selection bias in the adaptation decision (Lokshin and Sajaia, Reference Lokshin and Sajaia2004). Intuitively, this implies that those households with higher than average productivity are more likely to have adapted to climate change. This finding is similar to that of Abdulai and Huffman (Reference Abdulai and Huffman2014) in the case of adoption of soil and water conservation technologies in Ghana.
5. Discussion and conclusion
This study investigates whether strategies used by farmers to adapt to climate change lead to increased productivity. The use of this unique and specifically designed dataset in the Punjab and Sindh provinces of Pakistan shed light on a region that is expected to be negatively affected by climate change. We also study factors that affect whether farmers have adapted to climate change or not, which provides preliminary evidence about the role of transaction costs and complementary inputs in determining whether farmers adapt.
We estimate that farmers who have previously adapted to climate change have benefited in terms of productivity improvements for rice. The results for wheat farmers suggest that there are positive gains to adaptation but these are not statistically different from zero. This highlights the importance of considering differences in crop responses to adaptation. One possible explanation could be that adaptations are not effective at increasing average yields. As is noted by Sultana et al. (Reference Sultana, Ali, Mohsin Iqbal and Khan2009), shifting planting dates of wheat to later in the year is a key adaptation strategy. Since this effectively reduces the length of the growing season, it is possible that farmers are trading-off the potential benefits of a longer growing season for the security of growing wheat during more temperate months. Semenov et al. (Reference Semenov, Stratonovitch, Alghabari and Gooding2014) study adaptation of wheat to climate change in Europe and find that although the use of quicker maturing varieties is a useful adaptation for avoiding months when temperatures are hottest, use of these varieties is associated with lower yields due to the shorter growing durations. As such, avoiding yield losses due to downside risk-averse aversion or loss-aversion could be a primary factor in farmers’ adaptation decision. This highlights the need for future work that examines whether adaptation has reduced extreme yield losses, and the extent to which risk-preferences drive adaptation decisions for insurance purposes.
Estimated productivity gains for non-adapters are found to be substantial. Given that adaptation is practiced by more productive farmers on average, we interpret this to indicate that there are significant opportunities to increase the food security of farmers. Unobserved differences between farmers may indicate the existence of high transaction costs that inhibit current non-adapters from adapting. Given that many farmers perceive the climate to have changed to some degree, the reason for not adapting could reflect differences in the cost of adapting such as a prohibitively large labour requirement, or other similar constraints that hinder non-adapting farmers from adapting, despite the potential for increases in yield.
Observable determinants of adaptation also provide some evidence that institutional factors play an important part in allowing farmers to adapt. We find that access to credit is associated with the decision to adapt. However, it appears that the type of credit affects the propensity to adapt. Whereas informal credit is negatively related to the probability of adapting, formal credit is positively correlated with the probability of adaptation. This underlines the need for a greater reach of formal credit. This study contributes to previous work in Pakistan on the variation in the specific form of these institutions and their effects on agricultural development. Access to extension services is also associated with a higher probability of adaptation. Targeting these services in areas where other constraints exist is likely to provide the most effective support to farmers.
Growth in the wider economy may provide opportunities and incentives for household members to earn income off-farm. We find evidence that households engaging in these alternative income generating activities are less likely to engage in on-farm adaptation. Given that the off-farm labour variable is associated with lower productivity also, it appears that there is some substitutability between investing in productivity-enhancing measures on-farm versus allocating time and effort off-farm. The allocation of labour in response to a changing climate is complex issue, and an area for future research. Indeed, this paper has also highlighted the difficulty in establishing causal relationships and the sensitivity to both observable and unobservable characteristics. Careful treatment of these factors is required for results to be useful for policy purposes.
Finally, our findings also show a clear cross-over between agricultural development and climate change adaptation. Policy makers could therefore focus efforts on treating adaptation as part of agricultural development policy, and on specific transaction costs to adaptation faced by farmers. Addressing the constraints and better targeting interventions to facilitate adaptation could improve short-term food security and also better prepare farmers in this region for future challenges brought about by a changing climate. Given ongoing concerns of Pakistan's P&DDs evaluating the source of agricultural losses, and the need for planning in the face of climate change, these are timely findings.
Supplementary material
The supplementary material for this article can be found at https://doi.org/10.1017/S1355770X18000232.
Acknowledgments
We would like to thank Salvatore Di Falco, Charlie Palmer, Rab Nawaz, and Basharat Saeed for comments at various stages of this work. A debt is due to members of the team at World Wildlife Fund for Nature-Pakistan who worked tirelessly on data collection. Dr. Khuda Bakhsh, Dr. Iftikhar Adil, Sadaf Khan and Farrukh Zaman were particularly instrumental in this regard. The paper also benefited substantially from insightful comments from two anonymous referees. We would like to thank them for their valuable suggestions. This project was kindly supported financially by the International Development Research Centre. The ESRC also provides individual funding to one of the authors. We similarly acknowledge the support of the LSE Grantham Research Institute and the Centre for Climate Change Economics and Policy.