Implications
As with any other traits, milk quality is affected by environmental and animal genetics factors. Our study on gelsolin gene expression highlighted its link with milk fat content in sheep. Having identified a modulatory gene of milk fat content may lead to economic improvement both for breeders and dairy industry. Breeders can choose to select milk with lesser or greater fat content depending on the cost/benefit analysis. Process industries can indeed be inclined to prefer a higher fat content, not only for its greater yield, but especially for the finer cheese’s organoleptic characteristics.
Introduction
Gelsolin is representative of a class of actin-modulating proteins found from lower eukaryotes through mammals. It is an ubiquitous and a multifunctional biomolecule, able to regulate cell structure and metabolism (Li et al., Reference Li, Arora, Chen, McCulloch and Liu2012) and existing both as intrinsic cytoplasmic protein and as secreted plasma protein. Gelsolin cytoplasmic and secreted forms are the most potent actin filament-severing proteins observed until now (Spinardi and Witke, Reference Spinardi and Witke2007). The actin cytoskeleton plays a pivotal role in several essential cellular processes involving force generation and movement easing (Li et al., Reference Li, Arora, Chen, McCulloch and Liu2012). Actin role in cell shape and organization is relevant, consequently its function is crucial in a multiplicity of biochemical processes that mediate motility and/or structural reorganization within cell, for example, cell migration, development, morphogenesis, metastasis, cell–cell and cell–matrix adhesion and apoptosis (Nag et al., Reference Nag, Larsson, Robinson and Burtnick2013).
The assembly/disassembly and resulting organization of actin filaments in cells is controlled by interaction among a large number of distinct actin-binding proteins (ABPs), classified according to their functions of cross-linking, severing, capping and nucleating actin filaments. Gelsolin is an abundant ABP, and more specifically a Ca2+ and polyphosphoinositide 4,5-bisphosphate (PIP2)-regulated actin filament severing and capping protein, involved in processes of actin remodeling (Sun et al., Reference Sun, Yamamoto, Mejillano and Yin1999).
In mammalian, isoforms of gelsolin are encoded by a single gene (GSN) (chromosome 9 for Homo sapiens, chromosome 2 for Mus musculus and for Ovis aries and chromosome 8 for Bos taurus ) are under the control of several promoters (Li et al., Reference Li, Arora, Chen, McCulloch and Liu2012) and differ as a result of alternative initiation sites/splicing (Pottiez et al., Reference Pottiez, Haverland and Ciborowski2010). Nag et al. (Reference Nag, Larsson, Robinson and Burtnick2013) assumed that alternative splicing frequently observed in the 5’-untranslated regions (5’-UTR), leads to potential differences in transcription control, associated mRNA-binding proteins and mRNA localization. In Bos taurus there are three characterized gelsolin isoforms: a secretory plasma protein composed of 781 aa (isoform A encoded by transcript variant 1; accession number: NM_001113284) and two cytoplasmic proteins, isoform B composed of 731 aa (encoded by transcript variant 2; accession number: NM_001034627) and a lesser known isoform C composed of 742 aa (encoded by transcript variant X3; accession number: XM_015472727). Gelsolin exists in the blood plasma as an 83-kDa protein, while intracellularly it is present as an 81-kDa protein composed of six homologous subdomains referred to S1 to S6; all of these domains are important for the folding and enzymatic activity of the protein (Dos Remedios et al., Reference Dos Remedios, Chhabra, Kekic, Dedova, Tsubakihara, Berry and Nosworthy2003; Nag et al., Reference Nag, Larsson, Robinson and Burtnick2013).
In our previous study (Signorelli et al., Reference Signorelli, Cifuni, Napolitano and Miarelli2010) we produced evidence of the differential isoform B protein expression in the mammary glands of sheep that differed highly in terms of milk production traits. Addis et al. (Reference Addis, Pisanu, Ghisaura, Pagnozzi, Marogna, Tanca, Biosa, Cacciotto, Alberti, Pittau, Roggio and Uzzau2011) showed a significant overexpression of isoform B protein in milk fat globules of sheep naturally infected by a bacterial pathogen. In Napolitano et al. (Reference Napolitano, Annicchiarico, Catillo, Crisà, Grandoni, Marchitelli and Moioli2014) we identified the gelsolin gene as a candidate for milk quality and showed significant associations between some single nucleotide polymorphisms (SNPs) in intron 12 and milk fat content of Altamurana and Gentile sheep breeds. The aim of this study was to assess the level of GSN expression in two sheep breeds with pronounced differences in quantitative and qualitative milk traits and to verify if GSN cytoplasmic isoforms expression could influence milk fat as was already observed in previous genomic and proteomic studies.
Material and methods
Animals and Phenotyping
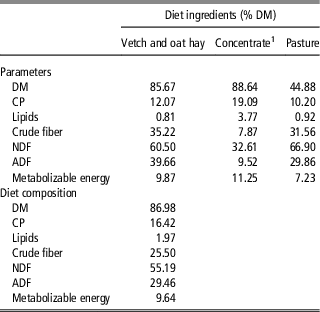
The trial was conducted in an experimental farm of the Council for Agricultural Research and Economics (CREA) located in South-Eastern Italy, following the recommendations of European Union directive 86/609/EEC. A total of 26 ewes of two sheep breeds (12 Gentile and 14 Sarda) were maintained on the same experimental farm and were traditionally managed. The ewes were housed on straw litter in boxes with outdoor pens. Feeding consisted of grazing whole day on natural pasture, with addition of 0.5 kg of a pellet concentrate (Mangimi Liverini S.p.A., Telese Terme (BN), Italy) and 1.8 kg of vetch/oat hay daily, provided as two meals per day (at 0730 and 1530 h). Natural pasture was composed with spontaneous grasses (mainly ryegrass perennial, orchard and fescue species), legumes (mainly trifolium) and others species (mainly chamomile, rocket salad and thistle). Pasture contributed to 20% of the daily diet. Water was available ad libitum. The chemical composition of diet and foods showed in Table 1 was analyzed by standard procedures (Association of Official Analytical Chemists, 1990), while NDF and ADF were determined according to Van Soest et al. (1991). Ewes were milked twice a day (at 0700 and 1500 h) from weaning (mid-April) until drying off (the end of July), using pipeline milking machines (Alfa Laval Agri, Tumba, Sweden).
Chemical composition and nutritional value of the foods and diet of sheep

1 Ingredients: vitamin A, 1150 IU; vitamin D, 390 IU; vitamin E, 50 mg; vitamin PP, 8500 mg; vitamin B1, 112 mg; vitamin B2, 112 mg; vitamin B6, 80 mg; vitamin B12, 1 mg; d-Pantotenic acid, 2400 mg; Choline, 15 000 mg; Iron, 150 mg; Manganese, 800 mg; Zinc, 2200 mg; Cobalt, 8 mg; Iodine, 30 mg; Selenium, 5 mg; Molibdenum, 10 mg.
Three times during lactation (60, 90 and 120 days) individual milk samples were collected in the morning milking and immediately transported to laboratory at 4°C for somatic cell recovery and RNA extraction. At the third lactation stage some sample were not collected because ewes had dried off. Individual milk production was measured through graduated measuring cylinders attached to individual milking units. Fat, total protein and lactose content was determined using a mid-IR spectrophotometer (MilkoScan FT120; Foss Electric, Hillerød, Denmark). Somatic cell count (SCC) was evaluated by a disk cytometry cell counter (Fossomatic 90; Foss Electric), following the International Committee for Animal Recording regulations.
Selection of reference genes for quantitative PCR and primer design
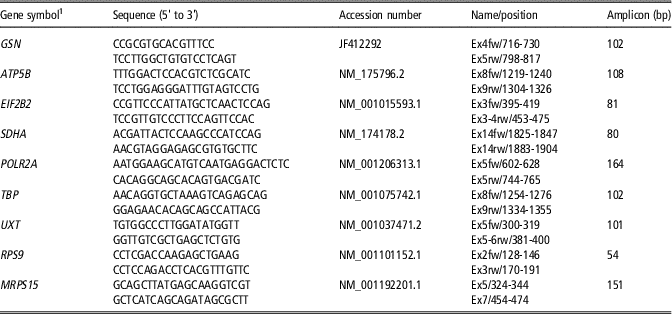
It is well known that the suitability of reference genes (RGs) for any type of quantitative PCR (qPCR) experiment is not given a priori but has to be evaluated each time (Hruz et al., Reference Hruz, Wyss, Docquier, Pfaffl, Masanetz, Borghi, Verbrugghe, Kalaydjieva, Bleuler, Laule, Descombes, Gruissem and Zimmermann2011). Candidate RGs already used in a study on buffalo (Crisà et al., Reference Crisà, De Matteis, Scatà and Moioli2013) were tested: ATP synthase β polypeptide, nuclear gene encoding mitochondrial protein (ATP5B), Eukaryotic translation initiation factor eIF-2B subunit β (EIF2B2), succinate dehydrogenase complex, subunit A, flavoprotein (SDHA), DNA-directed RNA polymerase Fragment RNA polymerase II (POLR2A) and TATA-Box-binding protein (TBP). Moreover, we designed and tested new primers for three genes: ubiquitously expressed transcript (UXT), ribosomal protein S9 (RPS9), mitochondrial ribosomal protein S15 (MRPS15) by using Primer Express software (Life Technology). Primers were picked, when possible, intron-spanning and were synthesized by Eurofins MWG Operon (Ebersberg, Germany). Table 2 reports information relative to the primers used to amplify the target and RG and expected amplicon size. Preliminary amplifications were performed both on complementary DNA (cDNA) and DNA to validate the primers. Quality and length of PCR products were verified on an agarose gel run and after purification by Agencourt AMPure XP (Beckman Coulter, Brea, CA, USA) were sequenced using the 3500 Genetic Analyzers (Applied Biosystems, Foster City, CA, USA). Amplification specificity was verified by using the BLAST software (Altschul et al., Reference Altschul, Madden, Schaffer, Zhang, Zhang, Miller and Lipman1997).
Primers used to amplify the target and reference genes with respective amplicon size in sheep

1 GSN= gelsolin; ATP5B= ATP synthase β polypeptide; EIF2B2= eukaryotic translation initiation factor eIF-2B subunit β; SDHA= succinate dehydrogenase complex, subunit A, flavoprotein; POLR2A= DNA-directed RNA polymerase Fragment RNA polymerase II; TBP= TATA-Box-binding protein; UXT= ubiquitously expressed transcript; RPS9= ribosomal protein S9; MRPS15= mitochondrial ribosomal protein S15.
RNA extraction and reverse transcription
Milk cells were pelleted using 50 ml of milk diluted 1 : 1 with Phosphate buffered saline (PBS) 1× adding 50 µl of 0.5 M EDTA (pH=8) to 50 ml and centrifuged at 2000×g at 4°C for 10 min. Fat layer was removed from the top of the supernatant with a sterile pipette tip and the skimmed milk was discarded. The cell–pellet was washed with 8 ml of buffer (0.5 mM EDTA pH 8.0 in Dulbecco’s PBS). After centrifugation, milk somatic cell pellet was resuspended with 1 ml TRI REAGENT (Sigma-Aldrich, Saint Louis, MO, USA) reagent and stored at −80°C (Crisà et al., Reference Crisà, Ferrè, Chillemi and Moioli2016; Toral et al., Reference Toral, Hervás, Suárez-Vega, Arranz and Frutos2016). Total RNA extraction was performed following manufacturer instructions and then was DNAse digested and cleaned with RNeasy Minelute kit (Qiagen, Venlo, The Netherlands). Ribonucleic acid quality and quantity was checked with spectrophotometric (NanoPhotometer™ Pearl; Implen, Los Angeles, CA, USA) and microfluidic (Bioanalyzer, Agilent, Santa Clara, CA, USA) inspections. Reverse transcription (RT) was performed starting from 1 μl of RNA (500 ng/μl) in a total volume of 20 μl containing 100 pmol oligo(dT) (18-mer), 0.5 mM Deoxynucleotide, 1× RT buffer, RevertAid Premium Enzyme mix (Thermo Scientific, Waltham, MA, USA) according to the manufacturer’s instructions.
Quantitative PCR
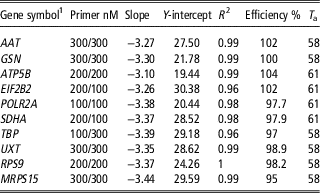
Preliminary qPCR experiments were performed to optimize the annealing temperature and primer concentration both for the target genes and for the eight RGs (Table 3).
Primer concentration and annealing temperature (T a) used in the quantitative PCR in sheep with some parameters calculate from gene expression normalization analysis

1 AAT= α 1 antitrypsin; GSN= gelsolin; ATP5B= ATP synthase β polypeptide; EIF2B2= eukaryotic translation initiation factor eIF-2B subunit β; SDHA= succinate dehydrogenase complex, subunit A, flavoprotein; POLR2A= DNA-directed RNA polymerase Fragment RNA polymerase II; TBP= TATA-Box-binding protein; UXT= ubiquitously expressed transcript; RPS9= ribosomal protein S9; MRPS15= mitochondrial ribosomal protein S15.
Efficiency of PCR amplification for each gene was calculated with a five-point standard curve (1 : 5 dilution per point) made on a samples used as calibrator. For qPCR reactions, 10 ng cDNA from each sample was used in 20 μl reaction using the Max Sybr Green QPCR Master Mix (Thermo Scientific) onto the StepOne Plus instrument (Applied Biosystem). Each animals was tested in triplicate. Reverse transcript minus (RT−) and no template controls were included. The amplification protocol was composed of a denaturation step at 95°C for 10 min; 40 cycles of 30 s at 95°C, 30 s at specific annealing temperature (Table 3) and 1 min for elongation. A melting curve to assess amplicon specificity was included.
Data analysis
geNormplus analysis was assessed to screen the optimal set of RGs from eight tested candidate, using ten samples belonging to three lactation time (Vandesompele et al., Reference Vandesompele, De Preter, Pattyn, Poppe, Van Roy, De Paepe and Speleman2002). geNorm calculates the gene expression stability measure (M) for a RG as the average ‘pairwise variation’ (V) for that same gene with all other tested RGs. Stepwise exclusion of the gene with the highest M value allows ranking of the tested genes according to their expression stability. The GSN expression analysis were performed by using the qBasePLUS software based on the 2-∆∆Ct method with implementations (Hellemans et al., Reference Hellemans, Mortier, De Paepe, Speleman and Vandesompele2007; http://qbaseplus.com). Relative quantity values represent the n-fold normalized expression relative to inter run calibrators run across all plates. Calibrated and normalized log transformed relative quantity values from 26 ewes at each lactation time were used to estimate the different expression level of GSN in the two breeds. The repeated measure analysis in GLM procedure of SAS software (SAS Institute Inc., 2010) was used with the following equation:
 $$Y_{{ijkl}} {\equals}\mu {\plus}A_{i} {\plus}B_{j} {\plus}\left( {A{\times}B} \right)_{{ij}} {\plus}b_{{ik}} {\plus}e_{{ijkl}} $$
where Y ijkl was the level of expression of the GSN; A i was the fixed effect of breed (i=Gentile, Sarda); B j was the fixed effect at the time of the control (j=60, 90, 120 d); b ik was the random effect of subject within the breed i (k=1, … , 14) and e ijkl was the random error. The significance of the GSN expression level was determined using Student’s t-test in the GLM procedure.
Correlation coefficients between lactation length, milk yield, fat content, protein content, lactose content, SCC and the GSN expression level only in Sarda milk samples at 120 days (since at that time of control Gentile milk was just enough to extract a satisfactory amount of RNA) were calculated using the CORR procedure of SAS to assess whether the changes in these phenotypic traits were proportional to the changes in GSN expression level. We chose to use Kendall’s τ-b rank since the P-values are more accurate with smaller sample sizes, moreover, correlations with P-values <0.05 and τ-b>0.46 were considered of interest.
Results
In this work GSN expression level in two sheep breeds and in three lactation stages was investigated. The complexity of the GSN is well known, especially for alternative splicing frequently observed in the 5’-UTR, which determines the translation of three distinct isoforms. The simultaneous expression of both cytoplasmic isoforms was analyzed using primers drawn in conserved region of isoforms (between exons 4 and 5). We identified some candidate genes to use as reference and designed the relative primers basing on the Bos taurus sequence. At first we found that all genes were expressed in sheep milk somatic cell and the amplicons size were as expected both on cDNA (Table 2) and DNA (data not shown). Subsequently primer concentration and qPCR efficiency parameters were optimized (Table 3). Specific peaks were obtained from the dissociation analysis of all genes. To identify the most stable expressed RGs to be used in qPCR experiment, a preliminary geNorm analysis (included in the qbasePLUS software) showed that the optimal normalization factor could be calculated as the geometric mean of three reference targets (ATP5B, SDHA and RPS9).
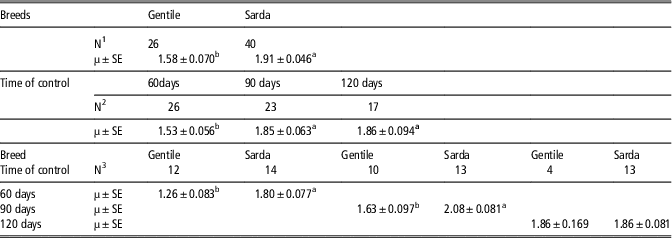
Overall statistical analysis (Table 4) highlighted a significant (P<0.001) difference between breeds, where Sarda showed a higher GSN expression compared to Gentile (1.91 v. 1.58). Considering the three lactation stages it significantly increased from 60 to 90 days (1.53 v. 1.85, P<0.001), instead from 90 to 120 days it was invariable (1.85 v. 1.86). The higher expression in Sarda breed is statistically significant both at 60 days (1.26 v. 1.80, P<0.001) and 90 days (1.63 v. 2.08, P<0.001), after lambing, while at 120 days expression values were identical.
Estimated means of the level of expression of the gelsolin in two breeds at different time of control in sheep milk

1 =Number of milk samples of each breed.
2 =Number of milk samples of both breeds at each time of control.
3 =Number of milk samples of each breed at different time of control.
µ= mean; SE= standard error of mean.
a,b=P<0.001.
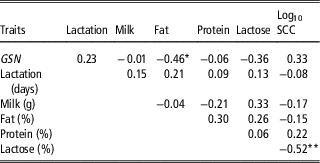
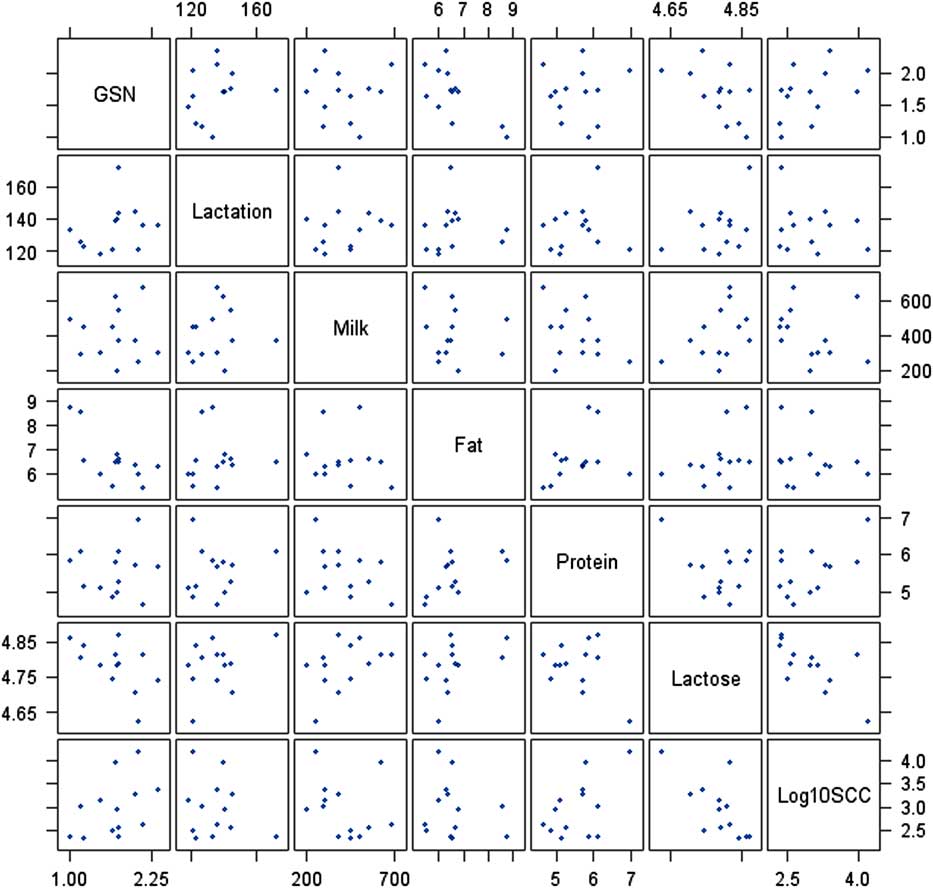
In Supplementary Tables were reported the descriptive statistics (Supplementary Table S1), the parametric and non-parametric rank correlations (Supplementary Tables S2 and S3, respectively) of the level of expression of the gelsolin and of the milk composition parameters in Sarda ewe. The analysis of Kendall’s τ-b rank correlation coefficients between GSN expression and some milk traits (Table 5 and Figure 1) highlighted that to an increase of gene expression corresponds a significant reduction of milk fat content (−0.46, P<0.05). Moreover, a significant correlation between lactose and somatic cell was observed (−0.52, P<0.01).
Kendall’s τ-b rank correlation coefficients between productive traits and the level of expression of the gelsolin in Sarda ewe milk

GSN=gelsolin gene; SCC=somatic cell count.
*P<0.05; **P<0.01.
(colour online) Correlation plots between traits analyzed in Sarda ewe milk. GSN= gelsolin gene; SCC= somatic cell count.

Discussion
In a previous work the authors sequenced exons 12 and 13 and parts of introns 11, 12 and 13 in 263 sheep of three breeds (Altamurana, Gentile and Sarda) and showed that three SNPs were associated with fat content (Napolitano et al., Reference Napolitano, Annicchiarico, Catillo, Crisà, Grandoni, Marchitelli and Moioli2014); moreover, these polymorphisms were located in the consensus sequences of binding sites for some transcription factors. Signorelli et al. (Reference Signorelli, Cifuni, Napolitano and Miarelli2010), in a study on comparative proteomic analysis of mammary gland on the same sheep breeds, observed the protein gelsolin isoform B downregulated in the Gentile breed compared to the Sarda one. Therefore the aim of this work was to verify a probable influence of GSN on milk fat content as already observed in previous genomic and proteomic studies. To verify that we chose two sheep breeds with opposite characteristics as for milk yield and fat content.
The obtained results highlighted a significant (P<0.001) higher GSN expression in Sarda breed compared to Gentile and a negative correlation with milk fat percentage.
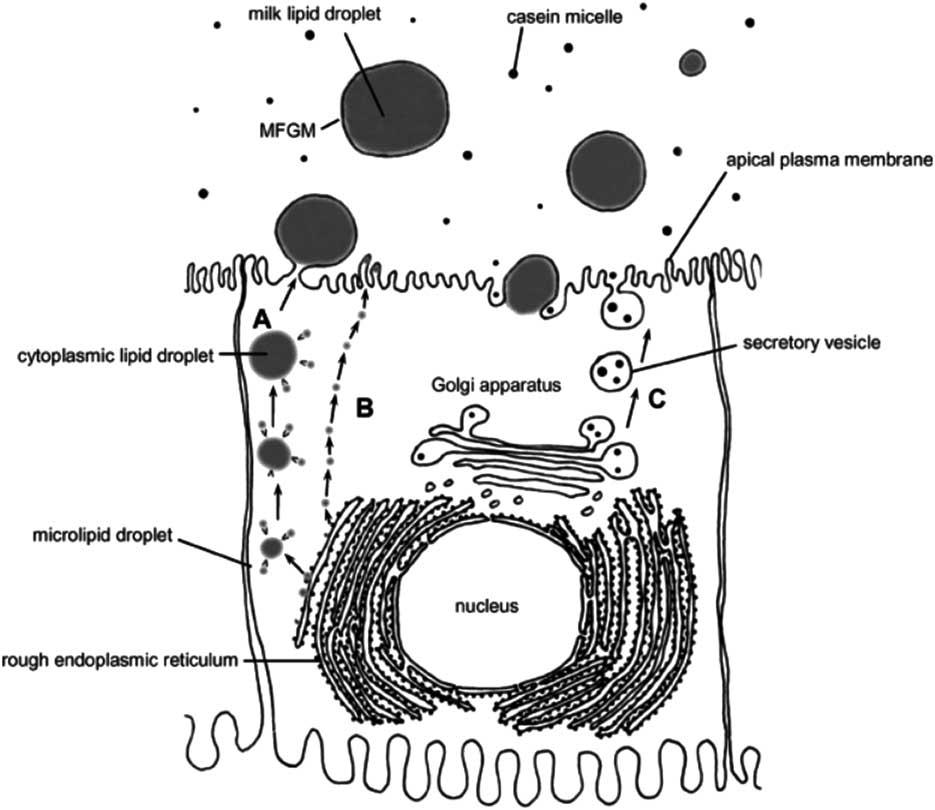
The connection between gelsolin and milk fat content could be explained through the synthesis and secretion of lipids by mammary epithelial cells (Figure 2; Bauman et al., Reference Bauman, Mather, Wall and Lock2006). As described by Bauman et al. (Reference Bauman, Mather, Wall and Lock2006), microlipid droplets are released into the cytoplasm and coated with protein and polar lipids from the reticular membrane. Some of these droplets undergo a series of fusion reactions to form larger cytoplasmic lipid droplets during their transfer to the apex of the cell (pathway A in Figure 2). These droplets become relatively large before secretion, but many others are secreted virtually unalterated in size from the time of their initial formation (pathway B in Figure 2). The droplets therefore arrive at the apical surface with a cohort of surface proteins and polar lipids, some of which become components of the milk fat globule membrane (MFGM).
Milk fat secretion and synthesis by the mammary epithelial cell. A= cytoplasmatic lipid droplet pathway; B= microlipid droplet pathway; C= secretory pathway for skim milk components; MFGM= milk fat globule membrane (Bauman et al., Reference Bauman, Mather, Wall and Lock2006).

What guides this apical migration is not well known but it is probable that cytoskeleton components mainly actin are involved. In fact, actin has been localized to the cytoplasmic surface along basal regions of budding lipid droplets and its microfilaments are abundant in milk secreting cells and appear to be most concentrated in apical cell regions (Franke et al., Reference Franke, Schmidt, Freudenstein, Appelhans, Osborn, Weber and Keenan1980; Amato and Loizzi, Reference Amato and Loizzi1981). Actin has been identified as a constituent of the MFGM and is an active participant in the milk fat secretory process (Heid and Keenan, Reference Heid and Keenan2005). We could suppose that gelsolin is involved in the synthesis of fat globules, as it is an actin filament severing and capping protein. Romao et al. (Reference Romao, He, McAllister and Guan2014), in a study on bovine subcutaneous fat proteome, correlated GSN with fat metabolism and overall identified it among the few proteins to be associated with lipid transport and redistribution.
The authors highlight that the significant association found between the higher GSN expression level is at the same time parallel to the reduction of fat content. The authors hypothesize that this reduction could lead to a consequent lower milk globule fat transport and to resulting lower fat content in milk.
Somatic cell count and lactose negative correlation has long been known, in a review Pyörälä (Reference Pyörälä2003) reported several previous studies focused on lactose as mastitis biomarker (PAF). Both because of the reduced synthesis capacity of damaged mammary tissue and the lower availability of glucose, due to competition for energy between secretor cells and polymorphonuclear leukocytes, lactose content decreases in ovine milk with intramammary infection (De Olives et al., Reference De Olives, Díaz, Molina and Peris2013). These authors showed also fat and casein could vary in different way depending on the magnitude of milk yield reduction. Bianchi et al. (Reference Bianchi, Bolla, Budelli, Caroli, Casoli, Pauselli and Duranti2004) comparing ovine milk samples from healthy and infected udders, highlighted a significant decrease both of lactose and fat.
This association between the two parameters was always confirmed over time (Berglund et al., Reference Berglund, Pettersson, Östensson and Svennersten-Sjaunja2007; Bobbo et al., Reference Bobbo, Ruegg, Stocco, Fiore, Gianesella, Morgante, Pasotto, Bittante and Cecchinato2017), even if it has been asserted that both SCC and lactose have to be monitored at the same time to enhance evaluation of udder health status (Haile-Mariam and Pryce, Reference Haile-Mariam and Pryce2017).
The reason why there were no relationships between gelsolin and lactose and protein can be explained by the different secretion process (exocytosis) of the other major components of milk. Caseins, many whey proteins, lactose, water and ions accumulate in Golgi-derived secretory vesicles (Bauman et al., Reference Bauman, Mather, Wall and Lock2006).
Conclusion
GSN expression analysis confirmed the link between gelsolin gene function and milk fat content of sheep. The identified variants in GSN together with the validation of the differential gene and protein expression may better explain the genotype–phenotype association. Moreover, it could be more profitable in marker selection for desired traits. This research broadened GSN knowledge, even if further studies are necessary to confirm our hypothesis in other livestock species.
Acknowledgements
This study is part of the GENZOOT research programme, which is funded by the Italian Ministry of Agriculture. The authors thank the CRA-ZOE of Foggia staff for their care and management of the animals.
Declaration of interest
The authors report no conflicts of interest in this work.
Ethics statement
The trial was conducted in an experimental farm of the CREA following the recommendations of European Union directive 86/609/EEC.
Software and data repository resources
None of the data were deposited in an official repository.
Supplementary material
To view supplementary material for this article, please visit https://doi.org/10.1017/S1751731119000399