I. Introduction
Wine quality is an abstract measure that is diffcult to define in absolute terms. It leads to debate over how to best aggregate wine-tasting scores from a group of wine judges. Two methods are most commonly used in wine tasting due to their simplicity: score average, which is a simple averaging of numerical scores assigned by the judges; and rank average, which is the average based on the ranks of wines (Ashenfelter and Quandt, Reference Ashenfelter and Quandt1999). The ranks of wines can come either from the conversion of the judges’ scores or from the Borda count directly provided by the judges. Each of the methods has its pros and cons. Specifically, score average does not consider that each judge assigns scores using his or her own preference scale, while rank average may avoid distortion introduced by averaging scores assigned by individual judges. In addition, averaging ranks instead of scores reduces the problem of judges who assign either high or low scores. On the other hand, the difference in the original scores by individual judges does reflect their perceptions of differences in wine quality. For example, for a judge, a 3-point difference between two wines with consecutive order certainly indicates a bigger difference in wine quality than a 1-point difference. However, such difference is no longer reflected if scores are converted into ranks, because the underlying assumption of using ranks is that wine quality changes in equal amount following the rank order.
The Shapley ranking is a recent, simple-to-use method for aggregating wine-tasting scores (Ginsburgh and Zang, Reference Ginsburgh and Zang2012). It is a game-theory-based ranking method (Shapley, Reference Shapley, Kuhn and Tucker1953), whereby judges are not required to rank order or score all the wines; instead, they only choose a subset that they find meritorious. In this voting system, a judge indicates that he or she favors any wine belonging to the chosen subset over the other wines. In addition, for this judge, every wine in the chosen subset is a candidate for the first place or a medal, while the other wines are not. The chosen subset may consist of different numbers of wines for different judges.
In Shapley ranking, each judge has one vote, and the wines within each judge's subset equally share this single unit of voting. The Shapley ranking of each wine is the sum of the shares added over all the judges. In addition to model being simple, the Shapley method puts less burden on the judges, as they do not have to rate or rank all the wines they evaluate. The limitation is that wines are not distinguishable within the subset. Here is a simple example: If a judge chooses 2 wines out of 15, then each of the 2 chosen wines has a vote share of 0.5; if another judge chooses 4 wines out of 15, then each of the 4 chosen wines has a vote share of 0.25. Through this Shapley ranking, wines of high quality are likely to be chosen more often, leading to a high Shapley-ranking value.
As we can see from the comparison of the pros and cons among these methods, it is diffcult to conclude which one is better. Statistically, we can conduct a simulation study, wherein the wine quality is set to be known, to compare the performance of different ranking methods. To make the simulation study informative and meaningful, the data-generating scheme should mimic how the real data are produced. That is, the data-generating model should have a good fit to the real data.
Cao and Stokes (Reference Cao and Stokes2010) develop a Bayesian ranking model, which describes judges’ different scoring patterns by three quantifiable characteristics: bias, discrimination ability, and random variation. Judge bias measures the systematic difference between a judge's score and the average score from all the judges. Judge discrimination measures a judge's ability to distinguish wines based on their quality. Judge variation measures the size of the random component of variability in a judge's assessment of wine quality. This model provides a way to adjust wine judges’ individual internal scales of their assigned scores, yet it maintains the informative difference delivered by the numerical scores.
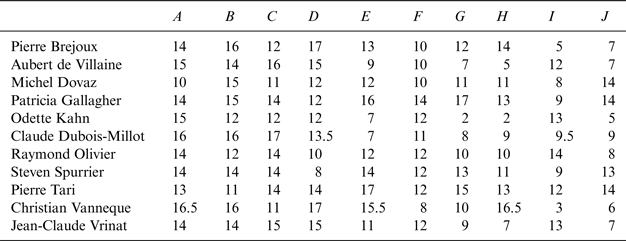
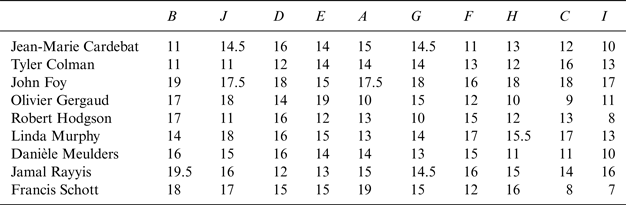
In this paper, we first investigate which of the following three models provides a better fit to the real datasets of the Paris 1976 red-wine-tasting data and th|e Princeton 2012 red-wine-tasting data (see the Appendix). Model 1 underlies the score average method, Model 2 underlies the rank average method, and Model 3 is the one proposed by Cao and Stokes (Reference Cao and Stokes2010) that incorporates judges’ scoring characteristics. Then we simulate data using the model that provides the best fit to the real data. Based on the simulated data, we compare the three ranking methods in terms of ranking accuracy. The paper concludes with a discussion of the results.
II. Ranking Model Selection
We first introduce three candidate models for analyzing wine-tasting data. Suppose M judges are instructed to assign ordinal scores to N wines, with the levels and meanings of the ordinal scores being the same for all judges. We assume that each wine to be evaluated has an underlying continuously valued latent (nonobserved) quality, which determines the true ordering of all wines. The observed scores, regardless of the original ordinal scores or transformed ranks, are estimates of the latent wine quality. In addition, the ranking based on score average or rank average allows each rater to have an equal impact on the aggregate score, implicitly assuming that judges have a homogeneous rating pattern.
Let y ij be the observed ordinal score assigned by judge j on the ith wine and θ i (i = 1, · · · , N) be the underlying quality of wine i. Then the model using the original score is
 $$y_{ij} = \theta _i + e_{ij}, \; e_{ij} \sim N\left( {0,\; \sigma ^2} \right),$$
where measurement error e ij made by judge j on evaluating wine i is assumed to have a normal distribution with mean zero and a common variance σ 2. The second model is based on the ranks. Let z ij be the rank assigned by judge j on the ith wine, where it can be transformed from the original score y ij . The model has a form similar to Model (1),
 $$z_{ij} = \theta _i + e_{ij}, \; e_{ij} \sim N\left( {0,\; \sigma ^2} \right).\; $$
The third model is the ranking model by Cao and Stokes (Reference Cao and Stokes2010). The biggest difference from the above models is that this ranking model allows judges to have different rating patterns. The other difference worth mentioning is that the other two models assume that the ratings (regardless of whether they are the original scores or ranks) are numerical measures of wine quality. However, the ratings are ordinal values, and the differences in the ratings do not necessarily represent the true differences in wine quality. In the third model, the ordinal nature of the data is fully considered, whereby judges are assumed to assign scores by first estimating the wine quality and then comparing it with category cut-offs, which are the same for all judges. In addition to the above notation, let x ij be the estimate of θ i by judge j, giving the third model the following format:
 $$x_{ij} = \alpha _j + \beta _j \theta _i + e_{ij}, \; e_{ij} \sim N\left( {0,\; \sigma _j^2} \right)$$
and
 $$y_{ij} = s \Leftrightarrow c_{s - 1} \lt x_{ij} \le c_s. $$
That is, measurement error e
ij
made by judge j on his or her assessment of wine i is assumed to have a normal distribution with mean zero and judge-specific variance
 $\sigma _j^2 $
. The quantities c
s
denote the common cut-offs for all judges, α
j
is the bias parameter for judge j, and β
j
is the discrimination parameter. A generous judge tends to give a higher average score to all wines, producing a positive α
j
, while a stringent judge has a negative α
j
. A competent judge's discrimination parameter β
j
is positive, indicating that the criteria used by judge j are consistent with the wine's latent quality θ
i
. A small β
j
value suggests that the judge assigns ratings in a small range, and a large β
j
value suggests that the judge assigns ratings that are more separated to distinguishable wines. Parameter
 $\sigma _j^2 $
describes the amount of inconsistency in a judge's scoring pattern. The larger the value of
 $\sigma _j^2 $
, the more randomness in the judge's evaluation. Readers can refer to the paper for more details on fitting the model.
We use the deviance information criterion (DIC) to compare the three models. The DIC (Spiegelhalter, Best, Carlin, and van der Linde, Reference Spiegelhalter, Best, Carlin and van der Linde2002) is an extension from the AIC, the classical Akaike information criterion. It is a measure of predictive power based on the trade-off between model fit and complexity. Like the AIC, lower DIC values indicate stronger models. A generally accepted notion is that differences of more than 10 rule out the model with the higher DIC. A difference of less than 5 indicates that the two models are very comparable in terms of model fit. Using the Paris 1976 red-wine-tasting data, the DIC values for the three models are 296.8, 297, and 259, respectively. Using the Princeton 2012 red-wine-tasting data, the DIC values for the three models are 243.1, 246, and 207.1, respectively. Both real datasets show the same conclusion on the model comparison: Model 1 and Model 2 provide similar model fit to the data, while Model 3 yields much better model fit than the other two models. This is not surprising; whether using the original score or the rank value, Model (1) and Model (2) both assume that the judges have homogeneous rating patterns (i.e., similar bias, discrimination, and ranking error). Model 3 is much more flexible in allowing different rating patterns for different judges, thus producing a much better model fit to both datasets.
III. Ranking Methods Comparison
Based on the model-selection result, we use Model (3) to simulate data following the setup of the Paris 1976 red-wine tasting (i.e., 10 wines rated by 11 judges). Specifically, we use the estimates of judge bias, discrimination, and variation from the real data analysis, and then we use Model (3) to generate y ij values. Based on the simulated data, we compare three ranking methods (score average, rank average, and Shapley ranking) in terms of their ranking accuracy. To compute the Shapley rankings, we use a similar simulation design to that of Ginsburgh and Zang (Reference Ginsburgh and Zang2012), wherein three cases are considered. The first case, denoted as Shapley (1), assumes that each judge would have chosen three wines; the second case, denoted as Shapley (2), starts with the wine with the highest score for each judge and then goes down until it reaches a gap of 2 points; the third case, denoted as Shapley (3), assumes that the subset of wines that each judge finds meritorious includes the wines with scores that are higher than a certain cut-off (e.g., 15 points).
We compare the ranking results of the three methods based on two criteria. One is the squared-error loss, which calculates the sum of squared differences (Cao, Stokes, and Zhang, Reference Cao, Stokes and Zhang2010) between the estimated ranks and the true ranks. It is a suitable measure when accurate ranking of all wines is of interest. The other is the percentile loss, which only considers whether the wines are correctly put in a certain subset. In this study, we consider whether the selected best wine is indeed the best wine.
We generate 1,000 datasets and calculate the values from both loss functions. Table 1 summarizes the results. Note that for both loss functions, a smaller value indicates that the method provides a more accurate ranking result. The simulation study shows that the ranking based on score average is generally more accurate than the one based on rank average. More specifically, the score-average-based ranking is about 25% more accurate than the rank-average-based ranking when accurate ranking of all wines is of interest and 30% more accurate when the goal is choosing the very best wine among all wines. Shapley ranking, in general, has inferior performance compared with the other two methods.
Simulation 1 (Judge Variation is the Same Among Ranking Methods)

Note that in practice, under Shapley ranking, judges do not need to rate or rank all the wines. Instead, they only need to think in terms of two groups, which is psychologically very different and imposes less burden during wine tasting. The previous simulation setup does not take the less evaluation burden on wine judges under Shapley ranking into consideration. In the next simulation study, we consider a different simulation setup to account for this feature of Shapley ranking. Model (3) includes three judge characteristics: bias, discrimination, and random variation. We assume that under Shapley ranking, bias and discrimination do not change much, because those two reflect judges’ personal rating styles. However, the amount of variation may change. Under Shapley ranking, the evaluation burden is much less, allowing judges to demonstrate higher accuracy (i.e., less random variation) in selecting the subsets that they find meritorious. Under this assumption, we reduce the standard deviation of measurement error in Shapley ranking to 80% of the previous level, while the other two methods have the same standard deviation as before. The results are presented in Table 2. Under the squared-error loss, the score average still is the best, and Shapley ranking remains the least competitive. This result is reasonable, because the goal of Shapley ranking is not to rate all the wines but to divide them into two groups, with wines in each group being indistinguishable. Under the percentile loss, Shapley (2), which starts with the wine with the highest score for each judge and then goes down until it reaches a gap of 2 points, performs best. Recall that the percentile loss only considers whether the wines are correctly put in a certain subset, which is consistent with the Shapley ranking method. Shapley (2) beats the score average and the rank average in this setting thanks to the smaller judge variation. Shapley (2) also outperforms the other Shapley ranking schemes, because its setting is most consistent with dividing the wines into two groups, with a clear gap of 2 points separating them; the other two schemes use arbitrary rules (i.e., each judge would have chosen three wines or scored higher than 15) to identify the two groups.
Simulation 2 (Judge Variation in Shapley Ranking is 80%)

IV. Discussion
In this paper, we perform a simulation study to compare three ranking methods in wine tasting. The data-generating scheme mimics how the real wine-tasting data are produced, which adds credibility to the comparison result. The study shows that the ranking based on the score average generally has better ranking accuracy than those based on the rank average and the Shapley ranking.
Note that the simulation setup, whereby judges have rated all the wines, is quite unfavorable to Shapley ranking. In reality, judges undertake quite different strategies when they are asked to use Shapley ranking. To produce this ranking, they only need to decide a meritorious subset: Every wine in the subset is a candidate for the first place or a medal, while nonchosen wines are not. In other words, they do not need to distinguish the individual wines within the meritorious subset or the wines within the nonmeritorious set. With this wine-tasting rule, judges focus more on dividing wines into two groups than on providing scores for all the wines, which may result in more accurate classifications of wines in the meritorious subset. Our second simulation setup accommodates this by reducing the judge variation for Shapley ranking by a reasonable amount, whereby one of Shapley ranking schemes outperforms the other methods under the percentile loss. Shapley ranking, compared to the other ranking methods, is much easier to use. This work serves as an early attempt to compare it with the other methods.
Appendix
The Paris 1976 Wine Testing: Red Wines

The Princeton 2012 Wine Testing: Red Wines