INTRODUCTION
Myanmar's forests represent a globally unique biodiversity resource (Wikramanayake et al. Reference Wikramanayake, Dinerstein, Loucks, Olson, Morrison, Lamoreux, McKnight and Hedao2001; Lynam Reference Lynam2003). For centuries, the country has been known for its teak reserves and its expansive forests (Bryant Reference Bryant1997), extending from the lowlands of the Ayeyarwady delta to the hill regions and the alpine forests of the Himalayas. This Indo-Burma region harbours a tremendous number of rare and endemic species and has been recognized for its high value for biodiversity conservation (Myers et al. Reference Myers, Mittermeier, Mittermeier, da Fonseca and Kent2000). The vast and relatively intact forests of the region are also reputed to be among the last strongholds for large mammals species such as tigers and elephants (Leimgruber et al. Reference Leimgruber, Gagnon, Wemmer, Kelly, Songer and Selig2003; Lynam Reference Lynam2003).
Myanmar may have retained one of the highest levels of species richness and most extensive forest cover (UNEP [United Nations Environment Programme] 1995) of any country in mainland South-east Asia due in part to its political and geographic isolation. These conditions sometimes also make conservation work on the ground difficult. While several new protected areas have been declared, many lack the resources and infrastructure necessary to prevent biodiversity loss from poaching and habitat degradation (Rao et al. Reference Rao, Rabinowitz and Saw Tun2002; Myint Aung Reference Myint2006).
No systematic assessment has been conducted to determine Myanmar's remaining forest cover, its fragmentation patterns, or the rate at which forest cover is changing. Recent region-wide and coarse-scale forest assessments for Asia have produced alarming estimates of current rates of forest loss (for example FAO [Food and Agriculture Organization of the United Nations] 2001a, 2003). Once famed for its extensive closed canopy forests, Myanmar has been cited in some of these reports as one of 10 tropical countries worldwide with the highest annual deforestation rate (FAO 2001a). This picture is further emphasized by frequent reports about extensive logging in Myanmar's border regions, particularly since the Chinese logging ban in 1998 (Global Witness 2003). However, most of these reports have been limited to data samples derived from small geographic areas. Even the regional forest assessments conducted by the FAO were based on a small sample of satellite images and extrapolations (Matthews Reference Matthews2001). Statistical evaluation of these techniques using countrywide mapping indicates that the FAO estimates have been very poor in predicting countrywide and region-wide deforestation estimates (Tucker & Townshend Reference Tucker and Townshend2000).
Considering Myanmar's importance for the conservation of the wider region's unique biodiversity, a countrywide assessment of forest cover and forest cover change is needed. This assessment can only be produced via analysis of satellite imagery and ancillary information, because on-the-ground records of impacts from agricultural conversion and logging are either inaccessible or non-existent. Field assessments, though extremely important for qualitative evaluations, are not currently feasible because of the remoteness of the hill forest regions and difficulties in negotiating access to these areas.
Satellite remote sensing provides objective and consistent observations suitable for mapping tropical forest cover dynamics at a fine scale (Tucker & Townshend Reference Tucker and Townshend2000). Detection of land cover changes from mid-resolution, multi-temporal satellite images such as Landsat is one of the most valuable contributions of satellite remote sensing to natural resource management and biodiversity assessments (Turner et al. Reference Turner, Spector, Gardiner, Fladeland, Sterling and Steininger2003; Leimgruber et al. Reference Leimgruber, Christen and Laborderie2005). Landsat imagery has been the most heavily used source of satellite data for monitoring forest change. These images provide encoded radiance data in the visible near- and middle-infrared spectra, in which most mature tropical forest can be spectrally distinguished from farm, fallow land and other non-forest vegetation (for example Sader et al. Reference Sader, Powell and Rappole1991; Moran et al. Reference Moran, Brondizio and Mausel1994; Steininger Reference Steininger1996, Reference Steininger2000). The 30-m spatial resolution provided by Landsat images enables detection of forest clearings as small as one hectare. Analysis of multi-temporal satellite images has been used to accurately estimate forest cover and deforestation rates (for example Tucker & Townshend Reference Tucker and Townshend2000; Steininger et al. Reference Steininger, Tucker, Townshend, Killeen, Desch, Bell and Ersts2001).
We analysed two wall-to-wall Landsat data sets for Myanmar acquired in the early 1990s and the early 2000s to address four questions: (1) How much forest is remaining? (2) How much forest was lost during the last decade? (3) Where are major deforestation hotspots? (4) What are the most important patterns of deforestation?
METHODS
Study area
Myanmar has a total area of 678 500 km2 and shares borders with Bangladesh, India, China, Laos and Thailand. The country is rich in natural resources, including petroleum, natural gas, hydropower and precious stones. Myanmar has an estimated total population of 42.5 million people, the majority residing within the country's central dry zone. This central dry zone is surrounded by steep and rugged hill terrain that extends along the foothills into the higher regions of the Himalayas. Our study included all of these areas.
Data sources
We acquired complete coverage of Landsat-5 Thematic Mapper (TM) for 1989–1992, and Landsat-7 Enhanced Thematic Mapper (ETM+) for 2000–2001 (43 images for each date collected for Path: 129–135, Row: 40–53; and for dates: 2 January 1989–30 January 1993 and 27 October 1999–19 December 2001). Landsat TM and ETM+ data are distributed in discrete image tiles designated by a unique row and path number defined by the World Reference System II. Images collected in ∼ 1990 and ∼ 2000 can be overlaid for change-detection analysis based on path and row numbers of the tiles for which they were collected. We also registered all images to NASA's Geocover, a set of ortho-rectified images from the 1990s (Tucker et al. Reference Tucker, Grant and Dykstra2004). The Geocover ortho-rectification process uses Global Positioning System (GPS) data and accounts for elevation to produce an image set with a root mean square error (RMSE) of < 50 m. Almost all images were acquired at the end of the monsoon season and the beginning of the dry season, a time period when forest vegetation tends to be lush and cloud cover is low. As a consequence, cloud cover among images used in our analysis was < 2% and restricted to the north-east of the study region. Selection of images during a period of lush foliage but little cloud cover and near anniversary date timing for acquiring the second image was important to reduce confounding effects of seasonal changes in leaf cover in the country's mixed-deciduous and dry forests.
Estimation of forest cover and change
For the estimation of forest cover and changes in forest cover we used an iterative supervised classification technique that integrates multi-temporal images and classifies forest cover and forest cover changes in one step. Our analysts were trained in this technique for assessing deforestation by researchers at Conservation International's Center for Applied Biodiversity Science (M. Steininger, personal communication 2003). In this, satellite images acquired during the same seasons at different years are combined into one dataset and used in supervised classification. During classification, the analyst identifies homogenous areas of forest cover and forest cover change and derives spectral response statistics for these areas. Based on the spectral responses, the images are then classified into maps depicting forest cover and deforestation.
Following this approach we created the multi-temporal images and refined spectral signatures derived from training sites in an iterative process: (i) identify training sites for forest cover and forest cover change, (ii) define spectral signatures, (iii) run a supervised classification based on these signatures using maximum likelihood classifiers, and (iv) check for errors and create additional signatures to refine the classification.
Classification categories were defined as:
(1) Non-change classes: (a) Forest. All closed canopy tall forest (canopy cover > 50%, tree height > 5 m) observed in both image dates, including most mature forest, also savannah-like dry dipterocarp forests (Koy et al. Reference Koy, McShea, Leimgruber, Haack and Myint2005) and sometimes forests partially degraded by selective logging or thinning; (b) Water. All water bodies such as oceans, lakes, reservoirs, rivers, wetlands observed in the ∼ 2000 imagery; (c) Non-forest. All areas that were neither classified as water nor as forest in the ∼ 1990 imagery; and (d) No data. All areas obscured by clouds, cloud shadow and other shadow in one of the satellite images.
(2) Change classes: (a) Deforestation. All areas observed as forest in ∼ 1990 and non-forest in ∼ 2000; (b) Reforestation. All areas observed as non-forest in ∼ 1990 and secondary forest in ∼ 2000; and (c) Water change. All areas changing from water to non-water or vice versa.
Training sites for our supervised classification were identified based on our detailed knowledge of a wide range of environments in Myanmar. Collectively, four of the authors have spent more than 35 months conducting ecological fieldwork in different parts of that country (Supplementary material of URL http://www.ncl.ac.uk/ref/journal.htm). To reduce noise in the result, we smoothed the final classified maps using a 3 × 3 majority filter.
To determine the forest cover dynamics for all of Myanmar, we mosaicked all classified image tiles into a single forest cover/deforestation map. We used this wall-to-wall satellite map to calculate countrywide and divisional forest cover and deforestation rates. For local analysis of forest loss and identification of deforestation hotspots, we also calculated forest cover and annual deforestation rates for each of the image tiles separately. Comparison of the results among the image tiles allowed us better to analyse spatial variation in forest cover and deforestation throughout the country.
Accuracy assessment and cross-validation
Determining the accuracy of a broad-scale remote-sensing product such as a countrywide forest cover change map for Myanmar is a major methodological challenge. Traditional ‘on-the-ground-methods’ were not feasible because of the map's extent and the number of control points necessary to achieve an acceptable level of accuracy. Overflights, though ideal for validation across large areas, were currently impossible. Lack of historical data on the condition of forest and non-forest land further constrained our ability to evaluate the accuracy of the maps.
Remaining forest area and per cent coverage in ∼2000, and average annual deforestation rate between ∼1990 and ∼2000. Per cent forest cover was calculated leaving out all areas that could not be mapped because of cloud cover. Most divisions had > 2% cloud cover; the maximum was 4% in Kachin State.

For this study, we evaluated mapping accuracy by comparing our map with raw images from the Advanced Spaceborne Thermal Emission and Reflection Radiometer (ASTER) flying on the Terra satellite (Abrams Reference Abrams2000). Compared to Landsat TM and ETM+ data, ASTER imagery has improved spatial resolution (15 m), providing greater accuracy in delineation of forest and non-forest cover (for ASTER instrument specifications see Abrams Reference Abrams2000). Using ASTER imagery it was also more feasible to separate degraded forests with low canopy cover from dry dipterocarp forests that frequently also had low canopy closure.
For each of the 43 Landsat image pairs used in the forest cover-change analysis, we acquired one ASTER image from the Land Processes Distributed Active Archive Center (LPDAAC) at the United States Geological Survey (USGS). We only included ASTER images collected between 2000 and 2002. We generated 40 random points inside the segment of the Landsat image area that was also covered by the acquired ASTER images. These points were distributed so as to have 10 random points for each of the mapping classes, namely forest, non-forest, reforestation and deforestation. This was not always possible because some classified Landsat tiles portrayed very little deforestation or reforestation.
In a blind study, image analysts visually categorized the ground cover in the fine-resolution ASTER images into forest and non-forest categories. By cross-tabulating these ASTER categories with the forest cover and change categories in our deforestation map, we directly estimated the accuracy of our map in predicting forest cover for the year 2000. For example, forest and non-forest mapping classes in our map were considered accurate in 2000 if the corresponding ASTER areas were also forest or non-forest. Similarly, deforestation and reforestation were considered accurate in 2000 if they corresponded with ASTER control points that were non-forest or forest. This assumption was easily justified since non-forest areas in the ASTER image clearly had not been regenerating since 1990; and, correspondingly, ASTER areas in 2000 that were forested were most likely not to have been logged or deforested previously.
Accuracies from the assessment based on ASTER represented only partial accuracies for our deforestation map. We also needed to account for misclassification of forest cover changes that might have occurred since the 1990s. Since no ASTER imagery was available for 1990 we could not determine these errors or accuracies directly but needed to estimate them based on the available 2000 data. We used a simple method to approximate total accuracy for change classes, based on the information derived from the ASTER 2000 data. Our calculations were based on three assumptions: (1) accuracy in classifying forest or non-forest is approximately equal for the 1990s and 2000s classifications; (2) accuracies of change classes can be estimated by summing accuracies for classifying a 1990 and a 2000 image; and (3) using these sums we can make a worst-case estimate for accuracy of classifying deforestation and reforestation using a multi-date analysis.
RESULTS
Forest area and rates of change
In the early 1990s, Myanmar had a total forest cover of about 442 000 km2, over 67% of the nation's land area (Table 1). In the early 2000s, the forest area had declined to 430 000 km2 (65%).
Over the approximately 10-year period between these forest measurements, Myanmar lost 12 000 km2 due to human activities, with an annual rate of forest loss of 0.3%. During the same interval, about 3000 km2 of forest regenerated, reducing the annual net deforestation rate to 0.2% (Table 1).
Forest cover changes varied considerably across the country (Table 1). Clearing rates were highest in Ayeyarwady, Mandalay and Sagaing Divisions, ranging from 0.4% to 1.2% a year. All three Divisions encompass significant areas in the central dry zone, where the majority of Myanmar's people live. The Ayeyarwady delta region in particular had experienced unprecedented levels of forest cover change, losing about 12% of its remaining forest cover in only 10 years.
The Ayeyarwady and Mandalay Divisions were also among only four of the country's Divisions and States that had less than 35% forest cover (Table 1). Half of the Divisions and States had over 70% forest cover and annual losses in these areas were frequently well below the annual rates estimated for the whole country. These included Rakhine State, Shan State, Kachin State, Tanintharyi Division, Chin State, Karen State and Kaya State.
Local patterns of forest cover and losses
To better describe local patterns, we quantified changes in forest cover based on image tiles, using the 43 pairs of Landsat images available for the study. In this analysis of local patterns we found that forest losses were clearly concentrated into 10 deforestation hotspots (Fig. 1a) which, in decreasing order of severity, are: (1) the Ayeyarwady delta region (2.2–3.3%), (2) the northern edge of central dry zone and Ayeyarwady valley (0.7%), (3) the northern Bago Yoma and Sittoung valley (0.5%), (4) the Shan plateau (0.5%), (5) northern Chin State and Myitha River (0.5%), (6) eastern Sagaing and east bank of Ayeyarwady River (0.4%), (7) Nagaland, northern Sagaing Division and Uyu River (0.4%), (8) north-western Rakhine State (0.4%), (9) the border region between Mon State and Tanintharyi Division (0.4%), and (10) the southern tip of Tanintharyi Division (0.4%).
(a) Per cent annual forest loss from 1990–2000, thick black lines indicate deforestation hotpots, numbers inside tiles give annual per cent deforestation and numbers in parentheses correspond to numbering of deforestation hotspots in the text. (b) Per cent remaining forest cover in 2000 indicated by the numbers inside tiles.

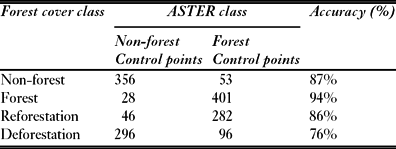
Classification accuracy and error for forest cover map in 2000. Calculations are based on comparing the forest cover map with ASTER satellite images for ∼ 2000.

Estimated total accuracies and error for forest cover change classes based on ASTER imagery collected in ∼ 2000. aError for ∼ 2000 determined from Table 2; error for ∼ 1990 based on estimates for either classifying forest or non-forest incorrectly.

The distribution of remaining forest cover also varied widely across the country, with 2% forest cover in the Yangon Division and a maximum forest cover of over 90% in Northern Kachin State (Fig. 1b). Large forested areas were found in Kachin State and northern Sagaing Division, in the international border regions in Chin and Shan State, and along the Thailand-Myanmar Border.
Accuracy assessments
Based on 1558 control points acquired with ASTER imagery, our forest cover map in 2000 had an overall accuracy of 86% (Table 2). Forest and non-forest classes in our map had a high correspondence with forest and non-forest areas in the ASTER imagery for 2000. Similarly, reforestation and deforestation corresponded well to ASTER-defined non-forest or forest areas. All class accuracy levels were well above 70% and were similar to those reported in previous satellite-based countrywide studies of tropical deforestation (for example Steininger et al. Reference Steininger, Tucker, Townshend, Killeen, Desch, Bell and Ersts2001).
We used these accuracies from the ASTER comparison to develop a worst-case estimate of total accuracies for each change class (Table 3). This was achieved by assuming that errors in classifying forest and non-forest cover for 1990 and 2000 were roughly equal and that combinations of these errors could provide a worst case estimate of the true error. All of the estimates were equal or better than 70% and reached as high as 88% for the areas that remained under forest cover from 1990 to 2000.
DISCUSSION
The status of the forests
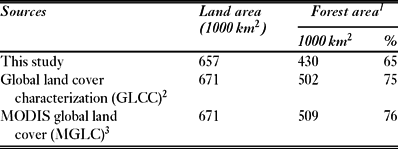
Myanmar is still among the countries possessing the largest remaining forest cover in South-east Asia. The countrywide annual net deforestation rate of 0.2% corresponds to the global average and we found no evidence to support listing Myanmar among the 10 countries with the highest tropical deforestation, despite the FAO (2001a) report. However, we did find 10 deforestation hotspots within Myanmar with annual clearing rates well above the global average. If these trends continue, the country will face serious and rapid forest loss in the very near future. Our estimates of remaining forest cover are in accordance with measurements derived from previous global land cover mapping (Table 4).
Comparison of forest cover estimates from this study with estimates derived from existing global land cover maps. 1Forest categories from global land cover maps included in this calculation are: evergreen needleleaf forest, evergreen broadleaf forest, deciduous needleleaf forest, deciduous broadleaf forest, mixed forest and woody savannahs. 2GLCC map was derived using advanced very high resolution radiometer imagery acquired in 1992 (Loveland et al. Reference Loveland, Reed, Brown, Ohlen, Zhu, Yang and Merchant2000). 3MGLC map was derived using moderate resolution imaging spectroradiometer (MODIS) imagery from 2000 (Friedl et al. Reference Friedl, McIver, Hodges, Zhang, Muchoney, Strahler, Woodcock, Gopal, Schnieder, Cooper, Baccini, Gao and Schaaf2002).

Deforestation rates varied widely among the country's administrative units (Table 1). Densely populated and centrally located administrative units showed the greatest losses, while remote regions, such as Kachin State, Tanintharyi Division and Chin State had losses below the global average. This dichotomy can be partly explained by the increasing resource demands of large populations in central areas and decreasing state control over forest resources in remote and sometimes contested regions.
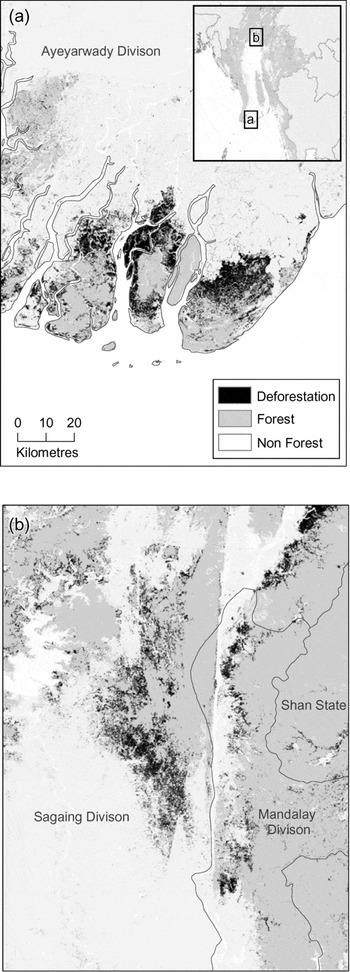
Deforestation hotspots in (a) Ayeyarwady delta region and (b) at the northern edge of the central dry zone along the Ayeyarwady valley. Both are examples of broad-scale conversion of forests into agricultural use.

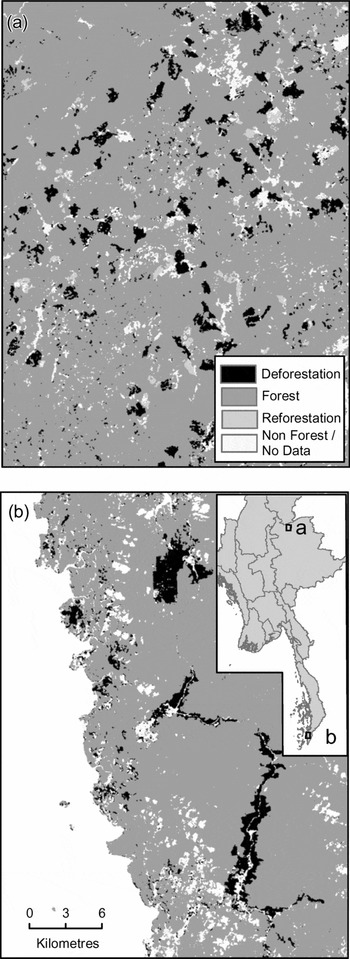
Examples of spatial patterns in deforestation: (a) patchy distribution of deforestation and regeneration typical of widespread shifting cultivation in the Chin Hills; (b) conversion of low-land rainforest to oil palm plantations in southern Tanintharyi Division.

Spatial patterns of forest dynamics suggest three main processes of forest clearing, including broad-scale conversion and degradation of forests (Fig. 2), broad-scale shifting cultivation (Fig. 3a), and conversion to commercial oil palm plantations (Fig. 3b). Broad-scale conversion and degradation of forests is the most common and includes (1) degradation from fuelwood consumption (FAO 2001b), (2) unplanned and unrestricted rural agricultural expansion that is encouraged by local and divisional governments (Myint Aung Reference Myint2006), (3) conversion into aquaculture (i.e. shrimp farming in the Delta region), and (4) commercial clearcutting (Brunner et al. Reference Brunner, Talbot and Elkin1998; Global Witness 2003). Shifting cultivation is often expanded beyond sustainability (Eberhardt Reference Eberhardt, Jianchu and Mikesell2003) and may result in significant losses of natural resources and biodiversity. Conversion to commercial oil palm plantations is occurring rapidly in lowland forests at the southern tip of Tanintharyi Division (Aung Than, personal communication 2004) threatening a major biodiversity hotspot (Eames et al. Reference Eames, Htin, Leimgruber, Kelly, Sein Myo, Saw and Saw2005).
Overall, Myanmar's forests are in much better shape than the forests of almost any other country in mainland South-east Asia, partly due to the country's long political and economic isolation. As global trade reaches remote areas of Asia and Myanmar, this could change dramatically.
Deforestation hotspots
The 10 deforestation hotspots identified had annual clearing rates ranging from 0.4% to 2.2%. Most were not tropical rainforest but more threatened forest types such as mangroves and tropical dry forests. Two of the deforestation hotspots merit special mention.
Ayeyarwady delta region
Deforestation in the Ayeyarwady delta region (Fig. 2a) is catastrophic, with more than 20% of the mangrove forests having been lost in only 10 years, the major cause being fuelwood collection to satisfy the demands of the Yangon metropolitan area (FAO 2001b). Originally, delta forests stretched across the Ayeyarwady and Yangon Divisions. By the late 19th century most of the dense lowland evergreen forests, swamp and mangrove forests were cleared following human settlement (Bryant Reference Bryant1997). Remaining forests were concentrated in the less accessible estuaries of the southern Ayeyarwady Division. They represent a recognized priority area for conservation because of their unique fauna and flora (Tordoff et al. Reference Tordoff, Eames, Baltzer, Davidson, Leimgruber, Uga and Than2006). The globally threatened species this area supports include the mangrove terrapin (Batagur baska) and the saurus crane (Grus antigone) (Tordoff et al. Reference Tordoff, Eames, Baltzer, Davidson, Leimgruber, Uga and Than2006).
Northern edge of central dry zone and Ayeyarwady valley
In the northern edge of central dry zone and Ayeyarwady valley (Fig. 2b) at least 7% of the land has been degraded or converted to other uses in the last decade. Continuous human encroachments, including widespread and unplanned agricultural expansion, have caused these major forest losses. Frequently these expansions have led to people-wildlife conflicts. For example, Kanbalu township has seen intense people-elephant conflict in the early 2000s, resulting in the death of several people (Myint Aung, personal communication 2004). Dipterocarp and dry forests of this area represent some of the best-preserved remnants of this forest type in Asia and support the largest extant wild population of the vulnerable Eld's deer (Cervus eldi) (McShea et al. Reference McShea, Leimgruber, Aung, Monfort and Wemmer1999, Reference McShea, Myint, Poszig, Wemmer and Monfort2001; Koy et al. Reference Koy, McShea, Leimgruber, Haack and Myint2005). Because of its conservation importance, large fractions of this area were identified as a conservation priority by a stakeholder workshop in 2004 (Tordoff et al. Reference Tordoff, Eames, Baltzer, Davidson, Leimgruber, Uga and Than2006).
Both areas are of special importance to biodiversity conservation. If land use practices in these two regions are not altered immediately, most or all of their natural forest cover will be degraded, lost, or converted into small, ecologically denuded forest fragments in the near future. Targeted land use planning and clearly formulated land use policies would provide an essential framework to stem the country's rapid loss of natural resources and biodiversity, reduce deforestation and preserve many of these areas.
Most of the other deforestation hotspots also have unique fauna and flora and are of special conservation importance (Tordoff et al. Reference Tordoff, Eames, Baltzer, Davidson, Leimgruber, Uga and Than2006). For example, the Bago Yoma is known for its plant diversity (Davis et al. Reference Davis, Heywood and Hamilton1995) and its importance for the country's teak production (Bryant Reference Bryant1997). Together with the Chin Hills, another deforestation hotspot, more than half of the country's recognized centres of plant diversity are threatened with destruction. The southern tip of Tanintharyi has some of the last remnants of Sundaic rainforest in South-east Asia (Eames et al. Reference Eames, Htin, Leimgruber, Kelly, Sein Myo, Saw and Saw2005). These remnants provide habitat for the largest known population of the endangered Gurney's pitta, only recently rediscovered in Myanmar.
Why are deforestation rates lower than previously estimated?
Our research demonstrates how satellite imagery can be employed to delineate remaining forest cover and assess forest cover dynamics in a remote and inaccessible region. The data our analysis has produced reveal both that Myanmar has more remaining forest than claimed elsewhere and that its rate of forest loss is much lower than previously reported. There are three possible explanations.
(1) Previous estimates were based on small samples of satellite imagery or on expert estimates (FAO 2001a). Tucker and Townshend (2000) found that randomly selected subsets of satellite images tend to produce erroneous results in change calculations unless covering a very large area. We believe this is the major reason for the extremely high deforestation rates previously reported by FAO (2001a, 2003). We used complete satellite coverage for Myanmar, eliminating errors that arise from random selection of a few images and extrapolation of deforestation rates to the country scale.
(2) Unlike some previous studies, our assessments included open-canopy tropical dry forests. These are among the most threatened and least protected forest ecosystems in the region (Koy et al. Reference Koy, McShea, Leimgruber, Haack and Myint2005). However, these forest ecosystems may be classified as non-forest by government. A more restricted forest cover baseline will increase estimates of annual forest loss.
(3) Confusion of seasonal changes in canopy cover with anthropogenic forest degradation is a serious hindrance to accurate analysis. This is a problem especially in mixed deciduous, dry dipterocarp and other open-canopy forests. Errors result when seasonal changes in deciduous forest trees are interpreted as deforestation or the converse. Classification accuracies in these forest types may be lower than for evergreen or mangrove forests. We attempted to reduce this type of error by using images acquired as close to the end of the rainy season as possible, thus minimizing no-data problems from excessive cloud cover and problems of misclassification from seasonal change.
Our accuracy assessment demonstrates that our classification of forest cover and forest cover change dynamics performed reasonably well.
ACKNOWLEDGEMENTS
We thank Jenny Gagnon, Kevin Koy, Thiha, Philip DeWitt, Jamie Robertson and many other interns who assisted in the image analysis. We owe special gratitude to Melissa Rodden, who maintained our computing facilities and networks. Kate Christen, Liz Selig and Chris Wemmer provided thoughtful comments and ideas throughout the study. This project was funded primarily by the Conservation and Research Center Foundation, with additional support from Conservation International and from the United States Fish and Wildlife Service.