Introduction
Oesophageal cancer is one of the fatal malignancies out of approximately 6% of all gastrointestinal malignancies. The human oesophagus, the connection of mouth to stomach, is of muscular tube-like shape of 25 cm length and 2·5 cm in diameter in relaxed state. Cervical, thoracic and abdominal are the main three parts of oesophagus.Reference Nakagawa, Kanda, Kosugi, Ohashi, Suzuki and Hatakeyama 1 The food we eat travels from the mouth via the oesophagus through rhythmic waves of muscular contractions that propel the food to stomach, which is called peristalsis.Reference Huizinga and Lammers 2 Squamous cell carcinoma and adenocarcinoma are the main types of oesophageal cancer. Some of the main aetiological factors of these cancer are being of male sex, aged 65 or older, excessive use of alcohol, smoking, obesity, acid reflux (GERD) and a poor diet with a lack of vegetables and fruits.Reference Zhang 3 Gastro oesophageal reflux disease (GERD) is one of the most common problems affecting the oesophagus. The sphincter muscle that closes the oesophagus does not work properly and allows the food contents from stomach to reflux back into the oesophagus. The symptoms of oesophageal cancer like complications in swallowing, heartburn, hoarseness, weight loss, chest or back pain and persistent cough are described by the Japanese Gastric Cancer Association.Reference Torre, Bray, Siegel, Ferlay, Lortet-Tieulent and Jemal 4 According to the report of Global Cancer Statistics, oesophageal cancer is the third most diagnosed cancer in underdeveloped countries, and it is the leading cause of death.Reference Herskovic, Leichman and Lattin 5 The confirmation of oesophagus cancer can be obtained using imaging tests, biopsy and endoscopy. The early diagnosis rate of oesophageal cancer is low due to the high probability of distant metastasis on presentation, and it has an incidence of a high local recurrence rate.Reference Forastiere, Orringer, Perez-Tamayo, Urba and Zahurak 6 , Reference Kocher, Tekkis and Knisley 7 The majority of patients are diagnosed with advance stages of the disease and their survival rate is <30% after treatment.Reference Xiao, Yang and Liang 8 The treatment of oesophageal cancer is based upon the stage of cancer and health of the patient. The treatment options for this cancer site include chemotherapy, radiation therapy and surgery or a combination of these. Radiation therapy that uses high-energy beam of X-rays to kill cancerous cells is one of the best options of oesophageal cancer treatment. Frequently, radiation therapy is administered in combination with chemotherapy for the higher stage cancer to shrink the tumour. The Radiation Therapy and Oncology Group (RTOG) in 94–05 trial compared 5040 cGy radiotherapy dose with high 6480 cGy radiotherapy dose in computer control radiotherapy settings and showed that there is no considerable difference in survival rate.Reference Minsky, Pajak and Ginsberg 9 Radiotherapy with surgery or after surgery is also used to treat cancer of oesophagus, and it shows improved survival results. In several studies, it has been proved that patients receiving oesophageal cancer treatment, a combination of surgery and radiotherapy, showed better survival rates than treatment with a single modality. It has been proved an effective method of treatment even in the patients having positive lymph node metastases.Reference Xiao, Yang and Miao 10 – Reference Nayan, Bhattacharyya, Jagtap, Kalita, Sunku and Roy 15 It has been shown that patients treated with radiation dose >5100 cGy and concurrent chemotherapy have improved locoregional control as well as disease free and improved survival of stages II–III oesophageal cancer.Reference Suh, Lee and Koom 16 , Reference Gulia, Patel, Rai, Bansal and Sharma 17 External beam radiation therapy (EBRT) has shown improved survival results and is considered the best option for palliative treatment.Reference Nayan, Bhattacharyya, Jagtap, Kalita, Sunku and Roy 15 To obtain the greater accuracy and better comforts, the dose distribution should be uniform. In this research, we have evaluated the dose distribution for different values of prescribed dose to oesophagus. To check the uniformity, the comparison is made between the two delivered values of doses for 3D and four-field treatment plans. We have selected patients with stage T4a and T4b of oesophageal cancer, confirmed after diagnostic tests and recommended for radiotherapy treatment. The 3D conformal radiotherapy having four fields anterior–posterior and posterior–anterior (AP/PA) with Left Lateral/Right Lateral (LT LAT/RT LAT) treatment plans were used for treatment of these oesophageal cancer patients. EBRT planning using 15 MV photon beam delivered normally by parallel opposed fields with four field techniques: the AP-PA field was employed. It is seen that dose distribution is much better than AP-PA field technique if we use four-field techniques in which the parallel opposed AP-PA fields with two lateral opposed fields are applied.Reference Gulia, Patel, Rai, Bansal and Sharma 17 We have used this technique as this methodology can improve the coverage of critical place tumour coverage and the dose to normal tissues can be reduced. We have calculated different indices: moderate dose homogeneity index (mDHI), radical dose homogeneity index (rDHI), coverage index, homogeneity and uniformity index (UI) according to defined relations.Reference Zulkafal, Khan, Ahmad, Akram, Buzdar and Iqbal 18 These indices are used to study dose distribution verification for all these plans in our current study. Statistical analysis software SPSS Statistics (IBM SPSS® Statistics 24.0) is utilised in descriptive statistics, charts, plots of distributions and trend generated tabulated reports and complex statistical analysis, so it is a comprehensive system for data analysis.
This study aims to assure the quality of four-field oesophageal cancer treatment plans by using statistical analysis. In our current study, we have taken advantage of this software to get the values of mean standard error and standard deviation of these indices for evaluating the plans used in the treatment.
Materials and methods
The study consisted of a cohort of 30 oesophageal cancer patients aged between 45 and 67 years and registered in Shaukat Khanum Memorial Cancer Hospital and Research centre Lahore, Pakistan, during March 2017 to February 2018 retrospectively. After getting ethical approvals from patients and hospital ethical committee, the data of T4a and T4b patients were obtained for consideration. These patients were divided into two groups.
1. The 1st group of 15 patients of upper oesophagus was prescribed 5000 cGy dose, and it was delivered in 25 fractions with 200 cGy dose in each fraction.
2. The 2nd group of patients of lower oesophagus was prescribed 4500 cGy dose, and it was also delivered in 25 fractions with 180 cGy dose in each fraction.
To cover the tumour, AP-PA (anterior to posterior AP and posterior to anterior PA) portal with craniocaudal margin of at least 5 cm with circumferential margin of 2 cm was used in accordance with the field limits defined for clinical requirements. 3D conformal radiotherapy using four-field treatment plans of 15MV beam energy was delivered by Varian Clinac® DHX (Varian Medical Systems Inc., Palo Alto, CA).
The computed tomography (CT) scans of each patient were taken by helical CT scanner (CT Brilliance, Philips Medical Systems, the Netherlands). The CT scans obtained were of 3 mm slice thickness and with intravenous contrast. As we have included actual clinical target volume (CTV) of elective nodal region that was not diagnosed in clinical lymph node metastasis, CTV of 3 cm margin was again created in the proximal and distal directions. For each patient, planning target volume (PTV) was defined by covering 1 cm margin in proximal and distal directions and 0·5 cm margin in radial direction on the basis of CTV. The coverage of PTV was set at 95% of the isodose surface, and it was carefully designed that the dose to PTV should not exceed 110% of the prescribed dose at any level for each patient. These scans were then passed on to Eclipse treatment planning system (Aria 11, Varian Medical Systems, Palo Alto, CA) with analytic anisotropic algorithm for creating conformal four field radiotherapy plans. These plans were then evaluated by various dosimetric indices calculated by the cumulative dose volume histograms (DVHs). The formulations of these indices are given below:
1. mDHI = D95/D5
2. UI = D5/D95
In both these relations, D95 and D5 represent doses administered at 95% and 5% of target volumes, respectively.
3. Coverage = Dmin/PD
4. Homogeneity = MD/PD
In both these relations, Dmin, MD and PD are the minimum dose, maximum dose and the prescribed dose described in DVHs, respectively.
5. rDHI = Dmin/Dmax
The cumulative DVHs are generated automatically by the treatment planning software from where all these values are calculated.
Results and discussion
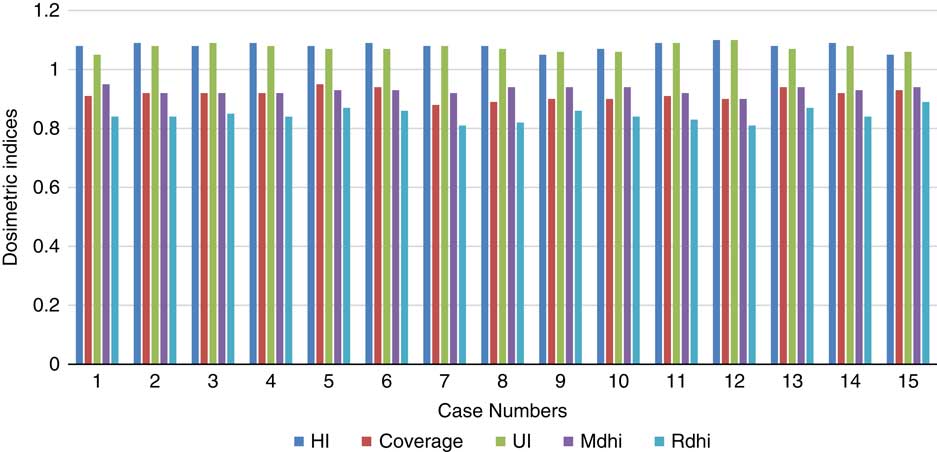
An optimum treatment plan depends on the homogeneous target coverage and maximum sparing of critical organs. The dosimetric indices like homogeneity, coverage Index, UI, mDHI and rDHI assist in the selection of the best radiotherapy plan in terms of coverage and homogeneous dose distribution around the target volume. These indices are capable of integrating dose and evaluating the quality of radiotherapy plans. All the values of dosimetric indices computed are presented in the results as shown in Figure 1.
Representation of dosimetric indices with 5000 cGy prescribed dose.

In Figure 1, the UI values show the range from 1·05 to 1·10. It has an ideal value of 1. The UI values exceeding 1 is the indication of less homogeneous dose distribution.Reference Kataria, Sharma, Subramani, Karrthick and Bisht 19 But UI values calculated for the 1st group of patients showed a difference of 7·4% from the ideal value. Furthermore, values of coverage index show good coverage of target volume. Thus, it is in accordance with the RTOG guidelines.Reference Agostinelli, Garelli and Gusinu 20 All values of coverage index were found greater than 0·9 but lesser than 1. RTOG has reported that homogeneity of dose distribution around tumour volume show minor deviation when it is greater than 2 and major deviation when greater than 2·5. All homogeneity values were observed to be less than 2 in this investigation. mDHI values depicted range from 0·90 to 0·95. rDHI values also gave satisfactory results. Excellent planned dose delivery can be ensured if these indices showing values closer to 1 and lower values reflect better dose distribution.Reference Iqbal, Isa, Buzdar, Gifford and Afzal 21
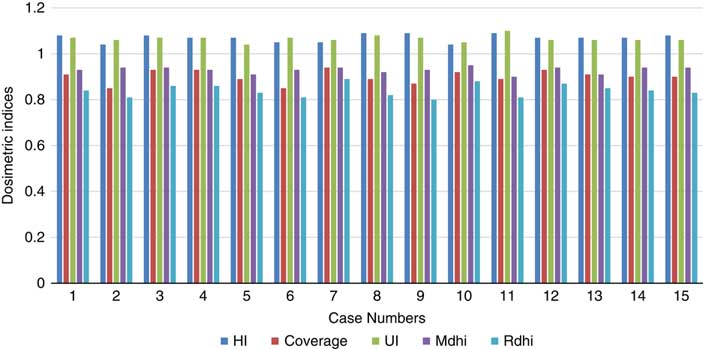
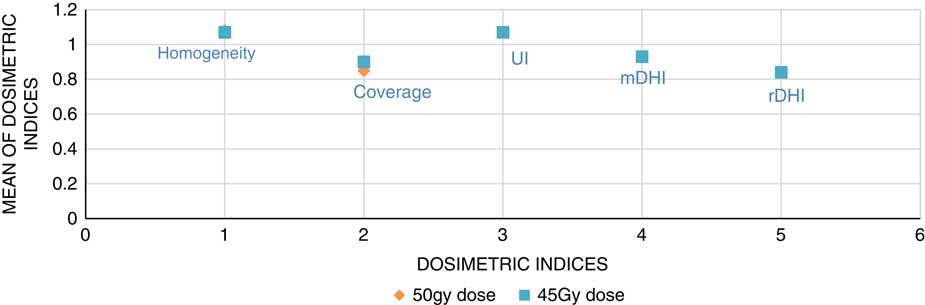
Figure 2 shows all the values of dosimetric indices of the patients prescribed for 4500 cGy dose. These are similar to the values of dosimetric indices determined for the 1st group of patients. A difference of 7% between ideal and calculated UI value was observed. Moreover, coverage, UI, mDHI and rDHI values were within the specified limits of RTOG.Reference Agostinelli, Garelli and Gusinu 20 Difference and comparison between the dosimetric indices calculated for treatment plans of 5000 cGy dose (prescribed to 1st group of patients) and 4500 cGy dose (prescribed to 2nd group of patients) are also made and shown in Figure 3.
Representation of dosimetric indices for 4500 cGy prescribed dose.

Comparison between the dosimetric indices for 5000 cGy PD and 4500 cGy PD.

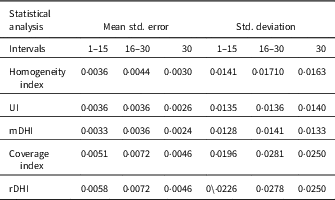
The computed mean values of dosimetric indices of 1st group were compared with the calculated mean values of 2nd group. The maximum difference of 6% was seen between the coverage mean values of 1st and 2nd groups in treatment plans. All the other indices (HI, UI, mDHI and rDHI) have shown lower than 5% difference in these two groups. The data of dosimetric indices were also statistically analysed. The results of two tests: mean standard error and standard deviation for all these indices (HI, UI, mDHI, rDHI and coverage index) in three groups (1st 15, 2nd 15 and complete 30) were analysed and listed in Table 1.
Values of mean standard error and standard deviation

Abbreviations: UI, uniformity index; mDHI, moderate dose homogeneity index; rDHI, radical dose homogeneity index.
Table 1 shows values of two statistical tests: mean standard error and standard deviation for HI, UI, mDHI, coverage index and rDHI. The data are divided into three groups, and these are 1st group (1–15), 2nd group (16–30) and the 3rd group (1–30). The values of mean standard error and standard deviation of the first set which was treated with 4500 cGy and the 2nd set treated with 5000 cGy were compared. It has been observed that there was a small increasing trend in the values of mean standard error and standard deviation from 1st set to 2nd set, in all these indices. Moreover, this increase in mean standard error and standard deviation can be observed in the third- or fourth-digit after decimal. It is also observed the values of the third set, which are equal to or less than these two sets in terms of mean standard error and standard deviation. Irrespective of these trends, all indices showed satisfactory values, and no single entry deviates from the defined limits of RTOG.Reference Feuvret, Noël, Mazeron and Bey 22 Additionally, the minuteness of mean standard error and standard deviation values shows that the dose delivery is excellent.
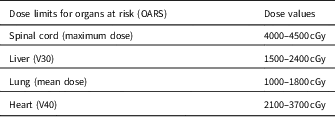
The dose to nearby organs at risk (spinal cord, lung, liver and heart) was also assessed in this study and mentioned in Table 2. Limiting dose values for different organs are shown below in Table 2.
Dose limits to organs at risk

According to RTOG report 117, the dose to spinal cord should not exceed 4600 cGy and liver V30 should be less than 3000 cGy. In this investigation, it was also observed from DVHs that mean dose to lung and V40 of the heart has not exceeded 2000 and 4000 cGy, respectively.Reference Eisenberg, Harris and Blanke 23
Conclusion
Radiation therapy can be an integral part of the treatment of oesophageal cancer. EBRT alone is not usually recommended for primary treatment of oesophageal cancer because radiation administered in combination with chemotherapy improves survival, compared to treatment with radiation alone. 3D conformal radiotherapy using four-field treatment plans shows homogeneous dose distribution around the target and limits the dose to nearby organs at risk. It has also been observed that no significant difference in dose distribution was perceived to treat the upper and lower oesophageal cancer with 5000 and 4500 cGy, respectively. These results of radiation therapy as primary treatment of oesophageal cancer are presented under the treatment overviews for different stages of oesophageal cancer. In general, current evidence suggests that both upper and lower case treated with four fields are better option to treat oesophageal cancer.
Acknowledgement
We would like to thank Clinical and Radiation Oncology Department of Shaukat Khanum Memorial Cancer Hospital & Research Centre, Lahore, Pakistan, for providing data and clinical support.
Conflict of interest
None.