


Introduction
The expanse of Antarctic sea ice is currently one of the major puzzles in sea-ice research (Reference Maksym, Stammerjohn, Ackley and MassomMaksym and others, 2012). Recent observations of increasing Antarctic sea-ice extent (e.g. Reference ParkinsonParkinson and Cavalieri, 2012) are contradictory to an expected decline in a warming environment, as observed in the Arctic (Reference Comiso and HallComiso and Hall, 2014). The failure of global climate models to reproduce this behavior is an indication that key processes are missing in the implementation of the models (Reference Turner, Bracegirdle, Phillips, Marshall and HoskingTurner and others, 2013). One important piece of the puzzle might be the interactions and feedback processes between the sea-ice cover and the Antarctic ice shelves, which link the grounded ice sheet to the Southern Ocean (Reference Bintanja, Oldenborgh, Drijfhout and WoutersBintanja and others, 2013). One aspect of these interactions is the accumulation of ice platelets, inclusion-free single crystals up to 0.2 m in diameter and ˂0.003 m in thickness, beneath a nearby sea-ice cover (Reference EickenEicken and Lange, 1989). These form a dense layer of intertwined individual crystals, herein referred to as a sub-ice platelet layer, following the terminology of Reference Gow and AckleyGow and others (1998). The suspended crystals may attach to the sea-ice bottom and become incorporated into the sea-ice fabric through consequent freezing of interstitial water. This sea-ice type is then referred to as (consolidated) platelet ice, which has a distinct crystal structure and a c-axis distribution different from other sea ice (e.g. Reference Jeffries, Weeks, Shaw and MorrisJeffries and others, 1993; Reference Tison, Lorrain, Bouzette, Dini, Bondesan and venardTison and others, 1998). The ice platelets form and grow in supercooled water, which results from basal melting in the cavities below the floating ice shelves. Reference Lewis and PerkinLewis and Perkin (1986) termed this process an ‘ice pump’. This also means that ice-platelet formation and accumulation below a sea-ice cover may be an indirect indicator of basal melt.
However, continuous studies of ice platelets and associated processes are impossible in the mobile pack ice around the Antarctic continent, because they have only been observed up to 35 km from the coast (Reference EickenEicken and Lange, 1989). In contrast to that, areas of immobile landfast sea ice (fast ice) are comparatively easy to access from nearby coastal stations, making them an ideal platform to study Antarctic sea-ice properties and associated processes (Reference Heil and GerlandHeil and others, 2011). At the same time, fast ice may act as an early indicator of climate change affecting the polar system, through its link with atmospheric forcing (Reference HeilHeil, 2006).
Ice-platelet accumulations have been observed in several locations around Antarctica (e.g. Reference SerikovSerikov, 1963; Moretskiy, 1965; Reference Veazey and MorrisVeazey and others, 1994). By far the most studies have been performed in the Ross Sea, benefiting from the presence of the US and New Zealand stations at McMurdo. Recent investigations of ice platelets near the McMurdo Ice Shelf, for example, focused on frazil deposition (Reference Dempsey, Langhorne and RobinsonDempsey and others, 2010; Reference DempseyDempsey and Langhorne, 2012) and the links between supercooling of the ocean and platelet-ice formation (e.g. Reference MahoneyMahoney and others, 2011; Reference Gough, Mahoney and LanghorneGough and others, 2012).
In the eastern Weddell Sea, a number of smaller ice shelves fringe the coastline of Dronning Maud Land. This region is characterized by a narrow and steep continental shelf margin. Although deep or bottom water formation does not occur there (Reference Fahrbach, Rohardt and KrauseFahrbach and others, 1994), this region is of critical importance to water-mass preconditioning and formation in the Weddell Sea (Reference Thoma and GrosfeldThoma and others, 2006). At the same time, the geographic setting promotes the penetration of modified Warm Deep Water into the ice-shelf cavities (Nøst and others, 2011), which results in high basal melt rates and modifications of the coastal current (Reference HellmerHellmer, 2004). This also means that this region is particularly susceptible to changing climate conditions (Reference Holland and JenkinsHolland and others, 2008). According to previous studies by Lange and others (1989), a substantial fraction of the near-coastal sea-ice cover of Dronning Maud Land originates from incorporation of underlying ice platelets. However, most aspects of the mechanisms of platelet accumulation and their link to oceanographic conditions remain unclear, especially in this region. Wherever a sub-ice platelet layer is present, the solid sea ice grows thicker than can be accounted for by a conductive flux alone. This is due to the incorporation of ice mass formed by heat loss to the ocean, rather than to the atmosphere. It is therefore necessary to determine how much of the solid fast ice in this region results from ocean/ice-shelf interactions. To answer this question, an accurate estimate of the ice-volume fraction of the platelet layer is needed. As the platelet layer modifies the electrical conductivity below the solid sea ice (Reference Hunkeler, Hendricks, Hoppmann, Paul and GerdesHunkeler and others, 2015) and contributes to its freeboard, this parameter is also crucial to accurately determine near-coastal Antarctic sea-ice thickness based on electromagnetic induction sounding (Reference Rack and HaasRack and others, 2013) or altimetry methods (Reference Price, Rack, Haas and MarshPrice and others, 2013). Finally, it is desirable to link the properties of the platelet layer to basal melt processes of nearby ice shelves, as these are particularly susceptible to future environmental changes (Reference HeilHellmer and others, 2012).
In this paper, we aim to improve our understanding of how ice shelves influence nearby sea ice in Antarctic coastal waters. We present the seasonal cycle of sea ice attached to the Ekström Ice Shelf in the eastern Weddell Sea, a region that is currently under-represented in investigations of ice-shelf/sea-ice interactions. We continue the work of Reference KipfstuhlKipfstuhl (1991) and Reference Günther and DieckmannGünther and Dieckmann (1999), who studied ice platelets underlying the solid fast ice of Atka Bay in the 1980s–90s. Through a combination of field observations and model studies, we derive the ice-volume fraction of the platelet layer at six sites on Atka Bay fast ice. Together with observations of platelet-layer thickness evolution, we estimate how much sea ice at Atka Bay is formed by heat transfer to the ocean rather than to the atmosphere. We relate this result to Ekström Ice Shelf basal melt and discuss several implications of the platelet layer for fast-ice properties in this region.
Study Site and Methods
Study site
Atka Bay is a 440 km2 large embayment in front of the Ekström Ice Shelf, which is part of a group of small ice shelves located on the coast of Dronning Maud Land, eastern Weddell Sea (Fig. 1). This relatively small ice shelf covers an area of 6800 km2 (Reference BindschadlerBindschadler and others, 2011) and has been studied since the 1980s, when the first German year-round station was established there. Investigations of ice thickness, bedrock topography and basal melting in this region have been undertaken by, for example, Reference KipfstuhlKipfstuhl (1991), Reference Sandhäger and BlindowSandhäger and Blindow (2000) and Neckel and others (2012). Information about cavity geometry is available from Reference KobargKobarg (1988).
Location of the study site. (a) The Ekström Ice Shelf is located in the eastern Weddell Sea (highlighted as red box). (b) Enlargement of (a). The contours show the depth of the water column below the ice shelf following Reference KobargKobarg (1988). Bathymetry and coastline data were taken from Bedmap2 (Reference FretwellFretwell and others, 2013) and from SCAR (Scientific Committee on Antarctic Research) Antarctic Digital Database 6.0. (c) Enlargement of (b). Sampling sites are indicated by white circles. The TerraSAR-X image provided by the German Aerospace Center (DLR) reveals the different sea-ice regimes in 2012: second-year/first-year sea ice (green), first-year sea ice (blue) and new sea ice grown in October (red). The dotted black curves indicate the locations of ice rises and rumples.

Atka Bay is seasonally covered with fast ice attached to ice-shelf edges bordering to the west, south and east. Knowledge of the sea-ice conditions in this region is crucial to providing logistical support of the German and South African Antarctic stations. Information about general sea-ice conditions is obtained from satellite images, recorded by, for example, synthetic aperture radar on board Envisat, RADARSAT and TerraSAR-X, the Moderate Resolution Imaging Spectroradiometer on board Aqua and Terra, the Enhanced Thematic Mapper on board Landsat or the Advanced Very High Resolution Radiometer on board the Polar Orbiting Environmental Satellites. Satellite imagery is especially needed to fill the gap between late summer and early winter, when direct sea-ice observations are not available and dates of initial formation and break-up need to be determined.
Visual inspection of satellite imagery in previous years reveals that the seasonal fast-ice cover of Atka Bay usually starts to form during March–April. The extent mainly depends on the strength of winds and ocean currents offshore of Atka Bay, and also on the interaction with often passing icebergs. The fast ice does not melt in situ during summer, but breaks out once it is sufficiently destabilized. Although no studies exist to date which have investigated the responsible physical factors more closely, contributions from increased water and air temperatures, as well as from solar radiation, tidal motion, wind forcing and a combination thereof, are most likely. The interaction with stationary and passing icebergs also plays a role. The break-up usually happens after the retreat of the pack ice in front of the fast ice, and normally begins in the eastern part of the bay (generally in December or January). In the southwestern part, sea ice may persist until March, but in most years Atka Bay is completely ice-free at the end of March. Persistent strong easterly winds during initial formation lead to an increased dynamic growth towards the western ice-shelf edge. Once a solid sea-ice cover is established over the major part of Atka Bay (usually in April/May), further growth proceeds thermodynamically.
Meteorological data are readily available from the nearby Neumayer III station, where atmospheric conditions have been recorded since 1981 (Reference König-Langlo and LooseKönig-Langlo and Loose, 2007). An overview for the period 1991–95 is given by Reference König-Langlo, King and PettréKönig-Langlo and others (1998) and for the period 1982–2011 by Reference Rimbu, Lohmann, König-Langlo, Necula and IonitaRimbu and others (2014). Generally, the region is characterized by low temperatures, extreme temperature fluctuations during winter and persistent easterly winds. The winds lead to frequent drifting and blowing snow.
Field measurements
We set up six study sites along a 25 km long west–east profile to monitor fast-ice thickness, snow depth, freeboard and platelet-layer thickness (Reference Hoppmann, Nicolaus, Paul, Hunkeler, Schmidt and KühnelHoppmann and others, 2013a). These sites are referred to in this paper as ATKAxx, where xx represents their distance in kilometers to the western ice-shelf edge (Fig. 1; Table 2 ). Our measurements started in June 2012, as soon as enough snow had accumulated at the ice-shelf edge to access the sea ice several meters below with snowmobiles. We measured sea-ice thickness and freeboard through 0.05 m auger holes using regular (before August) and modified thickness tapes, while snow depth was measured using ruler sticks. Freeboard, the distance from the water surface to the sea-ice surface, is negative when the sea-ice surface is depressed below the water surface. Each time a study site was visited, up to five measurements were performed in an undisturbed area, one in the center and one at a distance of 5 m in each direction.
During the course of austral winter, the platelet accumulations started to complicate the measurements. In order to penetrate the platelet layer, it became necessary to weigh down the tape using a metal bar (as described by Reference CrockerCrocker, 1988; Reference Gough, Mahoney and LanghorneGough and others, 2012). We located the bottom of this layer by gently pulling the tape upwards, trying to feel the first resistance to the metal bar. But during most of our measurements, the bottom of the platelet layer was not well defined: the interface was often mushy rather than consolidated. We also used an under-ice camera (CAM1) fitting through a regular borehole to obtain visual impressions of the platelet layer in real time. In doing so, it became apparent that using the ‘metal-bar’ method we frequently underestimated the ‘true’ platelet-layer thickness by up to 0.3 m. However, we then defined the thickness as the point where a first resistance was felt against a slight pressure, rather than the scratching of single crystals on the metal. The number of measurements at each study site varied, depending on the difficulties the platelet layer imposed on our sampling. The presence of consolidated parts within the otherwise mushy platelet layer sometimes prevented the metal bar from penetrating through the entire thickness. In addition, the bar got stuck several times and we were not able to retrieve it.
Several in situ observations of platelets suspended in the water column were made by colleagues, who installed an under-ice camera (CAM2) in a crack near the western ice-shelf edge (70°37.3'S, 8°05.5'W) between 22 and 30 November 2012, to observe the behavior of Weddell seals (personal communication from I. van Opzeeland, 2012).
In order to link our platelet-layer observations to the prevailing oceanographic conditions, we used conductivity-temperature-depth (CTD) data recorded by the Perennial Acoustic Observatory in the Antarctic Ocean (PALAOA; Reference BoebelBoebel and others, 2006). PALAOA was constructed on the Ekström Ice Shelf in 2005/06, 1.53 km from the ice-shelf edge (70°31'S, 8°13'W). The instrument itself was lowered through a hot-water drillhole, and was installed in the water column at ∼155 m depth, 70 m below the ice-shelf bottom and 90 m above the seafloor. Relevant oceanographic parameters were calculated using the Gibbs Seawater (GSW) Oceanographic Toolbox (Reference McDougall and BarkerMcDougall and Barker, 2011).
We operated two automatic weather stations (AWS) on the fast ice in 2012, recording air temperature and relative humidity (shielded HMP155A, Vaisala; height ∼2m), barometric pressure (61302V, RM Young Company; height ∼1 m), wind speed and direction (Marine Wind Monitor 05106-5, RM Young Company; height ∼3 m), as well as downward and upward long- and shortwave radiation (CNR4, Kipp & Zonen; height ∼2.4m) at 1 min intervals (Reference Hoppmann, Nicolaus, Schmidt and hnelHoppmann and others, 2013b,Reference Hoppmann, Nicolaus, Schmidt and Kühnelc). AWS1 was deployed at a site (70°35.135'S, 7°54.802'W) between ATKA07 and ATKA11 from 6 July to 17 August. AWS2 was deployed at ATKA03 from 2 October to 27 December 2012. We also deployed an eddy covariance (EC) station at ATKA03 between 21 November and 30 December2012. The EC station was equipped with a three-dimensional sonic anemometer (CSAT3, Campbell Scientific Inc.; height 2.55 m) and a CO2/ H2O analyzer (LI-7500, LI-COR Environmental; height 2.35 m). Turbulent fluxes of sensible and latent heat were calculated using a modified version of ECPACK (Reference Van DijkVan Dijk and others, 2004; Reference MauderMauder and others, 2013).
Finally, we retrieved a set of full-length sea-ice cores (one at each study site) on 19 December 2012 to investigate the impact of ice platelets on the fast-ice crystal structure. All cores were drilled using a 0.09 m diameter titanium corer. The cores were transported to Bremerhaven, and a detailed texture analysis is currently in progress. In this study, we show one exemplary sea-ice core retrieved at ATKA24. We used a microtome to prepare horizontal and vertical thin sections (˂ 5 x 1 0 4m) along the entire core length. All thin sections were photographed between crossed polarizing filters. Crystal c-axis orientation measurements were made on selected thin sections using a G50 Automated Fabric Analyzer (Reference WilsonWilson and others, 2003) and the Investigator software (Russell-Head Instruments). The data were plotted onto Schmidt equal-area nets, following Reference LangwayLangway (1958), utilizing a uniform grid of 500 points covering the sample area.
Model simulations
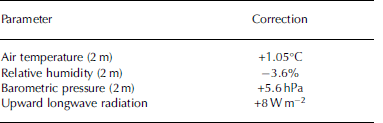
We applied a one-dimensional thermodynamic model (Reference BitzBitz and Lipscomb, 1999) to simulate sea-ice growth at Atka Bay with local atmospheric forcing. We used data recorded at the meteorological observatory of Neumayer III to generate a continuous time series of atmospheric conditions throughout the growth season (Reference König-LangloKönig-Langlo, 2013a,Reference König-Langlob). To account for the differences on the ice shelf and directly on the sea ice, we applied corrections to air temperature, barometric pressure, relative humidity and upward longwave radiation (Table 1). These corrections were based on comparison with the data recorded by the two weather stations (Reference Hoppmann, Nicolaus, Schmidt and hnelHoppmann and others, 2013b,Reference Hoppmann, Nicolaus, Schmidt and Kühnelc). The corrected data are presented in Figure 2a-d.
Corrections applied to meteorological data measured at Neumayer III
Daily averages of modified atmospheric parameters recorded at the Neumayer III meteorological observatory in 2012. (a) Air (black) and surface (red) temperatures. (b) Barometric pressure (black) and relative humidity (red). (c) Wind speed (black) and wind direction (red). (d) Downward longwave (black) and shortwave (red) radiation. (e) Sensible heat flux calculated by the bulk method (black) and the eddy covariance method (red). (f) Latent heat flux determined by the bulk method (black) and the EC method (red). Fluxes are considered negative (positive) if directed towards the atmosphere (sea ice).

We used these data to calculate sensible and latent heat fluxes by a bulk method (Reference AndreasAndreas and others, 2010), and compared the results with the EC-based flux data. The two datasets are in good agreement (Fig. 2e and f). We used short- and longwave radiation, as well as sensible and latent heat fluxes, for model forcing. In addition, several other parameters were initialized in the model. We used a sea-ice density, psi, of 925 kg m 3 (near the top of the range reviewed by Reference TimcoTimco and Frederking, 1996), a snow density, ρs, of 330 kg m 3 (slightly higher than reviewed by Reference MassomMassom and others, 2001, for the Weddell Sea) and introduced a C-shaped salinity profile, typical of the southeastern Weddell Sea in winter (Reference EickenEicken, 1992). Since the snow cover is a crucial factor in sea-ice growth, we included a step function based on the observed snow-depth evolution. Finally, we adjusted the bulk albedo to 0.9, which is in the upper range of our preliminary results of albedo measurements in November (0.8-0.9). This was necessary to avoid extensive surface melt in the model, which was not observed during summer. At sites where dynamic growth was not observed and the dates of initial sea-ice formation were accurately known from satellite imagery, the model was initialized with a minimal sea-ice thickness and the known date of initial formation. Otherwise we initialized the model with results from measurements of our first visit. Assuming that the platelet layer buffers the solid sea ice to potential positive oceanic heat fluxes throughout the growth season (May-December), we set the oceanic heat flux to 0 W m 2 . However, in our model runs an oceanic heat flux of +3 W m 2 starting in mid-December 2012 was necessary to prohibit further growth. Since the freezing interface grows into a water body with only a fraction of interstitial water available for freezing, we modified the sea-ice growth rate, GR, in the model by

where β is the ice-volume fraction in the platelet layer.
This is reasonable, since only the latent heat to freeze a water fraction of 1 / 3 of a given volume is transported towards the colder atmosphere during sea-ice growth. If B = 0, ice crystals in the water near the freezing interface are absent, and growth progresses as usual. According to our field observations (see below), the platelet layer was not established before June in 2012, and we set B = 0 in the model accordingly. From the beginning of June 2012, ice platelets were present below the fast ice and the modified growth rate was used in the model. For the purposes of our simulations, the platelet layer is assumed to be infinite in extent and thickness with regard to the freezing interface.
Results
Observed fast-ice thickness and snow cover
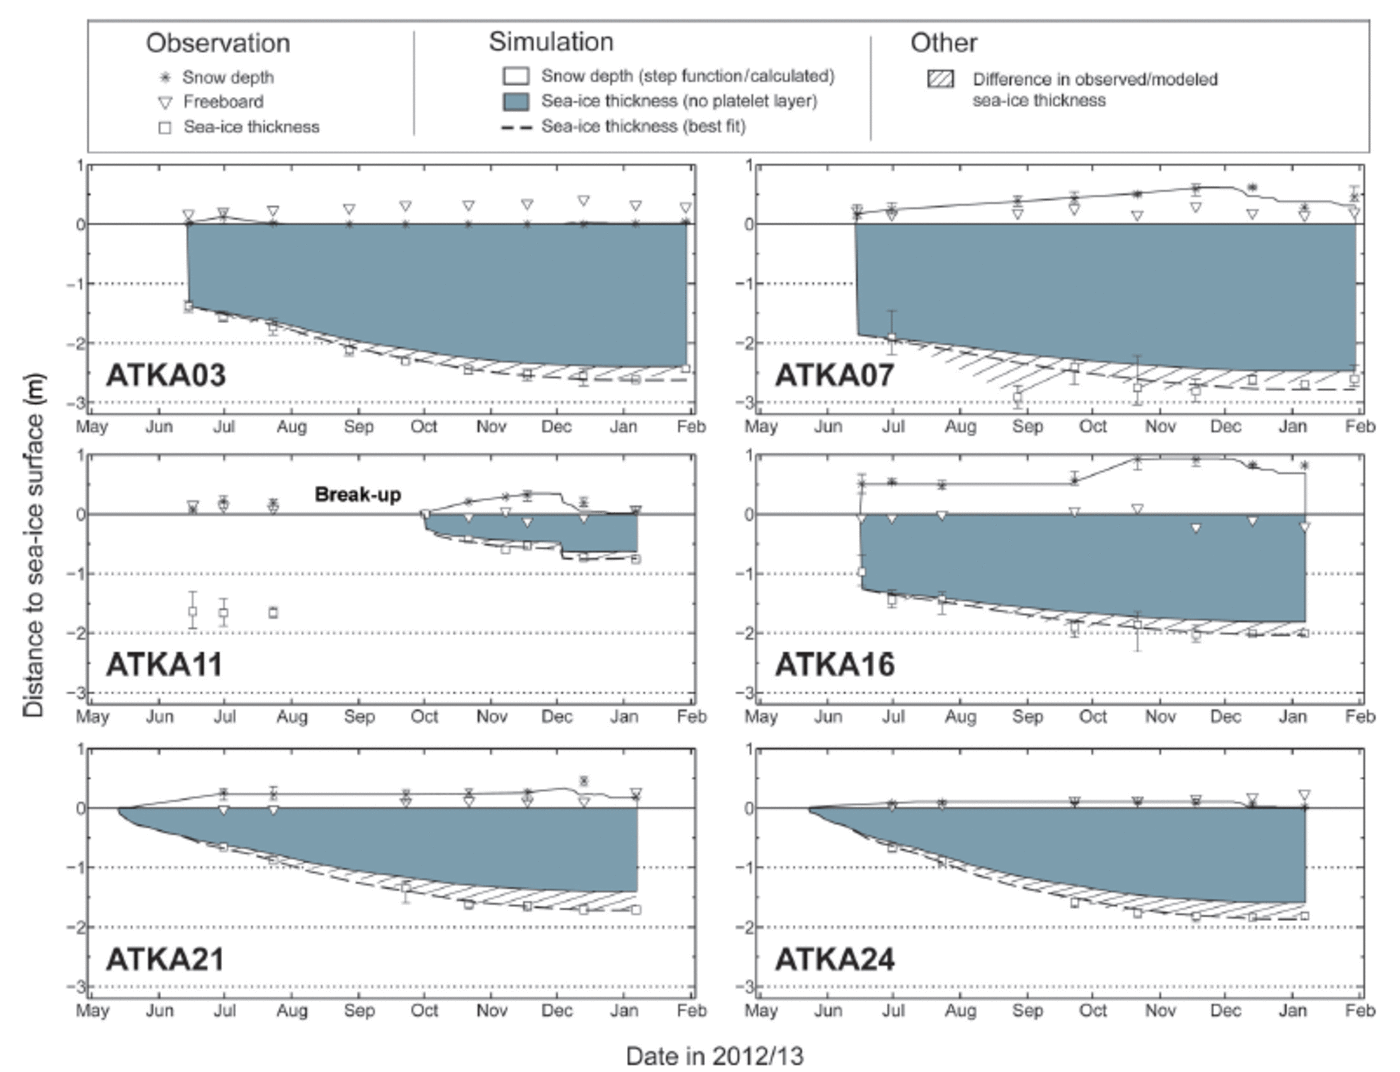
During our study in 2012, the recorded air temperatures ranged from -46.1°C (25 July) to +2.2°C (17 December). The average air temperature was -16.2°C, while the lowest and highest monthly averages of -29.5 and -3.4°C were measured in July and December, respectively. The average 2 m wind speed measured was 7.5 m s 1, peaking at 3 4 m s 1 on 6 August. Easterlies dominated, with ∼30% of the winds arriving in the range 80-100° from the north. Sea-ice thickness, snow depth and freeboard obtained at the various sites occupied during 2012/13 exhibited considerable spatial variability (Fig. 3, Table 2 ).
Fast-ice and snow conditions at the six sampling sites on Atka Bay fast ice in 2012/13. Observed parameters and their variability ranges are indicated, along with results from simulated sea-ice growth.
Study sites in 2012. Abbreviations: D: deformed ice; L: level ice; dw: water depth determined by CTD casts in November and December 2012; T
form: formation of continuous sea-ice cover; max(z
si): maximum sea-ice thickness (December);  : mean snow depth;
 : mean freeboard; β: ice-volume fraction in the platelet layer
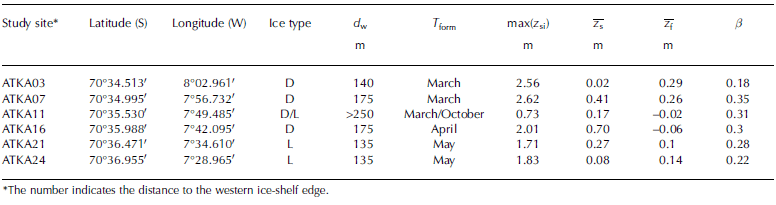
Sea-ice thickness and its spatial variability were generally higher at the westernmost sites, where persistent easterly winds (Fig. 2c) pushed the sea ice towards the ice-shelf edge. While sea-ice thicknesses greater than 2 m were measured at ATKA03 and ATKA07 as early as August/ September 2012 (and later also at ATKA16), sea ice at the eastern sites was thinner. Sites with lower sea-ice thicknesses generally exhibited lower horizontal variability (ATKA11 (late), ATKA21, ATKA24). Due to a partial breakup of fast ice in the central Atka Bay during a storm in late August 2012, sea ice at ATKA11 only grew to a maximum thickness of 0.73 m after its new formation. Although there had been early sea-ice break-up events in previous years, this is not generally representative.
The snow depth generally increased towards the center of Atka Bay, with highest snow depths (˃0.5m) at ATKA07 and ATKA16 in October 2012. Due to the fast-ice break-up, snow at ATKA11 was first exported with the sea ice and then blown into the ocean. As soon as a continuous sea-ice cover established again at ATKA11, in October 2012, snow accumulation followed the same pattern as at other sites. Low snow accumulations (˂0.1m) were observed at ATKA03, due to the influence of a nearby iceberg, and at ATKA24, due to the proximity of the ice-shelf edge. Intermediate accumulations were recorded at ATKA11 and ATKA21 (0.1–0.5 m). Wherever a snow cover was present, it was highly variable. Snow sastrugi up to 2m long and 0.5 m wide were frequently observed, adding to local variability. The overall seasonal cycle of snow depth was generally characterized by an increase from initial sea-ice formation to November 2012, but no significant surface melt was observed until the end of our study in January 2013.
While freeboard was positive at most sites throughout the study, the snow load at ATKA11, and to a smaller extent at ATKA16, caused surface flooding in November. The subsequent snow-ice formation at ATKA11 led to a near-instant increase in sea-ice thickness of ∼0.15 m. As the model does not account for snow-ice formation, this additional sea-ice growth was manually added in the simulation.
Simulated fast-ice growth
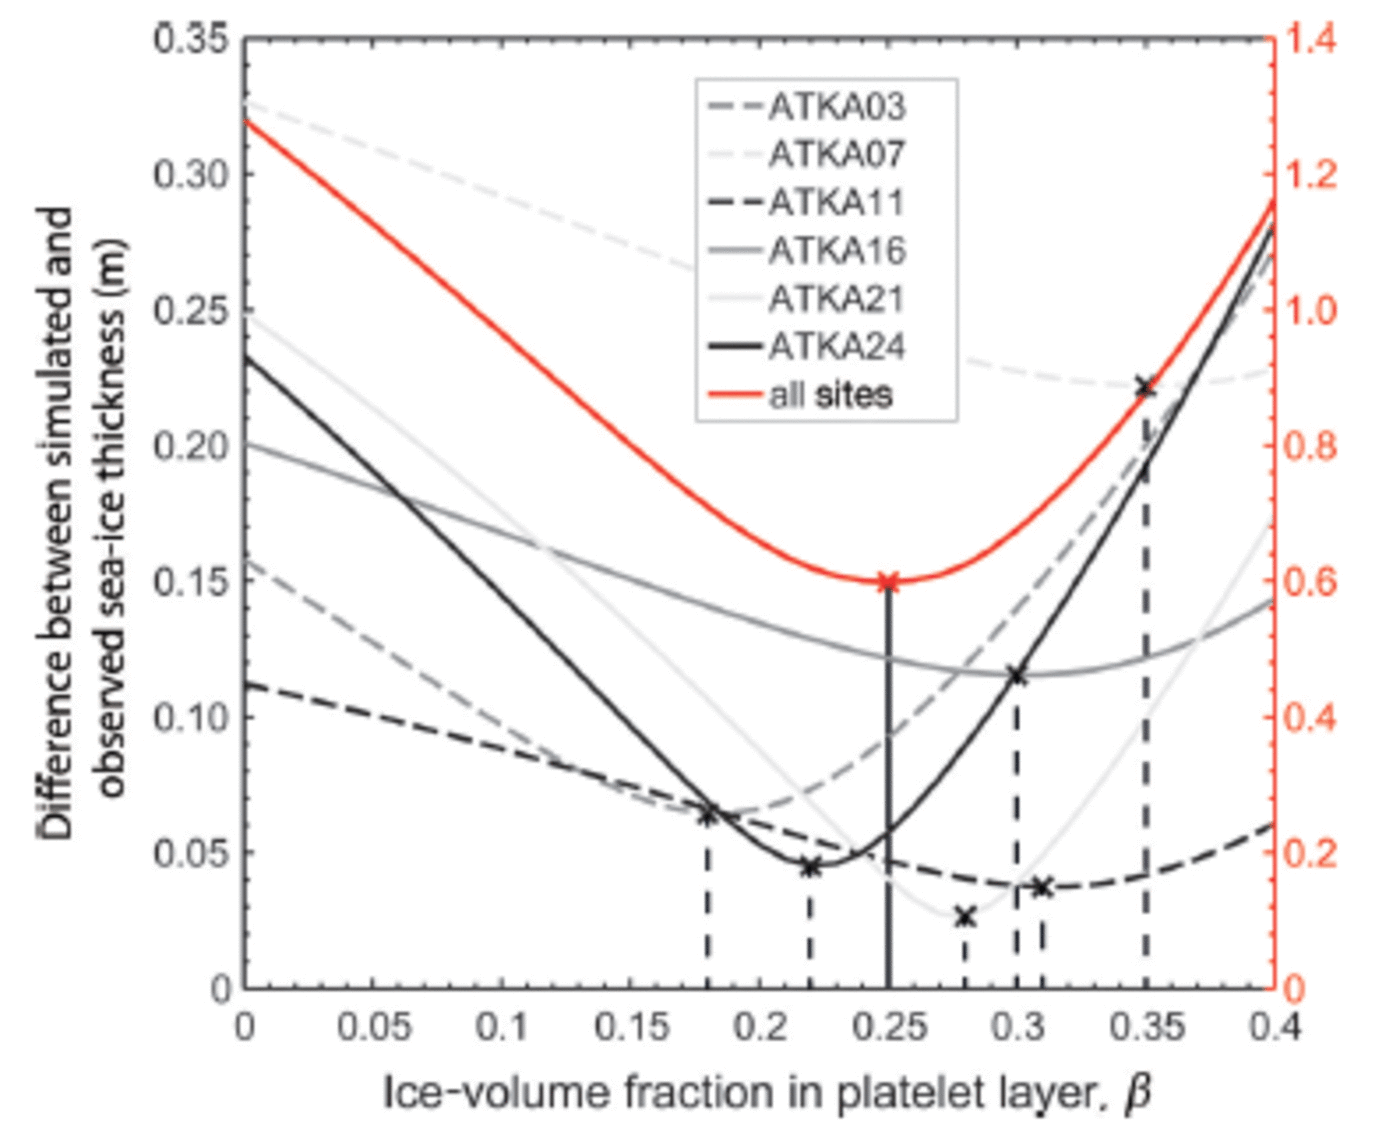
Due to substantial differences in initial formation dates, dynamic growth and snow cover among the study sites, we simulated local sea-ice growth for each site separately. Despite the high albedo of 0.9, the model results indicate that snow ablation would have taken place in summer when forced by the observed downwelling radiation. The control simulations without any ice platelets in the water column below the fast ice (B = 0) are depicted as gray areas in Figure 3, with the differences between them and the observed thickness hatched. In order to match the measured temporal evolution of the sea-ice thickness, the simulations were repeated, varying /3 between 0 and 0.5 in steps of 0.01. After each run, the difference from the measured sea-ice thickness was determined (Fig. 4). By minimizing this discrepancy, we were able to identify a best-fit /3 for each site. The computed best-fit values of β ranged from 0.18 (ATKA03) to 0.35 (ATKA07), while intermediate values were 0.22 (ATKA24), 0.28 (ATKA21), 0.30 (ATKA16) and 0.31 (ATKA11). The simulated sea-ice thickness at each site with its best-fit β is also shown in Figure 3 (dashed curve). In order to calculate an average ice-volume fraction, we determined the combined difference between simulations and observations at all sites and samplings. By addition of all curves and subsequent determination of an overall minimum, we obtained an average β of 0.25 (Fig. 4, red curve). In contrast to a calculation of the arithmetic mean, in this approach the sampling sites with less-consistent measurements, resulting in a flatter curve (e.g. ATKA07), were weighted lower.
The difference between simulated and observed sea-ice thicknesses with variable ice-volume fractions in the platelet layer.
Sub-ice platelet-layer thickness
Figure 5 shows the evolution of the platelet-layer average thickness, z p, at the six sites, along with a location map of the area and selected oceanographic data, as recorded by the CTD below the northern part of the ice shelf. The ice shelf is grounded in the south and east of Atka Bay (Fig. 5), resulting in ice rises (dark gray) and ice rumples (dashed curves), where no water exchange with the cavity is possible. The direction and magnitude of the Antarctic Coastal Current (ACoC) are mostly governed by wind patterns and tides, leading to small-scale fluctuations (even reversals) and high seasonal variability (Reference Fahrbach, Rohardt and KrauseFahrbach and others, 1992).
Platelet-layer thickness at the six sampling sites on Atka Bay fast ice in 2012/13, along with oceanographic conditions recorded at a measurement site below the Ekström Ice Shelf. (a) Location map of the study area. Sampling sites are indicated by symbols (ATKA03: star; ATKA07: diamond; ATKA11: inverted black triangle; ATKA16: gray circle; ATKA21: gray triangle; ATKA24: gray square) and grouped into western, central and eastern sites. The location of the oceanographic measurements in (c) is indicated by the dot and the arrow. The two other arrows depict the two extremes of the strength and direction of the Antarctic Coastal Current in this area. (b) Sub-ice platelet-layer thickness evolution at the different sites, with symbols corresponding to their location according to (a). (c) In situ temperature (black) and corresponding surface freezing point (gray) of the water at a location below the northern Ekström Ice Shelf in 2012/13. When the temperature is below the surface freezing point, the water is potentially supercooled. The shaded area indicates the continuous inflow of warm water masses. (d) Water depth of the corresponding temperature record.
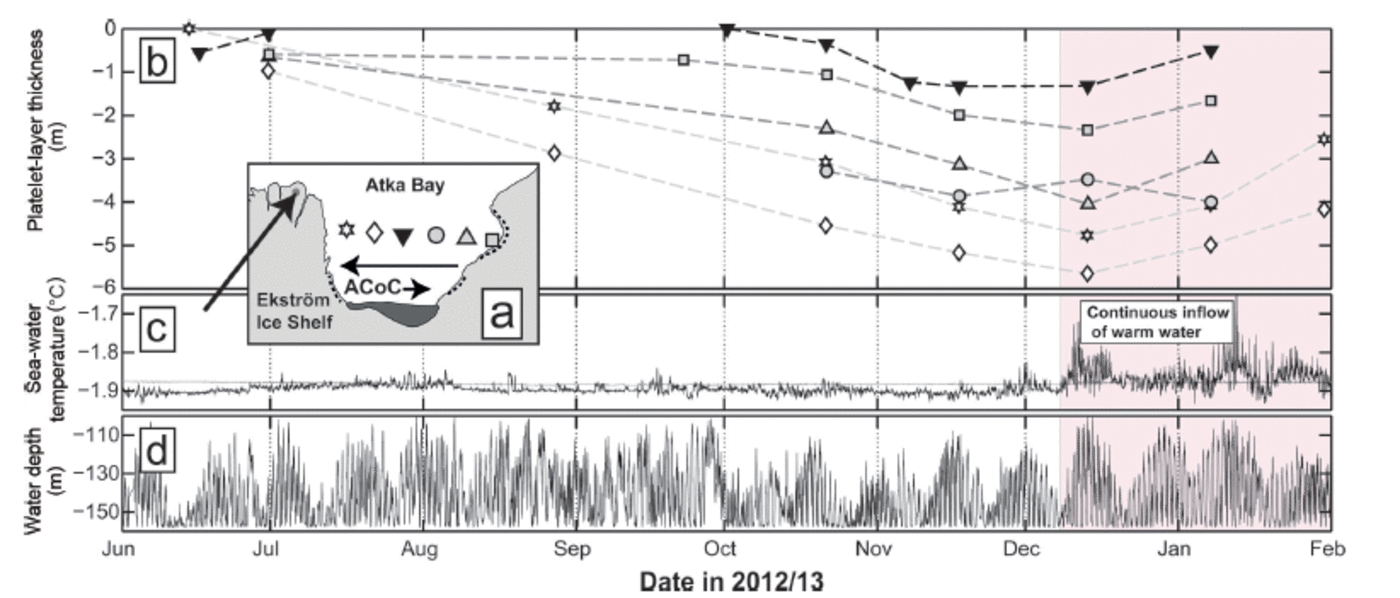
The seasonal cycle of z p (Fig. 5b) showed a nearly linear increase at all sites between June and December 2012. Due to equipment failure and the break-up in August 2012, the time series at ATKA16 only started in October 2012. z p reached its maximum in December 2012 at five sites. The maximum at ATKA16 occurred in January 2013. This was most likely due to an underestimation of z p in December 2012, which is an average of only two measurements. z p was generally highest at the two westernmost sites (z p ˃ 4 m in December 2012), compared with the other sites (z p ˂ 4 m). The spatial distribution of z p revealed a general increase towards the center of Atka Bay, with local maxima at ATKA07 and ATKA16. Of our sites, ATKA07 obtained the maximum observed platelet-layer thickness (5.65 m, December 2012), while ATKA11 recorded the lowest maximum platelet-layer thickness (1.32 m, December 2012). We attribute this to an export of platelets into the open ocean during the August 2012 break-up. The amount is unknown and it cannot be assessed whether an absolute maximum in the center of Atka Bay would be observed under normal conditions. However, the small amount of platelets at the beginning of the measurements in June 2012 and the low accumulation rate after October 2012 suggest that a local minimum was to be expected in this area. Since sporadic measurements at other sites in southern central Atka Bay yielded thicknesses of up to 10 m, and assuming that z p is generally lower in the northern part of Atka Bay, we estimate a bay-wide average of 4 m in December.
Figure 5c and d show the time series of sub-ice-shelf water temperature, the corresponding surface freezing point and the depth of the instrument during the temperature measurement. The depth variations revealed a 14 day cycle overlying the 12 hourly tidal cycle. The depth varied between 100 and 155 m, reflecting the strength and direction of the tidal- and wind-induced ACoC. The maximum depth of 155 m was limited by the length of the cable, while the ACoC was strong enough to lift the instrument to depths as shallow as 100m. In this sense, the instrument became a vertical profiler of the water column between 100 and 155 m. The water temperatures ranged from -1.94 to -1.6°C. It is apparent that the in situ temperature of the water column was mostly below the surface freezing point between June and December 2012. At the beginning of December 2012, the water temperatures of nearly the entire water column rose above the surface freezing point. The high temperature variability indicated that the water column was also very inhomogeneous between December 2012 and February 2013. At the same time, the highest temperatures were measured at shallower water depths.
The video recordings of CAM2 indicated that platelet accumulation was not the result of a uniform flux of platelets. Instead, a small continuous upward flux was overlaid by periods of very high fluxes with a time span usually ˂˂1 hour (Fig. 6). Speed and direction of the ice platelets were highly variable, and most likely depended on their volume and the influence of tidal currents and local turbulences.
Video still images from under-ice video recordings. (a) Masses of ice platelets float upwards during a high-flux event. (b) ‘Normal’ conditions at the end of November 2012.

Upon arrival at the sea-ice/platelet-layer bottom, crystals of different sizes and shapes integrated into a porous layer in random orientations (Fig. 7). The individual platelets in the bottom part were not firmly fixed in the lattice, but were still prone to resuspension by turbulence and strong currents. Small filaments of phytoplankton growing at the platelet edges were frequently observed. These provide a rich food source for amphipods grazing the platelet layer, which were observed in great numbers on several occasions in November and December 2012 (Fig. 7d).
Video still images of the platelet layer. (a) Single ice platelets several centimeters wide and <0.001m thick stick together to form a porous layer. (b) Close-up of an ice platelet. (c) Measuring the platelet-layer thickness with a metal bar (0.25 m). (d) Amphipods (<0.02 m) grazing the platelets for phytoplankton growing at the platelet edges.

Sea-ice texture and growth history
As seen from the texture analysis of a 1.94 m long sea-ice core obtained at ATKA24 in mid-December2012 (Fig. 8), the level sea ice in this area grew predominantly thermodynamically, with no indications of ridging or rafting. Satellite imagery revealed the establishment of a closed sea-ice cover at this site around 25 May 2012. This core is therefore representative of thermodynamically grown fast ice, but with a comparatively late formation date. Each core depth was assigned an approximate date of formation by comparison with the sea-ice thickness evolution at that site (Fig. 3).
Crystal structure of horizontal (H) and vertical (V) thin sections of a sea-ice core retrieved at ATKA24. The black areas represent segments where no data are available. The Schmidt equal-area net diagrams (right) depict the c-axis orientations of samples indicated by a red border.

Horizontal and vertical thin sections (Fig. 8) revealed a typical granular texture in the early period of formation (25 May to early June 2012). This is an indication of typical wind- and wave-induced growth, especially since snow ice did not contribute to sea-ice growth at this location. This granular ice contributed ∼0.12 m (6%) of the total sea-ice thickness. The texture in the following 1.5 m (77%) mostly resembles that termed draped platelet ice by Reference Jeffries, Weeks, Shaw and MorrisJeffries and others 1993, their Fig. 10b and c), Reference Tison, Lorrain, Bouzette, Dini, Bondesan and venardTison and others 1998, their Fig. 1a) and Reference Dempsey, Langhorne and RobinsonDempsey and others 2010, their Fig. 4 and 5). According to JReference Jeffries, Weeks, Shaw and Morriseffries and others (1993), those crystals are less angular, more equidimensional and have wavy, uneven edges. The lower 0.32 m (17%) of our core consisted of blade-like crystals, partially also with wavy edges. These resemble the bladed platelet ice shown by Reference Jeffries, Weeks, Shaw and MorrisJeffries and others 1993, their (Fig. 11), Reference EickenEicken and Lange 1989, their Fig. 5) and Reference Dempsey, Langhorne and RobinsonDempsey and others 2010, their Fig. 4 and 5). The individual crystals in this part have various sizes, with crystal lengths of 0.01-0.1 m, even in the same thin section. As apparent from the Schmidt net plots (Fig. 8, right-hand side), the crystal c-axis orientations showed a random distribution for all the analyzed samples. This distribution is typical for platelet ice (Reference DempseyDempsey and Langhorne, 2012).
Discussion
Seasonal cycle of fast-ice thickness and snow cover
We have performed regular year-round measurements of fast-ice properties at Atka Bay since 2010. Although differences in dynamic-growth contribution, dates of formation and snow cover determine the sea-ice evolution at Atka Bay each year, the results of our fast-ice observations in 2012 are generally in accordance with field measurements performed in previous years. The seasonal fast-ice cover of 2011 started to break up in late February 2012. Satellite observations revealed that several smaller sea-ice floes remained in the embayment, reattached to the ice-shelf edge in the southwestern part and became second-year sea ice. In the second half of March 2012, initial sea-ice growth started, while easterly winds constantly pushed the thin ice towards the ice-shelf edge. Visual observations confirmed a closed fast-ice sheet in the western part of Atka Bay at the end of April 2012, while the rough surface indicated the large contribution of dynamic processes to sea-ice growth. This area of mixed first/second-year sea ice is also characterized by a high radar backscatter (Fig. 1; bright color, marked in green). (A more detailed description of fast-ice surface properties at Atka Bay and their influence on TerraSAR-X radar backscatter is presented by Reference PaulPaul and others, 2015.) Strong winds constantly cleared away thin sea ice in the eastern part, where a closed fast-ice sheet was finally established 1 month later, at the end of May 2012. Dynamic growth again led to a greater thickness at ATKA16 than at the easternmost sites. A GPS buoy on one of the floes broken up in August 2012 revealed that it had drifted into the central Weddell Sea by the time data transmission finally stopped due to a power failure (69°43.80 S, 45°49.90 W on 26 August 2013). New sea ice immediately started to grow in the break-up area, but was cleared out of the embayment by persistent winds. At the beginning of October 2012, a closed fast-ice cover was again formed in the break-up area (Fig. 1; marked in red) after the grounding of the large iceberg B15G in front of Atka Bay.
The great thicknesses and local variability (Fig. 3) confirm that dynamic growth contributed to sea-ice formation at ATKA03, ATKA07, ATKA11 (early) and ATKA16. No dynamic growth was observed at ATKA21 and ATKA24, where initial formation was delayed until May 2012. Reference KipfstuhlKipfstuhl (1991) and Reference Günther and DieckmannGünther and Dieckmann (1999) found maximum sea-ice thicknesses of 2.19 and 2.17 m, and snow depths up to 0.62 m, at their study site ∼3 km southwest of ATKA03 (70°35.05'S, 8°8.41'W) in 1982 and 1995, respectively. Our results showed a higher maximum thickness of 2.56m at ATKA03, which may be attributed to higher growth rates due to increased upward conductive heat flux, owing to the lack of snow. While the small snow depths at ATKA24 were associated with topographic/local-wind patterns in close proximity to the ice shelf (∼1 km away), the lack of snow at ATKA03 is explained by the presence of a small, grounded iceberg ∼2 km to the east. In 2010 and 2011, we observed much higher snow depths (∼0.8m in December) in the western part of Atka Bay. While an east-west gradient in snow depth is expected, due to the prevailing wind conditions and consequent snow redistribution, local topographic features (e.g. icebergs and pressure ridges) alter snow accumulation locally (e.g. at ATKA03 and ATKA16). This gradient generally introduces additional variabilities in sea-ice growth rates, and at the same time opposes the gradient in dynamic growth. For example, the large contribution of dynamic thickening in the west of Atka Bay is partly compensated for by a lower thermodynamic growth, due to the greater snow depth.
Snow-ice formation is a major contributor to pack ice in the Southern Ocean (Reference Eicken, Fischer and LemkeEicken and others, 1995; Reference Jeffries, Krouse, Cushing and MaksymJeffries and others, 2001). Reference Günther and DieckmannGünther and Dieckmann (1999) observed no negative freeboard at Atka Bay during their study. Our results agree with the findings of Reference KipfstuhlKipfstuhl (1991), who found flooding in areas with snow depths greater than 1 m. However, the relative number of negative freeboard observations was very low. An exception was the area of new ice with a negative freeboard in November 2012. The sea ice there became permeable at the beginning of December 2012, when subsequent surface flooding and refreezing of slush resulted in a 0.15 m thick, fine-grained layer of snow ice. But, since such a late formation and the resulting low thickness is usually not observed, we consider the contribution of snow-ice formation to total sea-ice mass at Atka Bay to be very low, despite the thick snow cover. This finding is directly linked to the presence of ice platelets below the fast ice. Through its buoyancy, the platelet layer effectively increases the freeboard and simultaneously reduces the occurrence of surface flooding and subsequent snow-ice formation, which would otherwise be more frequent. The strength of this effect depends on the thickness and ice-volume fraction of the platelet layer.
Seasonal cycle of the platelet layer
Reference Günther and DieckmannGünther and Dieckmann (1999) took advantage of the buoyancy effect and used Archimedes’ law to calculate the platelet-layer thickness during their study. They obtained a platelet-layer thickness of ∼1.2m in December 1995. Reference KipfstuhlKipfstuhl (1991) used a sinking weight of 1 kg to determine the depth at which it sank freely. By doing so, he was able to provide an estimate of a 4 m thick platelet layer in November 1982. Neither study provided an uncertainty estimate. While our results obtained with the ‘metal-bar’ method yield good agreement with the ‘sinking-weight’ method of Reference KipfstuhlKipfstuhl (1991), the results of Reference Günther and DieckmannGünther and Dieckmann (1999) suggest that either the uncertainty in their method is very large or the platelet accumulations were profoundly different between the years. We consider the ‘metal-bar’ method as the most robust and exact of the three procedures. Finally, our result of platelet-layer thicknesses of several meters is also in accordance with Reference EickenEicken and Lange (1989), who found platelet layers of ˃5 m below fast ice at Drescher Inlet.
We observed ice-platelet accumulations under the fast ice as early as June (Fig. 5). This is in accordance with Reference Günther and DieckmannGünther and Dieckmann (1999), while Reference KipfstuhlKipfstuhl (1991) noticed ice platelets in boreholes as early as the end of April. The onset of ice-platelet accumulation below the fast ice of McMurdo Sound was also found to be variable. Reference Gough, Mahoney and LanghorneGough and others (2012) recorded ice-platelet growth on suspended ‘hot wires’ in mid-July and a thin platelet layer of 0.02 m in early August, while Reference Leonard, Purdie, Langhorne and HaskellLeonard and others (2006) identified a modified sea-ice texture in first-year sea-ice cores as early as April. Like similar structured studies involving the evolution of platelet-layer thickness, we observed a steady increase throughout the winter and spring. However, results obtained from CAM2 near the western ice-shelf edge in November 2012 suggest that the ice-platelet accumulation is mainly a result of episodic events of high flux overlying a very low continuous flux. This episodic flux was also observed in McMurdo Sound, where Reference Leonard, Purdie, Langhorne and HaskellLeonard and others (2006) interpreted episodically present acoustic scatterers in the water column as a flux of buoyant platelet crystals.
Below McMurdo Sound fast ice, ice platelets have also been observed growing while already attached to the fast ice above, rather than being advected from depth (Reference Smith, Langhorne, Haskell, Trodahl and FrewSmith and others, 2001). Reference Smith, Langhorne, Frew and VennellSmith and others (2012) found that single ice platelets attached to the fast-ice bottom grow in discontinuous, episodic bursts, mainly depending on the influence of variable currents during periods of continuous supercooling directly below the fast ice. While the potential supercooling observed under the front of the Ekström Ice Shelf throughout the winter (Fig. 5c) is indicative of ice-platelet formation at depth, we currently have no indication of in situ supercooling directly below the fast ice. As the rising ice platelets observed in the videos were also already large in diameter, we hypothesize that the main mechanism for the establishment of the Atka Bay platelet layer is crystal growth at depth, while growth at the ice/water interface is of minor (if any) importance. This is in accordance with the conclusions of Reference EickenEicken and Lange (1989), who suggested that the platelets in the southeastern Weddell Sea (pack ice) most likely form at greater depth.
Very little is known about the currents in the Ekström Ice Shelf cavity. Reference Nicolaus and GrosfeldNicolaus and Grosfeld (2004) using model studies found that the circulation is dominated by a strong cyclonic gyre, taking half a year between eastern inflow and western outflow. Like Reference Neckel, Drews, Rack and SteinhageNeckel and others (2012), they did not find any evidence for marine-ice accretion under the ice shelf itself. The presence of ice rises and rumples east of Atka Bay (Fig. 1) and the spatial distribution of ice platelets suggest that they are mainly advected from the area north of Neumayer III. As revealed by fluctuations of CTD recorded pressure (Fig. 5d), the magnitude of the ACoC is highly variable in the region (Reference Fahrbach, Rohardt and KrauseFahrbach and others, 1992). Quantification of the current velocity derived from the pressure data is generally possible and currently under investigation. Tidal- and wind-induced currents may cause turbulence in the cavity when the predominantly westward ACoC weakens or even reverses in direction. The resulting turbulent flow is likely to provide transport for the platelet crystals (Fig. 5a). If this is true, a significant amount of supercooled water would be transported into the open ocean along the main current direction. Currently, we have no direct evidence for this hypothesis, but studies in the southwestern Weddell Sea (e.g. Reference EickenEicken and Lange, 1989) found accumulations of ice platelets far from the coast, which agrees with our hypothesis.
As apparent from the evolution of water temperatures, the declining thickness of the platelet layer in December 2012 at nearly all study sites (Fig. 5b) is linked to the inflow of warm water masses and subsequent melt of ice platelets. Additional under-ice CTD casts in December 2012 revealed that warm surface water penetrates into Atka Bay from the east. At the same time, the buoyant ascent of ice platelets visible in the recordings ceased completely. Apart from the shrinking platelet layer, only a very slight bottom melt is apparent from the thickness data in Figure 3. Preliminary results (not shown) from high-resolution temperature profile data suggest that at ATKA03 no bottom melt occurred whatsoever. In addition, sea-ice cores taken in December 2012 showed a slight increase in sea-ice porosity from interior melt. Although we do not quantify the process here, the platelet layer acts as an efficient buffer between the fast ice and the incoming warm water in summer (Reference EickenEicken and Lange, 1989). Usually the increased instability of the fast-ice cover through interior melt combined with tides and strong winds, as well as a pack-ice-free zone in front of the Ekström Ice Shelf, would lead to fast-ice break-up early in the following year. The flocking effect of iceberg B15G in front of Atka Bay (Fig. 1) held the 2012 fast ice in the bay, so 2013 saw second-year fast ice in the region. The iceberg itself detached and drifted westwards in August 2013. It is unclear whether the iceberg also modified the properties of the platelet layer in 2012 compared with other years.
Ice-volume fraction in the platelet layer
While ice platelets accumulate episodically below the fast ice during winter, the advancing freezing interface incorporates the upper portion of the underlying platelet layer into the sea-ice fabric by freezing of the interstitial water. As a result, part of the solid fast ice originates from heat loss to the ocean. This is in contrast to the usual process of heat conduction to the atmosphere, which gives rise to congelation growth. In this sense, the energy- and mass balance of the fast ice is altered and must be accounted for. To quantify this impact, it becomes necessary to determine the ice-volume fraction, β, in the platelet layer. The model results (Fig. 4) suggest a bay-wide average β of 0.25, with individual results 0.18-0.35.
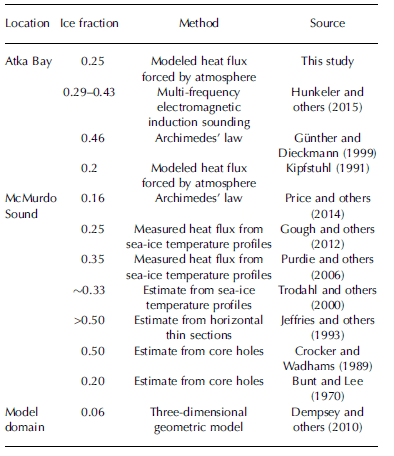
Ice-volume fractions in the platelet layer have been estimated in a number of previous investigations (Table 3). Our average β of 0.25 agrees well with the findings of Reference KipfstuhlKipfstuhl (1991), who derived a β of 0.2 from their comparison between a thermodynamic model and sea-ice thickness observations at their study site 3 km southwest of ATKA03. In addition, our result is in good agreement with a recent study at McMurdo Sound by Reference Gough, Mahoney and LanghorneGough and others (2012), who calculated an ice-volume fraction of 0.25 from measured ice-temperature profiles and claim their ‘result being the most precise to date’. This suggests that our growth model results are reasonably good. Three studies (Reference Crocker and WadhamsCrocker and Wadhams, 1989; Reference Jeffries, Weeks, Shaw and MorrisJeffries and others, 1993; Reference Günther and DieckmannGünther and Dieckmann, 1999; Table 3 ) obtained significantly higher results (/3 ˃0.46), which we attribute either to profoundly different conditions or unsuitable methods. Reference Dempsey, Langhorne and RobinsonDempsey and others (2010) attribute their low result (β = 0.06) to in situ platelet growth and secondary platelet movement, which were not accounted for in their model.
Selected estimates for the ice-volume fraction of the platelet layer, modified after Reference Gough, Mahoney and LanghorneGough and others (2012)
Possible uncertainties in our calculation arise from the fact that some physical processes are not implemented in the model (e.g. gravity drainage) and from constant parameters (e.g. albedo, salinity profile and sea-ice and snow densities). However, the forcings of downward radiant heat fluxes are expected to be very reliable, as they were derived using data from a World Meteorological Organization standard meteorological observatory. Some uncertainty is introduced through the sensible and latent heat fluxes derived from the bulk method. Further potential uncertainties arise from the limited information about snow depths, individual dates of freeze onset, the uncertainty of sea-ice thickness measurements and the date of first platelet accumulation at each site. Furthermore, our approach of introducing a simple growth-rate modification does not reflect the true physics involved in this process. One example is the possible supercooling directly below the fast ice (Reference Smith, Langhorne, Frew and VennellSmith and others, 2012), though this might not be as important as it is below McMurdo Sound fast ice. At the same time, our metal-bar measurements revealed that the resistance of the platelet layer, and consequently the ice-volume fraction, is very variable, temporally as well as spatially (even during a single measurement). In addition, our method is, in principle, only suitable for determining the ice-volume fraction of the part which is already incorporated into the solid sea ice, not taking into account the lower platelet layer. This leads to additional uncertainties, particularly under the assumption that the upper part is likely compressed by the buoyancy pressure of the underlying ice platelets.
Since these uncertainties are so manifold, we performed sensitivity studies to identify the parameters and constants with the biggest impact on β. Simulations were set up to yield β = 0.25 as a control, then relevant input parameters and constants were varied by up to ±5%, one at a time. In the following, the absolute minimum and maximum variations corresponding to the 5% are indicated in parentheses. The results show that the model is comparatively insensitive to changes in downward shortwave radiation (0-24 W m 2 ), wind speed (0.01-1.1 m s 1 ), relative humidity (2.6-4.6%) and constants such as sea-ice density (46kgm −3 ), snow density (1 6 kg m–3) and surface albedo (0.05). In contrast, the outcomes for β vary strongly with varying sea-ice thickness (0.02-0.14m), oceanic heat flux (+ 2 Wm –2), air temperature (0.066-2°C), as well as downward longwave radiation (5.7-15.1 W m 2 ) . The sea-ice thickness measurements are considered reliable, since the measurement itself has a very low uncertainty (±0.01 m) and most data points are an average of up to five spot measurements. A positive oceanic heat flux is very unlikely to be present during sea-ice growth, due to the presence of the platelet layer. Air temperature and downward longwave radiation are measured directly at Neumayer III with high accuracy. By far the largest influence is exerted by the variation of the upward longwave radiation (7 . 9-16 Wm –2), which is used to compute the surface temperature and to calculate the turbulent heat fluxes used as a model input. This significantly modifies the surface energy balance and heavily influences sea-ice thickness evolution and, consequently, β. Upward longwave radiation is, in principle, available from Neumayer III with the limitation that the surface temperature of the ice shelf naturally differs from that of the sea ice (as measured by the AWS). For this reason we applied a correction of + 8 W m 2 to upward longwave radiation after careful analysis of both datasets, finally yielding the best match to the EC flux data. Our study also revealed that, with larger variations of upward longwave radiation, more surface melt occurs and a strong deviation from the sensible and latent heat fluxes measured by the EC method is evident. These effects become even more apparent when increasing the variation above 5%. We therefore consider a corresponding uncertainty of ±0.05 as an upper limit. Since, according to our sensitivity study, the effect of a change in upward longwave radiation is as strong as that of all the other parameters combined, we estimate that their contributions sum to an additional uncertainty of ±0.05. We therefore estimate the overall uncertainty at 0.1, yielding /3 = 0.25 ± 0.1.
The impact of ice platelets on fast-ice crystal structure
The complete absence of columnar growth in a core representative of thermodynamical growth is atypical in most sea-ice covered areas. However, in our study region this seems to be the norm, due to the sustained contribution of ice platelets. Our texture analysis provides evidence that the ice platelets disrupted the potential columnar growth as early as June 2012, leading to a mix of incorporated ice platelets and interstitial congelation ice (Reference Jeffries, Weeks, Shaw and MorrisJeffries and others, 1993) in 94% of the core. However, the resulting texture is not always unambiguous. Sea-ice crystal structure is very variable and classification is not straightforward. Different analysts may describe the same texture entirely differently. This becomes especially evident when platelet ice is involved. Here c-axis measurements using the fabric analyzer provide independent confirmation, in agreement with our visually obtained texture classification. Although we currently have only a small number of analyzed samples, our data support the findings of earlier studies (Reference Dempsey, Langhorne and RobinsonDempsey and others, 2010) that there is no apparent distinction in the c-axis distribution between draped and bladed platelet ice, which are both characterized by a Schmidt net with randomly distributed points.
Until now it has not been clear which processes govern the shapes and sizes of the crystals, of which there is a large spectrum visible in our core. Reference Jeffries, Weeks, Shaw and MorrisJeffries and others (1993) and Reference Tison, Lorrain, Bouzette, Dini, Bondesan and venardTison and others (1998) suggest that this fabric may be related to a variable amount of supercooling in the ice-shelf water from which the ice platelets form. In this study we were unable to address this question. The transition from draped to bladed platelet ice is striking in our vertical thin sections, and analysis of the other cores needs to be completed to gain additional insights.
It should be noted that our results based on one core may present a significant overestimation when compared with the entire Atka Bay. The governing factor is the present sea-ice thickness (and to a lesser degree the snow depth) at a sampling site when a platelet layer starts to form. The greater this thickness, the lower is the remaining growth of solid sea ice during winter and, at the same time, the relative contribution of platelet ice. For our sampling sites in 2012 (Fig. 3), we would expect the least contribution of platelet ice atATKA07, as this site had a very high initial thickness (∼2 m) and only grew ∼1 m during winter. Estimating the fraction of platelet ice there as ∼30%, an appropriate estimate of the average bay-wide platelet-ice fraction would be ∼60%. Note that these numbers do not represent the contribution of ice platelets to the total sea-ice mass (next subsection), but rather the fraction of platelet-influenced crystal structure.
Contribution of ice platelets to total fast-ice mass and freeboard
In order to assess the contribution of ice platelets to the total sea-ice mass and the influence on freeboard, it is necessary to separate the part of sea ice grown by heat conduction to the atmosphere on the one hand, and the ice-platelet formation by relieved supercooling in the water column on the other. Based on our field observations and model results, we assume β = 0.25, initial sea-ice formation in April and the accumulation of a moderate snow cover from June onwards. A sea-ice growth simulation with the model then yields a December maximum thickness of solid fast ice of 2 m. This is a reasonable estimate for the conditions of 2012, since the quick build-up of thickness in the west by wind stress is at least partly compensated by a delayed freeze onset in the east. Under these conditions, and taking into account that ice-platelet accumulation starts in June, our growth model suggests that the lower 1.2 m of solid sea ice contains incorporated ice platelets. This estimate is also supported by the sea-ice texture. Their total mass then amounts to an effective thickness of ∼0.3 m, or 15% of the solid sea ice. This thickness gain is on the same order of magnitude as that found in the theoretical study of Reference Heil and GerlandHellmer (2004). He calculated that the ice-shelf/ocean interaction may contribute up to 0.2 m of the sea-ice thickness over significant areas of fast and pack ice in the Southern Ocean. However, his approach did not explicitly take into account the contribution of ice platelets. Subtracting this contribution of incorporated ice platelets, the remaining sea-ice thickness becomes 1.7 m, or 85%, as a result of growth by heat conduction from the ocean to the atmosphere. Multiplication of the average z p = 4 m with β = 0.25 ± 0.1, and addition of the contribution of incorporated ice platelets, yields an effective sea-ice thickness equivalent to ∼1.3 ±0.52 m as a result of heat loss to the ocean during ice-platelet formation at depth. This corresponds to 43 ± 12% of solid and loose sea ice altogether.
Because the thickness of the platelet layer changes with time, its contribution to freeboard is also variable. Here we perform a sample calculation of how the additional buoyancy of the ice platelets influences freeboard under the assumption of hydrostatic equilibrium, using Archimedes’ law:

where the subscript‘f’ refers to freeboard, ‘s’ to snow, ‘si’ to sea-ice, ‘p’ to platelet layer and ‘w’ to water; z is the thickness and p is the density of the respective medium. Again considering the conditions in December, we assume an average sea-ice thickness of 2 m, a platelet-layer thickness of 4 m and β = 0.25 ± 0 : 1 . Using typical densities (pw= 1032.3 kg m 3, psi = 925 kg m–3 and p s = 330 kg m 3 ), the resulting freeboard is ∼0.11 ± 0.05 m higher than the situation where underlying platelets are not present, independent of the snow cover.
Basalt melt of the Ekström Ice Shelf
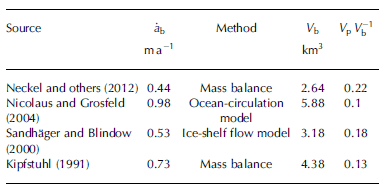
Reference KipfstuhlKipfstuhl (1991) calculated that the volume of ice platelets accumulated under Atka Bay landfast sea ice accounts for 12% of the basal melt volume observed under the Ekström Ice Shelf (for β = 0.2). Multiplication of the average effective thickness equivalent of ice platelets found in this study (1.3 m) by the fast-ice area (∼440 km2) yields a total annual platelet volume of Vp = 0.57 km3 underlying the fast ice of Atka Bay. Table 4 shows average basal melt rates of the (main) western part of the Ekström Ice Shelf from selected studies, along with total basal melt volume calculated for an area of 6000 km2. Based on our Vp and recent results of Reference Neckel, Drews, Rack and SteinhageNeckel and others (2012) for basal melt from mass-flux divergence, we find that more than one-fifth of the basal melt volume of the Ekström Ice Shelf is refrozen as loose and incorporated platelets.
Ekström Ice Shelf basal melt from previous studies and contribution of ice platelets to total melt volume.  : mean basal melt rate; V
b: volume of basal melt for an area of 6000 km2; V
p
V
b
-1: fraction of ice-platelet volume from basal melt volume
Summary and Conclusion
We have investigated the seasonal evolution of landfast sea ice and the underlying platelet layer at Atka Bay, eastern Weddell Sea, during 2012/13. Sea-ice formation started in March, and variable sea-ice conditions were observed across Atka Bay, with different dates of initial formation, contribution of dynamic growth processes and snow accumulation. Sea-ice thickness was ∼2 m at the end of the growth season, while dynamic growth and snow depths of up to 1m introduced large spatial variability. A thick platelet layer was observed underlying the entire solid fast-ice sheet, with first observations of platelets in boreholes and sea-ice cores in June. Potentially supercooled water was present under the ice shelf during the entire winter. Under-ice video recordings revealed episodic events of high upward fluxes of ice platelets, overlying a very low continuous flux. The platelet-layer thickness increased until December, with a bay-wide average of 4 m and a local maximum of 10 m. When warm surface water intruded into Atka Bay at the beginning of December, ice-platelet accumulation ceased and the platelet layer thinned, shielding the solid ice above from significant bottom melt. Through the additional buoyancy, surface flooding and snow-ice formation were rarely observed, despite the thick snow cover. Using a one-dimensional thermodynamic sea-ice model, we found a best-fit ice-volume fraction of β = 0.25 ± 0.1 in the platelet layer. This corresponds to an effective sea-ice thickness equivalent of 1.3 m as a result of heat loss to the ocean, which is nearly half the combined mass of solid sea ice and the underlying platelet layer. In relation to Ekström Ice Shelf basal melt, we found that ˃20% of the basal melt volume is refrozen as ice platelets trapped under Atka Bay fast ice. It is likely that the oceanographic conditions in this area promote the transport of potentially supercooled water out of the cavity, possibly leading to further ice-platelet formation away from the coast.
In conclusion, this study highlights the dependence of coastal sea-ice regimes on local ocean/ice-shelf interactions. Basal processes mostly dominate sea-ice properties, with platelet accumulations below the solid sea ice directly impacting sea-ice energy and mass balance. As a consequence, uncertainties are introduced into numerical models which do not account for heat loss to the ocean. Furthermore, the additional buoyancy complicates sea-ice thickness retrieval by altimetry techniques, an effect which adds to other difficulties of remote-sensing techniques in coastal areas (e.g. complex coastlines and snow cover). Since this study was limited to Atka Bay and the Ekström Ice Shelf, it is necessary to gain more insight into the temporal and spatial variability of ice-platelet accumulations over larger areas under Antarctic sea ice.
Although no obvious changes in sea-ice and oceanographic conditions were found in this study compared with investigations 30 years ago, this will not necessarily be the case in the future. Reference Hellmer, Kauker, Timmermann, Determann and RaeHellmer and others (2012), Reference Pritchard, Fricker, Vaughan and PadmanPritchard and others (2012) and Reference DepoorterDepoorter and others (2013) have previously highlighted that the complex interactions between the Southern Ocean, the Antarctic ice shelves and the sea-ice cover have significant global implications, and they concluded that much more process understanding related to ice-shelf cavities is needed. But since sub-ice-shelf processes are particularly difficult to investigate in situ, alternative approaches are needed to detect eventual changes in this complex system. Studies of fast-ice properties are comparatively easy to conduct, and we emphasize that fast-ice characteristics, especially near ice shelves, may provide a very sensitive, and yet practical, indicator of the conditions and possible changes in the Antarctic. Hence there exists an urgent need to perform these studies on a more regular and circum-Antarctic basis, for example by extending and intensifying the work in the Antarctic Fast Ice Network (Reference Heil and GerlandHeil and others, 2011).
Acknowledgements
We thank the Neumayer III overwintering teams 2010–13 for their dedicated fieldwork. We thank the German Aerospace Center (DLR) for the TerraSAR-X image, and Christine Wesche for post-processing and calibrating the satellite data. We are grateful to Holger Schmithüsen and Clemens Drüe for help with the meteorological and flux data. We also appreciate the helpful suggestions of Christof Lüpkes, Wolfgang Dierking and Martin Losch, and the technical support of Bernd Loose and Uwe Baltes. We thank Lars Kindermann for the CTD data and Ilse van Opzeeland for inspiring us with the platelet video recordings. We also thank Sepp Kipfstuhl and Ilka Weikusat for help with c-axis determination. Our research at Neumayer III would not have been possible without the support of the AWI logistics. This work was supported by the German Research Council (DFG) in the framework of the priority programme ‘Antarctic Research with comparative investigations in Arctic ice areas’ grants SPP1158, NI 1092/2 and HE2740/12, and the Alfred-Wegener-Institut Helmholtz Zentrum für Polar- und Meeresforschung. Supplementary data to this paper are available at http://dx.doi.org/10.1594/PANGAEA.824434. Finally, we thank two anonymous reviewers whose comments significantly improved the manuscript.



