I. INTRODUCTION
Solar-driven photocatalytic decontamination has attracted extensive interest since it provides a promising strategy for solving many environmental pollution problems that mankind is currently facing. The effectiveness of the photocatalytic processes is dictated to a great extent by the photocatalyst’s capability of absorbing solar light, as well as its ability to restrain the rapid recombination of photogenerated electrons and holes.Reference Chen, Liu, Yu and Mao1 Owing to physicochemical stable, low-cost, and environmentally benign properties, the well-known TiO2 semiconductor seems to be one of the candidates for this purpose, yet the wide band gap (3.2 eV) restricts its activity to the UV range. Thereby persistent efforts have been made to modify pure TiO2 sensitive to visible light, mainly including metal and nonmetal doping,Reference Choi, Park and Hoffmann2–Reference Umebayashi, Yamaki, Tanaka and Asai9 superficial deposition of noble metal,Reference Sun, Zhang, Liu, Wang and Mao10 dye sensitization,Reference Shao, Sun, Gao, Yang and Luo11 and composite-type.Reference Bessekhouad, Robert and Weber12–Reference Bian, Zhu, Wang, Cao, Qian and Li14 Of these methods, doping seems to be one of the most effective for the competences of introduction of localized oxygen vacancy states that are below the conduction band minimum (CBM) of TiO2 and incorporation of impurities that generate donor or acceptor states in the band gap, which both promote visible optical absorption.
Recently, bismuth-based mixed oxides have been widely investigated as visible light-driven photocatalysts, such as Bi2O3,Reference Hameed, Montini, Gombac and Fornasiero15 BiVO4,Reference Ren, Jin, Wang, Yang, Qiu and Yu16 Bi2WO6,Reference Zhou, Tian, Zhao, Liu, Kou, Chen, J.G, Yan and Zou17 Bi2Mo3O12 etc.Reference Masteri-Farahani and Hosseini18 It has been demonstrated that the band narrowing deduced from the contribution of Bi 6s orbitals to both the CB and the VB was responsible for the visible light response in these complex oxides. Therefore, it is expected that the doping with bismuth will be effective to extend TiO2 spectral response range to the visible region. On the other hand, TiO2 doped with Bi ions or other transition metal cations have been paid some attention in recent years,Reference Ji, Yang, Lv, Zhou and Sun19–Reference Xu, Chen and Fu23 whereas fewer researchers, to the best of our knowledge, have ever systematically studied doping amounts, structure modification, and corresponding crystallinity of those Bi-doped TiO2 for improving the visible light photocatalytic properties. Although very recently Hu et al.Reference Hu, Cao, Wang, Li, Chen, He, Fu, Shao and Zheng24 gave a new perspective for the Bi doping effect to Bi–TiO2, they studied only the effect of temperature and large Bi amount (mainly 5–65%). As the rate of photocatalysis is related to surface structure and crystallinity, mesoporous doped TiO2 with a much higher surface area, better distribution of the doped metal ions on TiO2 surface, and appropriate crystallinity is expected to provide enhanced photocatalytic performance.
In the present work, we report the preparation and characterization of mesoporous Bi-doped TiO2 through a facile sol-gel route, as well as the influence of calcination temperatures, the additive of a nonionic surfactant (polyethylene glycol, PEG), and Bi amounts on visible-light-induced photoactivities of the resulting products. 2,4-dichlorophenol (2,4-DCP), which has been widely used as wood preservative, anticorrosive rust production, fungicides, and pesticides for a long time,Reference Yin, Shen, Niu, Chen and Duan25 having strong denaturing effects on organisms, in addition, being difficult to be degraded by microorganisms and easy to bioaccumulate in human bodies, was chosen as a target environmental pollutant and for evaluating photocatalytic properties of the resulting products. It was demonstrated that the as-prepared mesoporous PEG-modified Bi-doped TiO2 exhibited an excellent visible-light photocatalytic activity for the degradation of the pollutants.
II. EXPERIMENTAL
A. Preparation of photocatalysts
Tetrabutyl titanate [Ti(OBu)4], bismuth nitrate pentahydrate [Bi (NO3)3·5H2O], and polyethylene glycol 6000 (PEG6000) with analytical grade from Sigma-Aldrich (St. Louis, MO) were used as the titanium source, the dopant source, and the structure-directing agent for preparing pure TiO2, Bi-doped TiO2 (denoted as BTO), and PEG modified Bi-doped TiO2 (denoted as PMBTO) samples.
A typical synthesis of PMBTO was as follows, 10 mL of Ti(OBu)4 dissolved in 40 mL of ethanol under continuous stirring for 30 min was added dropwise into a transparent mixed solution containing 10 mL of water, 2 mL nitric acid, 20 mL of ethanol, a desired nominal content of Bi(NO3)3·5H2O, and a certain amount of PEG6000. Pure TiO2 and BTO samples were also prepared by the above same procedure without adding Bi(NO3)3·5H2O and/or PEG6000. The resulting homogeneous pale yellow solution was stirred continuously for further 3 h and subsequently aged at room temperature for 2–3 days to obtain the gel. Subsequently, the gel was dried overnight at 80 °C under atmospheric pressure to eliminate the solvent. The milled dried gel was calcined at various temperatures for 2 h to remove the PEG6000 molecules and to consequently produce the desired photocatalysts. The as-prepared samples will hereafter be referred to as x-PMBTO-y/t and BTO-y/t, x% (x = 1, 3, 5, 7, and 9) denotes the nominal weight ratios of PEG6000 to Ti(OBu)4, y% (y = 1, 2, 4, 6, and 8) denotes the nominal molar ratios of Bi to Ti atoms, and t denotes the calcination temperature used (500, 600, and 700 °C). It should be noticed that the Bi(NO3)3·5H2O behaves as a sol-stabilizing agent because with the increase of Bi(NO3)3·5H2O amount more time is needed for gels’ formation.
B. Characterization of photocatalysts
The crystalline phases of the synthesized catalysts were analyzed by x-ray powder diffraction (XRD) using a Bruker D8 ADVANCE x-ray diffractometer (Bruker AXS Company, Karlsruhe, Germany) with Cu Ka radiation (λ = 0.154060 nm) at a high voltage of 40 kV in the range 10° ≤ 2θ ≤ 80° with a step of 0.02°. The average crystallite size was calculated according to the Scherrer equation. The sample powder was ultrasonically dispersed in ethanol and dropped onto carbon-copper grids for transmission electron microscopy (TEM) and high-resolution transmission electron microscopy (HRTEM) analysis using a JEM-2100HR (JEOL Ltd., Tokyo, Japan) operated at 200 kV. Thermogravimetric analysis of final powder was performed using a STA449c/1/41G thermal analyzer (Netzsch, Bavaria, Germany). A Micromeritics ASAP 2010 (Micromeritics Instrument Corp., Atlanta, GA) nitrogen adsorption apparatus was used to determine the structural properties of the samples including Brunauer-Emmett-Teller (BET) surface area, pore volume, and Barrett Joyner Halenda (BJH) pore size and distribution, based on nitrogen adsorption and desorption isotherms. Diffuse reflectance ultraviolet-visible light (UV-vis) spectra of the powders were measured at room temperature on a HITACHI U-3010 spectrophotometer (HITACHI, Tokyo, Japan).
C. Photocatalytic activity measurement
The photocatalytic activity of the as-prepared products was evaluated by the degradation of 2,4-DCP in aqueous solutions under visible light illumination. For all photocatalytic degradation experiments, a 250 W halogen lamp and an ultraviolet-filter glass were used to provide visible light, a cylindrical glass was used as the reactor, in which 0.1 g of photocatalysts was added into 200 mL of 2,4-DCP solution with an initial concentration of 10 mg/L. Prior to illumination, the suspensions were stirred in the dark for 30 min to achieve adsorption–desorption equilibrium of 2,4-DCP on the catalysts’ surface. The concentrations of 2,4-DCP were monitored with a high performance liquid chromatograph (HLPC, Shimadzu, Japan) equipped with a UV detector (SPD-10AV) and a Symmetry C18 column (250 × 4.6 mm). Mobile phase: methanol (HPLC grade) and water (80:20, volume); flow rate: 1.0 mL/min; injection volume: 20 μL; absorbance detection: 284 nm. During the course of illumination, 1.0 mL of suspensions was withdrawn periodically from the reactor and filtered (Millipore Millex 25 0.45 mm membrane filter) previously to HPLC measurements.
III. RESULTS AND DISCUSSION
A. Materials characterization
1. TG measurement
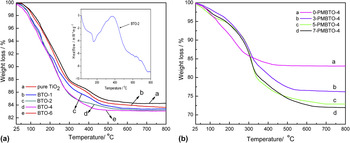
The TG curves for the precursors are shown in Fig. 1. In the present study a temperature range of 25–800 °C was used for all samples’ analysis. Figure 1(a) indicates that the pure TiO2 and BTO-y samples underwent a similar weight loss process. A rapid mass loss from 25 to 300 °C could be attributed to volatilization of physically absorbed water and residual –OH groups. A followed mass loss of the samples from 300 to 400 °C was due to the carbonization and burning of organic groups in gel structures, which could be explained well by an exothermic peak detected in a DSC curve at 350 °C [Inset in Fig. 1(a)]. Curves were obtained as flats after 500 °C, which meant that precursors had a little weight change. In the case of all processes, BTO-y samples had more weight loss than pure TiO2, and the more Bi-dopant the more weight loss was observed. Bagwasi et al.Reference Bagwasi, Tian, Zhang and Nasir26 had studied the properties of the bismuth and boron co-doped TiO2, observing that as the Bi amount was increased in the co-doped samples the amounts of surface adsorbed water and hydroxyl groups also increased which was identified by FTIR. Presumably, the differences of weight loss could be attributed to the more dehydroxylation as the Bi amount increased. Figure 1(b) depicts weight loss processes of BTO-4 and x-PMBTO-4 precursors. The curves demonstrated analogical significance with that of curves in Fig. 1(a) except two differences as follows. On one hand in the initial period, all x-PMBTO-4 samples lost weight less than BTO-4, and this might be due to the fact that the presence of PEG enhanced the adsorption of water and –OH groups on samples’ surface. On the other hand, x-PMBTO-4 precursors lost more weight than BTO-4 at the end of the analysis, and the curves became flat lines after 600 °C, indicating no PEG or residue carbon existed. Totally, the mass loss quantities were generally proportional to nominal PEG contents in samples because of burnout of PEG. It was concluded that the synthesized powder at 600 °C consisted of Bi/TiO2 were without any organic component.
TG curves for precursors: (a) pure TiO2 and BTO-y, (b) x-PMBTO-4.

2. XRD analysis
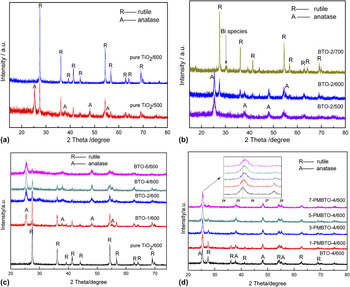
An x-ray diffraction (XRD) technique was used to characterize the crystal structure and crystal size of the samples. XRD patterns of the samples, viz. pure TiO2/t, BTO-2/t, BTO-y/600, and x-PMBTO-4/600 are shown in Figs. 2(a)–2(d). It is well-known that temperature plays a significant role in anatase (A) to rutile (R) phase transformation as evidenced in our case that the crystal structure of pure TiO2 calcined at 500 and 600 °C indicated a mixture phase (A/R) and a complete rutile phase (R), respectively, [shown in Fig. 2(a)]. Under the condition of the same thermal treatment temperature, doped samples of BTO-2/t possess larger anatase contents and smaller crystallite sizes than those of pure TiO2/t [Fig. 2(b)], indicating that Bi-ion increased the temperature of A-R phase transformation, or substantially inhibited A-R phase transformation of TiO2. It is worth noting that the peaks associated with Bi2O3 and BixTiOy(Bismuth titanate) in BTO-2 calcined at 700 °C were examined, which suggested that at elevated calcination temperature the Bi species were expelled from the bulk of TiO2 to the surface forming the Bi oxides.Reference Bagwasi, Tian, Zhang and Nasir26
XRD patterns of (a) pure TiO2/t, (b) BTO-2/t, (c) BTO-y/600 and (d) x-PMBTO-4/600.

It seems that the more Bi content in BTO samples the more conspicuous inhibition on A-R phase transformation, as demonstrated in Fig. 2(c). The characteristic diffractional peaks of anatase and rutile strengthened and weakened, respectively, with the increase of Bi-ion contents. Anatase remained as the dominant phase when the doping level reached 6 mol%. On the other hand, increasing the doping amount resulted in broadening in anatase peaks and this trend was indicative of an improvement in the crystallite size corresponding to the formation of smaller particles with larger specific surface area. No obvious diffraction peaks that could be attributed to the Bi-ion dopant were observed even at the highest doping level. In addition, no peak shift indicative of BTO-y samples were observed regardless of high doping level, manifesting that Bi atoms did not come into the lattices to substitute partly Ti4+ sites, and this coincided with the fact that the radius of Bi3+ (0.103 nm) is larger enough than that of Ti4+ (0.068 nm). All of these results suggested that Bi ions are more likely to be found as dispersed metal oxides over TiO2 without forming large crystallized structures so that they cannot be detected by XRD. The characteristic peaks of anatase (101) shift slightly to higher angles in PEG modified BTO-4/600 samples, as shown in Fig. 2(d) (and inset). It has been reported that the burnout of PEG with such high molecular weight would introduce large pore volumes into the crystal structure, which result in more crystal defects and cause slight changes in crystal parameters. It is worth noting that with the increase of PEG content, considerable effects for inhibiting A-R phase transformation, as well as broadening diffraction peaks or essentially suppressing the crystal growth to some extent were observed in our study, and this was possibly due to PEG that helps the stabilization of the anatase phase in the thermal treatment process, in agreement with previous results in the literature.Reference Sun, Zhang, Liu, Wang and Mao10,Reference Trapalis, Gartner, Modreanu, Kordas, Anastasescu, Scurtu and Zaharescu27
To investigate the effects of Bi-ion doping and PEG modification on crystal structure and A-R phase transformation, the average crystallite size was estimated from the line broadening of the corresponding XRD peak by using the Scherrer equation:Reference Xu, Chen and Fu23
 $$d = k{\rm{\lambda }}/{\rm{\beta }}\cos {\rm{\theta \quad,}}$$
where k is a constant, λ is the wave length of the x-ray, θ is the maximum angle of the characteristic peak and β is the width of the peak at half height. The relative fraction of rutile, X R, was calculated from the respective peak intensities using the following equation:Reference Choi, Park and Hoffmann2
 $$X_{\rm{R}} (\% ) = \{ 1 - (1 + 1.26I_{\rm{R}} /I_{\rm{A}} ) - 1\} \times 100\quad,$$
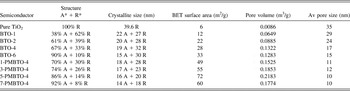
where I R and I A are the x-ray intensities of the rutile (101) and the anatase (110) peaks, respectively. Based on the XRD results, the average crystallite sizes and relative rutile fractions related to Bi-doped or/and PEG-modified samples are listed in Table I. Apparently, there is a slight decrease in the crystal domain of anatase but a dramatic increase in the anatase content when Bi–Ti proportion increases, whereas PEG was used for further structure modification of BTO-4/600, both crystal domains of anatase and rutile decrease, and the rutile content is reduced from 33% of BTO-4/600 to 8% of 7-PMBTO-4/600 sample. Thus, it is believed that x-PMBTO-4/600 will exhibit smaller crystal sizes and larger surface areas, as revealed by subsequent characterization of TEM and BET technologies.
The effects of PEG or/and Bi amount on the crystallite structure and size of TiO2 calcined at 600 °C.

3. TEM and HRTEM analysis
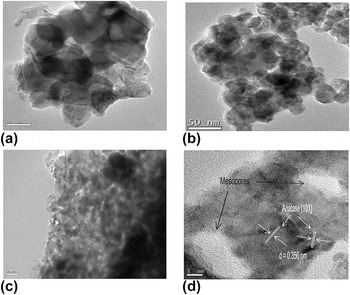
The detailed morphology and microstructure of the pure TiO2, BTO-4, and 5-PMBTO-4 nanoparticles after calcination at 600 °C are clearly demonstrated by TEM and HRTEM images (Fig. 3). Pure TiO2/600 crystallized with irregular big crystallite sizes and resulted in serious aggregation [Fig. 3(a)]. Doping of Bi ions suppressed the crystal growth, leading to decreased mean particle size and improved monodisperse property [Fig. 3(b)]. A representative TEM image of the mesoporous 5-PMBTO-4 is revealed in Fig. 3(c). Apparently, the micrograph indicated that the annealed disordered mesostructured PEG-modified Bi-doped TiO2 was composed of interconnected nanoparticles with the crystallite size range from 15 to 20 nm. These nanocrystalline particles with different sizes are aggregated together, resulting in pore walls with disordered shapes. Generally, the porous structure of pure mesoporous TiO2 was found to be destroyed by calcination at 350–450 °C for template removal. However, in current work the PEG-modified BTO revealed numerous porous structures. Kondo et al.Reference Kondo, Yamashita, Nakajima, Lu, Hara and Domen28 examined and found the addition of tri-, tetra- and penta-valent metals (Al, Zr, and Nb, respectively) to Ti in the oxide as a means of thermally stabilizing the mesoporous structure. Thus, it was suggested that the Bi ions showed similar effect in mesoporous structures. At high resolution [Fig. 3(d)], the crystalline nature and random orientation of the nanoparticles was revealed by the presence of lattice fringes whose distances agree well with that of anatase and was visible throughout the particles. The HRTEM data also pointed to the fact that the average mesopore sizes ranged from 5 to 15 nm, which was consistent well with the following BET measurement.
TEM images of (a) pure TiO2, (b) BTO-4, (c) 5-PMBTO-4 and (d) HRTEM image of 5-PMBTO-4.

4. Nitrogen adsorption
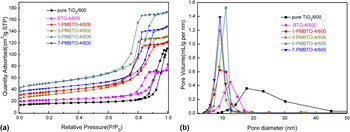
N2 adsorption–desorption isotherms of pure TiO2 nanoparticles, typical doped samples of BTO-4, and a series of PEG modified BTO-4 mesoporous materials calcined at 600 °C are displayed in Fig. 4(a). All of them exhibit type IV isotherms with an IUPAC type H2 hysteresis loop according to the BDDT classification, suggesting the presence of mesopores. However, it is believed that larger pores in the system show hysteresis at higher relative pressure during desorption.Reference Pian, Lin, Chen, Kuang, Zhang and Fu29 For this reason, pure TiO2 and 5-PMBTO-4 will show the largest and smallest pore sizes, respectively. The pore size distribution curves calculated by the Barrett-Joyner-Halenda (BJH) method are presented in Fig. 4(b). These curves revealed that the PMBTO-4 samples have pronounced mesoporosity of narrower pore size distribution with average pore diameters between 5 and 12 nm than that of pure TiO2 and BTO-4, indicating that the modification of PEG was successful and sufficient to introduce mesopores in Bi-doped TiO2 powder. However, excess PEG leads to no further improvement in the mesoporous structure, which might be due to the too thin porewalls that produced by excessive PEG modification in the sol-gel synthetic process collapsed easily upon thermal treatment, subsequently resulting in partial aggregations of crystal grains and an obvious decrease of surface areas. To compare the texture properties of the representative samples directly, the BET surface area, pore size, and pore volume estimated from the nitrogen adsorption and desorption isotherms are summarized in Table I. As listed, the specific surface areas and the total pore volumes of the PEG-modified BTO-4/600 nanocrystalline are drastically increased to that of either pure TiO2 or BTO-4/600. Zhu et al.Reference Zhu, Wang, Wang, Zhang and Li30 prepared 3.3 mol% Bi-compounded TiO2 (Bi2O3/TiO2) through a facile solvothermal process and calcined at 550 °C and measured the S BET of 32 m2/g; although the specific surface area (∼28 m2/g) of BTO-4/600 was approximate to that value, whereas that of 5 wt% PEG-modified BTO-4/600 was determined to be 72 m2/g, much larger that unmodified Bi/TiO2. Such PEG-modification resulted mesoporous architecture, large surface area and narrow mesopore size distribution, therefore, would play an important role in designing catalysts for more practical applications.
(a) N2 adsorption-desorption isotherms and (b) pore size distribution of pure TiO2, BTO-4, and x-PMBTO-4.

5. Optical properties
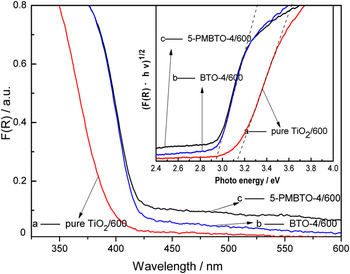
Representative samples of BTO-4/600 and 5-PMBTO-4/600 were selected and studied by UV-vis DRS spectra, pure TiO2 was used for comparison, and the results are depicted in Fig. 5. UV-vis DRS spectra revealed that undoped TiO2 displayed no significant absorbance for visible lights with a sharp absorption edge at about 395 nm, undoubtedly owing to the intrinsic wide energy gap. However, both Bi-doped TiO2 and PEG-modified Bi-doped TiO2 show extended spectral response in the visible region due to the band gap transition. Particularly, the long tail up to about 800 nm in the DRS spectrum for 5-PMBTO-4/600 nanocrystalline was clearly observed. Many researchers suggested that an extended band tailing might be resulted from the carbonaceous species as photosensitizer,Reference Wang, Yapa and Lim31 while others argued that a long tail was probably caused by the lattice defects, such as oxygen vacancies.Reference Lv, Zuo, Sun, Deng, Liu, Li and Wang5 Since it was concluded from TG curves that there was no organic component in as-prepared BTO-y/600, we preferred to believe the latter, and it was inferred that the lattice defects were probably dominantly originated from PEG modification as previously testified by XRD results. The optical band gap energy, E g, could be determined from the absorption spectra by the following equation:
 $$({\rm{\alpha }}hv)^n = k(E - E_{\rm{g}} )\quad,$$
where k is the constant related to the effective masses associated with the valence and conduction bands, E g is the band gap energy, E = hν is the photon energy, and n = 1/2 or n = 2, depending on whether the transition is indirect or direct, respectively. Plotting (αhν)1/2 versus hν based on the spectral response in Fig. 5 provided the extrapolated intercept corresponding to the E g value (inset). On the basis of the plots, the optical band gaps for the BTO-4 and 5-PMBTO-4 are both estimated to be 2.94 eV, which are all lower than that of undoped TiO2 (3.14 eV). This red shift of the optical band gap should be due to the doping effects. This band gap narrowing was suggested to be that the doping with Bi which has an atomic orbital with a potential energy higher than that of O 2p orbital can form a new band with hybridized Bi 6s and O 2p orbitals between the original valence band and the conduction band of TiO2.Reference Wang, Wang, Meng, Ding and Shan32 Thus, a desired band gap narrowing was achieved, and visible light response was gotten.
UV–vis DRS spectra and the optical absorption edges (inset) for pure TiO2, BTO-4 and 5-PMBTO-4.

B. Photocatalytic activity tests
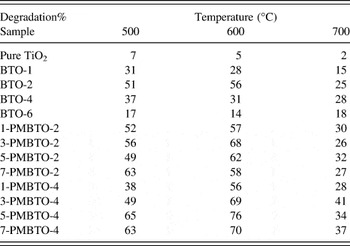
Photocatalytic activity of all the as-prepared photocatalysts was investigated in photocatalytic degradation of 2,4-DCP in aqueous solution under 120 min visible light illumination. In the blank test without any catalysts, the 2,4-DCP photodegradation rate was very low, thus indicating a negligible contribution of the direct 2,4-DCP photolysis to the whole process. Table II summarizes the activities of various catalysts calcined at different temperatures. The pure TiO2 regardless of high or low calcination temperatures was inactive since it could not be activated by visible light due to the big energy band gap (3.14 eV). Doping of TiO2 with Bi-ion resulted in improving photocatalytic activity owing to the bad gap narrowing. However, very high Bi content (Bi/Ti molar ratio > 2.0%) was detrimental for the activity because excess Bi ions appeared to act as an additional charge-carrier recombination center that resulted in reduced photoreactivity. BTO-2/600 revealed the best photocatalytic performance in all Bi-ion doped TiO2 nanoparticles calcined at different temperatures without PEG modification, and this could be, above all, attributed to the optimal Bi-ion doping level and the appropriate mixture of anatase and rutile phases. Kim et al.Reference Kim, Choi, Kim and Lee33 reported that Ni doped TiO2 in the rutile phase had a much higher photocatalytic activity compared to the corresponding anatase phase of Ni-TiO2 for the decomposition of 4-chlorophenol (4-CP) under both UV and visible-light irradiation. Herein, it was believed that the appropriate mixture of anatase and rutile phases would be also responsible for the best photoreactivity of BTO-2/600 for decomposition of 2,4-DCP.
Catalytic properties of typical samples calcined at different temperatures.

On the other hand, it seems contradictory with the above-mentioned Bi-ion doping level that when the Bi content was up to 4 mol%, the PEG-modified Bi-doped TiO2 of 5-PMBTO-4/600 demonstrated better photocatalytic activity than that of unmodified BTO-2/600. To the best of our knowledge, the phenomenon of an extended metal ion loading on TiO2 induced by surfactant modification was found for the first time. The reasonable interpretations for the enhancement could be complicated but several factors were recommended into consideration. (i) The larger specific surface area, which provides more reactant adsorption–desorption sites for catalytic reactions. (ii) The mesoporous structure introduced by PEG modification is also helpful in maintaining the high active surface area, which makes the Bi dopant disperse sufficiently on the near surface of TiO2, possibly improving the optimized doping amount to a higher level. In addition, the mesopores allow rapid diffusion of various reactants and products during the reaction. (iii) The smaller crystal sizes and higher crystallinity, which could shorten the route for an electron migrates from the conduction band of the TiO2 to its surface and are beneficial for the separation of the photogenerated hole and electron pairs. (iv) The appropriate crystal defects, which are also beneficial for the separation of photogenerated charge carriers and caused a long tail up to about 800 nm in the DRS spectrum, would further enhance the visible light adsorption and corresponding photoactivity.
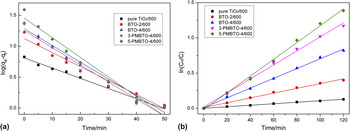
Since the high adsorptive capacity is a prerequisite to the high photocatalytic activity, to understand the relationship between the photocatalytic activity and the adsorptive capacity of as-prepared photocatalysts better, representative samples were conducted to achieve the adsorption–desorption equilibrium in the dark for 50 min prior to visible light illumination in natural pH, pseudo-first-order equation was used to test the experimental data and thus elucidate the adsorption kinetic processReference Bao, Li, Wei, Yin and Niu34 and is expressed as:
 $$\log (q_{\rm{e}} - q_{\rm{t}} ) = \log q_{\rm{e}} - {{k_1 } \over {2.303}}t\quad,$$
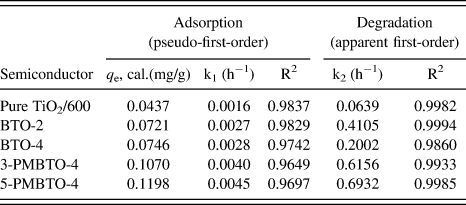
where q t and q e are the amount adsorbed at time t and at equilibrium (mg/g), and k 1 is the pseudo-first-order rate constant for the adsorption process (h−1). The adsorption dynamic profiles are shown in Fig. 6. For degradation reaction kinetics, the reaction kinetic data were well fitted by the apparent first-order rate equation,Reference Sun, Wang, Zhang, Zhou, Yin and Shang35 and the reaction rate constants together with adsorption rate constants are listed in Table III. In the dark, PEG modified BTO photocatalysts displayed different adsorptive capacity to the 2,4-DCP molecules, which was related to their specific surface areas and surface properties. However, it seemed the adsorptive capacity of these samples was dominantly determined by the specific surface area but not directly responsible for the photocatalytic activity in this case, as shown in Table II and III and Fig. 6.
(a) Adsorption and (b) photocatalytic degradation kinetics plots of 2, 4-CP on the surfaces of pure TiO2, BTO-2, BTO-4, 3-PMBTO-4 and 5-PMBTO-4 calcined at 600 °C.

Kinetic parameters for the adsorption and degradation of 2,4-CP on the surfaces of pure TiO2/600, BTO-2/600, BTO-4/600, 3-PMBTO-4/600, and 5-PMBTO-4/600.
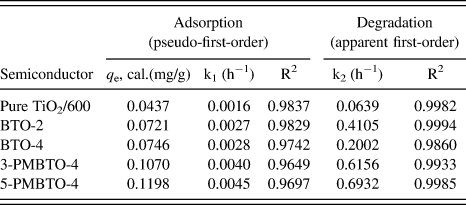
Thus, a conclusion can be drawn from the kinetics studies that the order of photocatalytic activity (rate constants/h−1) was as following: 5-PMBTO-4/600 (0.69) > 3-PMBTO-4/600 (0.61) > BTO-2/600 (0.41) > BTO-4/600 (0.20) > pure TiO2/600 (0.06). The high efficiency of 2,4-CP catalyzed by 5-PMBTO-4/600 should, nevertheless, result from the physicochemical property of themselves as previously discussed and the results illustrate that PEG modification indeed enhanced visible light effective activity to Bi/TiO2.
IV. CONCLUSIONS
In summary, a simple-template strategy, based on a nonionic surfactant (PEG6000) assisted sol-gel process, was demonstrated to be simple for preparation of mesoporous Bi-doped TiO2 with enhanced visible-light-driven photocatalytic performance. The effects of Bi-ion doping and PEG modification on anatase to rutile phase transformation were studied, and the results indicated that PEG6000 could further suppress the phase transformation and lead to production of anatase dominated materials, and this suppressing effect can be tailored by increasing PEG contents in our experimental conditions. Furthermore, the modification of PEG resulted in larger specific surface area, mesoporous architecture, enhanced photoactivity under visible light illumination, and particularly high dispersion of Bi ions on the TiO2 surface. This study establishes linkages among phase transition, mesostructural features, and corresponding photoactivities of Bi-doped TiO2 photocatalysts and is believed to provide relevant information with respect to current research efforts that aim at a rational development of mesoporous TiO2 or other metallic oxide systems with improved efficiencies in catalytic, adsorptive, and photovoltaic fields.
ACKNOWLEDGMENT
The authors would like to gratefully acknowledge the South China Normal University for financing this work.