INTRODUCTION
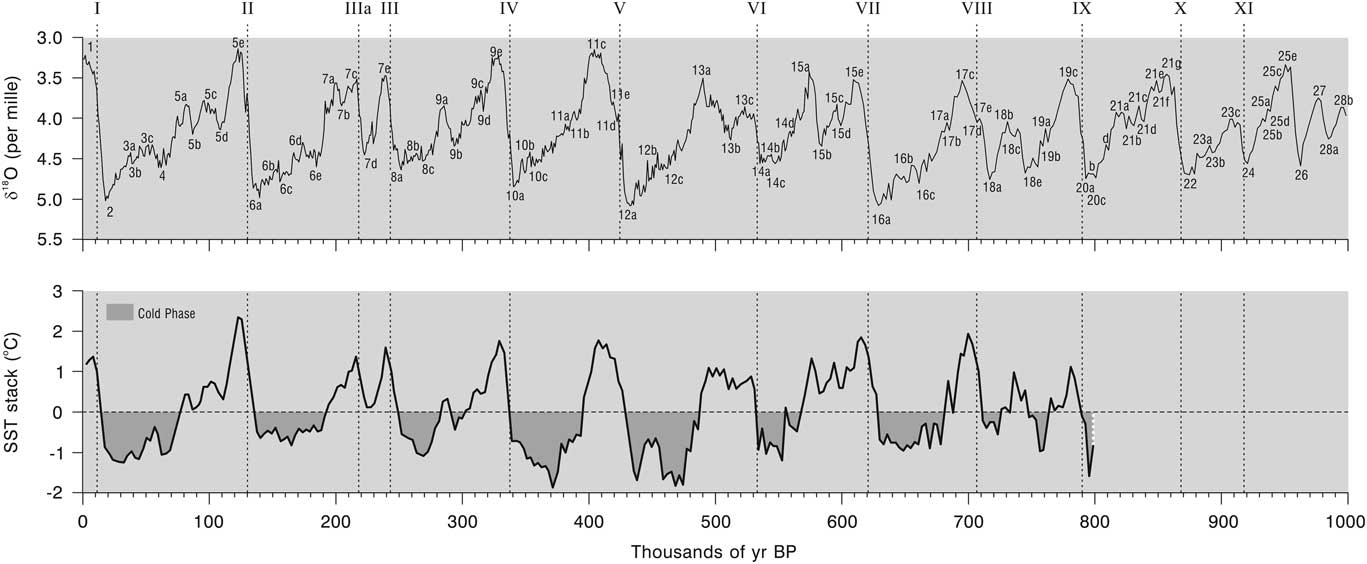
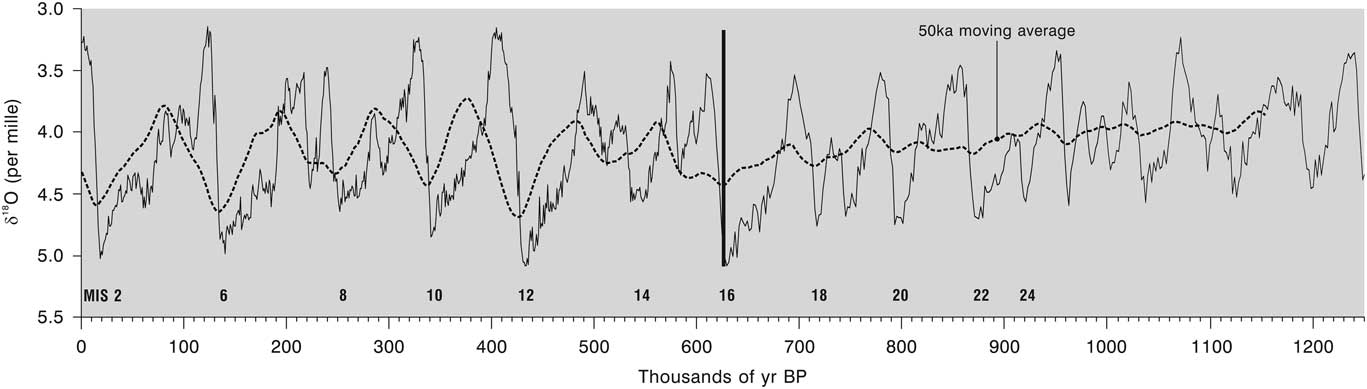
The Quaternary is often subdivided on the basis of fluctuations in climate changes, most recently using the marine oxygen isotope record (Fig. 1), and has been for decades, starting in the 1950s (Arrhenius, Reference Arrhenius1952), with numerous developments since (cf. review in Railsback et al., Reference Railsback, Gibbard, Head, Voarintsoa and Toucanne2015). This is a record of global ice volume and provides the main basis for defining glacial cycles (Lisiecki and Raymo, Reference Lisiecki and Raymo2005). However, it is important to appreciate that this approach is essentially climatostratigraphy and not chronostratigraphy (Gibbard and West, Reference Gibbard and West2000; Gibbard, Reference Gibbard2013), although the Quaternary has been subdivided and defined in chronostratigraphic terms (e.g., Martinson et al., Reference Martinson, Pisias, Hays, Imbrie, Moore and Shackleton1987). The marine isotope record is clearly a valuable global reference for subdividing the Quaternary, and the scheme of stages and substages in the marine isotope record continues to underpin the Quaternary time scale (Lisiecki and Raymo, Reference Lisiecki and Raymo2005; Railsback et al., Reference Railsback, Gibbard, Head, Voarintsoa and Toucanne2015) (Fig. 1). Whilst this paper focuses on the Quaternary glacial cycles, the general principles are also applicable to earlier glacial cycles, such as the mid-Oligocene glacial maximum and the late Pliocene M2 glaciation (3.3 Ma), both of which are also defined with reference to the marine isotope record (Harzhauser et al., Reference Harzhauser, Daxner-Höck, López-Guerrero, Maridet, Oliver, Piller, Richoz, Erbajeva, Neubauer and Göhlich2016; De Schepper et al., Reference De Schepper, Gibbard, Salzmann and Ehlers2014).
Marine oxygen isotope stratigraphy from the Lisiecki and Raymo (Reference Lisiecki and Raymo2005) global stack of 57 sediment cores. The stages are from Lisiecki and Raymo (Reference Lisiecki and Raymo2005), and the substages beyond MIS 5e are from Railsback et al. (Reference Railsback, Gibbard, Head, Voarintsoa and Toucanne2015).Terminations are indicated, and the ages of these are from Raymo (Reference Raymo1997), Lisiecki and Raymo (Reference Lisiecki and Raymo2005), and Cheng et al. (Reference Cheng, Edwards, Broecker, Denton, Kong, Wang, Zhang and Wang2009). The lower graph shows global sea-surface temperature (SST) data from Shakun et al. (Reference Shakun, Lea, Lisiecki and Raymo2015), which are derived from a stack of 49 paired planktonic δ18Op-SST records from the global oceans.

In contrast to the quasi-continuous sedimentary sequences on the deep-ocean floors, the glacier records on land are inherently fragmentary. At the surface, morphostratigraphic preservation of glaciations is directly related to the diminishing size of successive glaciations. In other words, if the most recent glaciation is the largest in extent, then evidence for earlier glaciations will be removed, or at least remoulded or reworked. However, this is not always the case, and it is possible for previous glaciations to be preserved beneath deposits of later glacier advances or in landscape depressions, especially in lowland environments. Nevertheless, even in these situations the glacier record is prone to fragmentation. Despite these challenges, there is direct evidence for glaciations throughout the Quaternary and before (Ehlers and Gibbard, Reference Ehlers and Gibbard2007, Reference Ehlers and Gibbard2008), although clearly the best potential for dating and understanding the spatial and climatic significance of past glaciers originates from the more recent late and middle Pleistocene glaciations. Ehlers et al. (Reference Ehlers, Gibbard and Hughes2011a) found that the succession of glaciations reported from four of the last 10 glacial cycles (Marine Isotope Stage [MIS] 16, 12, 6, and 5d–2) is striking in that it is repeatedly found in many areas of the world, and the absence of records of glaciations during other glacial cycles reflects the fact that these glaciations were less extensive. Even for the late Pleistocene, the glacier records are fragmentary and hindered by the fact that successively diminishing glacier extents are recorded at the land surface. This has been compounded, until recently, by the difficulty in numerically dating glacial sequences. Recent advances in geochronology, especially cosmogenic exposure dating and new luminescence techniques, have now revealed a complex spatial and temporal pattern of glaciation, with many areas seeing maximum glacier advances early in the last glacial cycle, but others seeing maximum advances at or close to the global last glacial maximum (LGM; Hughes et al., Reference Hughes, Gibbard and Ehlers2013).
It is now clear from the last glacial cycle that glacier advances were driven by a complex interplay of air temperatures and precipitation patterns. Glacier advances are controlled by the balance between accumulation and ablation, which is largely, though not entirely, driven by precipitation in the form of snow and summer air temperatures, respectively (Ohmura et al., Reference Ohmura, Kasser and Funk1992; Hughes and Braithwaite, Reference Hughes and Braithwaite2008). This means that glaciers advance depending on the combination of both accumulation and ablation. For example, many glaciers in the mid-latitudes and in the continental interiors did not advance through MIS 2 (= Late Weichselian/Wisconsinan, etc.) and the global LGM but instead suffered retreat. This was because increasing aridity, which occurred as the large continental ice sheets reached their peak size, offset the increasingly colder air temperatures. In some areas glaciers advanced in warmer intervals of the last glacial cycle, such as MIS 3 (= Middle Weichselian/Wisconsinan, etc.), when moisture supply (and therefore winter precipitation) was greater (Hughes et al., Reference Hughes, Woodward, Gibbard, Macklin, Gilmour and Smith2006), whereas in other areas glaciers reached their maximum extent in the major cold and globally dry intervals, such as MIS 4 (= Early Weichselian/Wisconsinan, etc.). Thus, the pattern of global glaciations is not simply reflected by concepts as the LGM. The characteristics of the last glacial cycle were very likely to be the same during earlier glacial cycles (Head and Gibbard, Reference Head and Gibbard2015).
The structure of glacial cycles and changes in their pattern through time has been examined by many authors, including Imbrie et al. (Reference Imbrie, Berger, Boyle, Clemens, Duffy, Howard and Kukla1993), Paillard (Reference Paillard2001), and Lang and Wolff (Reference Lang and Wolff2011). However, discussions of glaciation are usually focused on dynamics of the largest continental ice sheets. In this paper, the focus is on the nature of global glaciation during these glacial cycles and the role glaciers in different parts of the world play in driving and defining global climatic cycles. Apart from a general appreciation of the size and distribution of ice during maximum glacier advances throughout earlier glacial cycles, such as MIS 6, 12, and 16, very little attention has been paid to the spatial and temporal patterns and climatic significance of glaciations that are recorded within these and other glacial cycles.
This paper examines the extent and timing of glaciations during the last 10 glacial cycles between MIS 1 and MIS 25 (the last ~925 ka). This interval is chosen because MIS 22–24 (=Bavelian Stage), was the first of the major global glaciations with substantial ice volumes in both hemispheres that typify the later Pleistocene glaciations (Ehlers and Gibbard, Reference Ehlers and Gibbard2007). The focus is on the pattern of glaciation through glacial cycles recorded in glacier records themselves and also indirectly using evidence from in the polar ice cores and the benthic marine oxygen isotope records. These records of glaciation are then compared with drivers of climate, such as insolation and atmospheric CO2. The aim of this research is to: (1) examine evidence of global patterns of glacier behaviour during multiple glacial cycles and (2) examine how these patterns of glaciation can be explained by variations in solar radiation, atmospheric CO2, global sea-surface temperatures (SSTs), and other driving factors, including glaciers themselves.
METHODOLOGY AND APPROACH
The data include the direct evidence of glaciation in the geological and geomorphological record, coupled with analysis of the structure of glacial cycles recorded in ice cores and marine sediments. Patterns of glaciation and climate change indicated in these records are then compared to solar variations through glacial cycles. The results are then used to inform discussion on the problems and prospects for the fine-scale stratigraphic division of cold stages. The term “cold stage” refers to climatostratigraphic/chronostratigraphic units such as the Weichselian or Wisconsinan in Europe or North America, respectively. Climatic subdivisions have been used interchangeably with chronostratigraphic stages by the majority of workers (Gibbard, Reference Gibbard2013). The last cold stage (Weichselian, Wisconsinan, or equivalents) is correlative to MIS 5d–2 in the ocean-floor marine isotope stratigraphy. For some earlier glacial intervals, terrestrial chronostratigraphic units may not always be formally defined, and there are pitfalls associated with direct terrestrial–marine correlation (Gibbard and West, Reference Gibbard and West2000). Nevertheless, in recent years it has become common practice to directly correlate terrestrial sequences with those in the oceans (Gibbard, Reference Gibbard2013). A global chronostratigraphic table for the whole Quaternary is provided in Cohen and Gibbard (Reference Cohen and Gibbard2011) and also in the Subcommission on Quaternary Stratigraphy (2017).
Glacier records
Evidence of glaciation in the geological and geomorphological records is well documented. Reviews of global glaciations have been published in the edited volumes of Denton and Hughes (Reference Denton and Hughes1981), Ehlers et al. (Reference Ehlers, Gibbard and Hughes2011b), and Ehlers and Gibbard (Reference Ehlers and Gibbard2004) and also in review papers by Ehlers and Gibbard (Reference Ehlers and Gibbard2007, Reference Ehlers and Gibbard2008). The last cold stage (MIS 5d–2; Weichselian, Wisconsinan) is the best studied owing to the often excellent preservation and strong geochronological control. A review of global glaciations during the last cold stage is provided in Hughes et al. (Reference Hughes, Gibbard and Ehlers2013).
Ice-core data
Ice-core records provide information on the state of the atmosphere through time. The Greenland ice-core records span the last glacial cycle, whilst the Antarctic ice-core records span the last eight glacial cycles. The former have been used extensively to provide an event stratigraphy for the last glacial cycle (Lowe et al., Reference Lowe, Rasmussen, Björck, Hoek, Steffensen, Walker and Yu2008; Blockley et al., Reference Blockley, Lane, Hardiman, Rasmussen, Seierstad, Turney and Bronk Ramsey2012; Hughes and Gibbard, Reference Hughes and Gibbard2015). For earlier glacial cycles we must rely on the records from Antarctica. The deuterium-derived temperature plot from Antarctica provides a record of global climate fluctuations (European Project for Ice Coring in Antarctica [EPICA], 2006). However, ice-core records of climate from Greenland and Antarctica show asynchronous temperature variations on millennial time scales during the last cold stage (Blunier et al., Reference Blunier, Chappellaz, Schwander, Dällenbach, Stauffer, Stocker and Raynaud1998; EPICA, 2006; Jouzel et al., Reference Jouzel, Masson-Delmotte, Cattani, Dreyfus, Falourd, Hoffmann and Minster2007a; Stenni et al., Reference Stenni, Buiron, Frezzoti, Albani, Barbante, Bard and Barnola2011). Dust concentrations in polar ice cores can provide insight into the state of the atmosphere through time. In Antarctica, dust recorded in ice cores is derived from South America during glacial periods and Australia during interglacial periods (Lambert et al., Reference Lambert, Bigler, Steffensen, Hutterli and Fischer2012). Dust flux over Antarctica has a close correlation with temperature as climate becomes colder (Lambert et al., Reference Lambert, Delmonte, Petit, Bigler, Kaufmann, Hutterli, Stockler, Ruth, Steffensen and Maggi2008). This means that during glacial periods, dust acts as a proxy for temperatures over Antarctica. Whilst dust in Antarctic ice cores has a southern hemispheric source, the dramatic increase in dust flux in glaciations (×25) is enabled by a globally reduced hydrological cycle (Lambert et al., Reference Lambert, Delmonte, Petit, Bigler, Kaufmann, Hutterli, Stockler, Ruth, Steffensen and Maggi2008). Comparison of Antarctic ice-core dust records with the magnetic susceptibility record of loess/palaeosol sequences from the Chinese Loess Plateau (Kukla et al., Reference Kukla, An, Melice, Gavin and Xiao1994) confirms the synchronicity of global changes in atmospheric dust load (Lambert et al., Reference Lambert, Delmonte, Petit, Bigler, Kaufmann, Hutterli, Stockler, Ruth, Steffensen and Maggi2008). In addition to temperature and dust records, ice-core data were utilised for analysing CO2 through glacial cycles. Ganopolski et al. (Reference Ganopolski, Winkelmann and Schellnhuber2016) showed that CO2 in conjunction with solar radiation input to high northern latitudes is an important control on glacial inception.
Marine isotope data
The marine oxygen isotope record currently provides the main basis for defining and subdividing the full span of the Quaternary at the global scale (e.g., Imbrie et al., Reference Imbrie, Hays, Martinson, McIntyre, Mix, Morley, Pisias, Prell and Shackleton1984; Martinson et al., Reference Martinson, Pisias, Hays, Imbrie, Moore and Shackleton1987; Lisiecki and Raymo, Reference Lisiecki and Raymo2005; Railsback et al., Reference Railsback, Gibbard, Head, Voarintsoa and Toucanne2015). Marine oxygen isotopes have been established as a proxy for global ice volume since the 1960s (e.g., Shackleton, Reference Shackleton1967), although the isotopic record is also known to be affected by deep-water ocean temperature (Shackleton, Reference Shackleton2000). Orbital forcing has long been identified as the driver of cyclic fluctuations in marine oxygen isotopes (Hays et al., Reference Hays, Imbrie and Shackleton1976), and the frequency of orbital variations has underpinned the time frame to which the marine isotope record is tuned (Imbrie et al., Reference Imbrie, Hays, Martinson, McIntyre, Mix, Morley, Pisias, Prell and Shackleton1984, Ruddiman et al., Reference Ruddiman, Raymo, Martinson, Clement and Backman1989; Lisiecki and Raymo, Reference Lisiecki and Raymo2005). The LR04 benthic stack is based on 57 globally distributed benthic δ18O records. (Lisiecki and Raymo, Reference Lisiecki and Raymo2005) and is a record of both global ice volume and deep-ocean temperature. For assessing the severity of glacial cycles in terms of ice volume using marine isotope data, both the maximum and the top 5% percentile δ18O values from the Lisiecki and Raymo (Reference Lisiecki and Raymo2005) stack were considered (Table 1). The latter is likely to be more representative, since δ18O values in the Lisiecki and Raymo (Reference Lisiecki and Raymo2005) stack are an orbitally tuned average of 57 cores, with leads and lags of up to 5 ka known (up to 5% of 100 ka cycles) between oxygen isotope records from different ocean basins (Skinner and Shackleton, Reference Skinner and Shackleton2005). These leads and lags are associated with deep-ocean circulation and variations in ocean temperatures that also affect the marine oxygen isotope record (Labeyrie et al., Reference Labeyrie, Duplessy and Blanc1987; Shackleton, Reference Shackleton2000; Waelbroeck et al., Reference Waelbroeck, Labeyrie, Michel, Duplessy, McManus, Lambeck, Balbon and Labracherie2002; Elderfield et al., Reference Elderfield, Ferretti, Greaves, Crowhurst, McCave, Hodell and Piotrowski2012).
The definitions of the last 10 full glacial cycles based on the marine isotope stratigraphy: (1) the boundaries of the glacial cycles are defined by termination ages provided in Raymo (Reference Raymo1997), Lisiecki and Raymo (Reference Lisiecki and Raymo2005), and Cheng et al. (Reference Cheng, Edwards, Broecker, Denton, Kong, Wang, Zhang and Wang2009); (2) cold “phases” are defined as periods when the global sea-surface temperatures (derived from global marine oxygen isotope records) were ≤0°C (Shakun et al., Reference Shakun, Lea, Lisiecki and Raymo2015); (3) the numbering and span of the cold stages/substage intervals are based on Lisiecki and Raymo (Reference Lisiecki and Raymo2005) and Railsback et al. (Reference Railsback, Gibbard, Head, Voarintsoa and Toucanne2015). Detrended global sea-level values were obtained from Shakun et al. (Reference Shakun, Lea, Lisiecki and Raymo2015). Percentiles (top 5% for δ18O and bottom 25% for sea levels) are based on the glacial marine isotope stage/substage subdivisions (definition 3 in this table).

a From Walker et al., Reference Walker, Johnsen, Rasmussen, Popp, Steffensen, Gibbard and Hoek2009.
Shakun et al. (Reference Shakun, Lea, Lisiecki and Raymo2015) exploited the temperature component of the oxygen isotope record to extract SSTs from planktonic δ18O records from 49 cores around the globe. This enables insights into global shifts in both climate and ice volume during glacial cycles: one using the benthic stack of Lisiecki and Raymo (Reference Lisiecki and Raymo2005) and the other using the global SST stack of Shakun et al. (Reference Shakun, Lea, Lisiecki and Raymo2015). Whilst it is possible to extract and model arbitrary measures of ice volume from δ18O data (fig. 7d in Shakun et al., Reference Shakun, Lea, Lisiecki and Raymo2015), this requires assumptions on orbital forcing when it is known that other internal climate forcings are at play, such as land–ocean interactions including glacier distributions in themselves (this paper) and global SSTs (Shakun et al., Reference Shakun, Lea, Lisiecki and Raymo2015, p. 66). However, Shakun et al. (Reference Shakun, Lea, Lisiecki and Raymo2015) were able provide a first attempt to correct the δ18O stack for non–ice volume effects, thus enabling the δ18O stack to be used as a direct proxy for global ice volume. Whilst these detrended sea-level data represent an indirect proxy, they are used here as the best estimate of shifts in global ice volume.
In addition, using the global SST data presented in Shakun et al. (Reference Shakun, Lea, Lisiecki and Raymo2015), it is possible to identify sustained global cold “phases” within glacial cycles in addition to the ice volume signal. Sustained cold phases are defined here as intervals when global SST is ≤0°C for at least 20 ka, with interruptions of no more than 10 ka (see Fig. 1, bottom graph; SST curve from Shakun et al., Reference Shakun, Lea, Lisiecki and Raymo2015).
Solar radiation
Solar radiation variations at 60°N were used as a proxy for summer ablation potential at both high and mid-latitudes. Apart from Antarctica, the Southern Hemisphere is not significant for glacier build-up in the mid-latitudes at a global scale, because the land masses are very small in comparison with the Northern Hemisphere. Solar radiation data are derived from Berger and Loutre (Reference Berger and Loutre1991) and Berger (Reference Berger1992).
GLACIAL CYCLES: DEFINITIONS AND SUBDIVISION
Glacial cycles are major climatic oscillations that can be defined using the marine isotope record and their shape and frequency can be determined using various criteria (e.g., Fairbridge, Reference Fairbridge1972; Raymo, 2007). However, the definition of the span of glacial cycles was discussed by Fairbridge (Reference Fairbridge1972, p. 286), who noted that “there is no logical mathematical solution, and the International Stratigraphic Commission rightly ignores any such theoretical proposals.” This remains the case today, and the concept of the glacial cycle defined in the marine isotope record has no stratigraphic basis; instead, cold periods within glacial cycles are defined by chronostratigraphic cold stages such as the Weichselian or Wisconsinan for the last glacial cycle in Europe and North America, respectively. Nevertheless, the marine isotope record is a useful tool for assessing global climatic shifts, and glacial cycles can be defined as the interval between glacial terminations encompassing both the preceding interglacial period and the following cold stages (Broecker and van Donk, Reference Broecker and van Donk1970; Fairbridge, Reference Fairbridge1972). The ages of the last seven major terminations are listed in Raymo (Reference Raymo1997) and Lisiecki and Raymo (Reference Lisiecki and Raymo2005, their table 3), with an additional age for termination IIIa defined in Cheng et al. (Reference Cheng, Edwards, Broecker, Denton, Kong, Wang, Zhang and Wang2009). The ages of terminations before termination VII can be obtained from Railsback et al. (Reference Railsback, Gibbard, Head, Voarintsoa and Toucanne2015, their fig. 3 and references therein). Following this approach, the last glacial cycle is defined as the period between termination II and termination I encompassing both the last interglacial period (= Eemian Stage and equivalents) and also the last cold stage (= Weichselian Stage and equivalents).
Three approaches were used for describing glacial cycles:
1. the periods between glacial terminations (this defines the glacial cycle);
2. the periods of cold phases defined by global SSTs within glacial cycles (cf. Shakun et al., Reference Shakun, Lea, Lisiecki and Raymo2015); and
3. the span of traditional subdivision of cold stages based on marine isotope stages and substages (Railsback et al., Reference Railsback, Gibbard, Head, Voarintsoa and Toucanne2015).
Termination positions and global SSTs are shown in Figure 1 with reference to the marine isotope stages and substages (cf. Railsback et al., Reference Railsback, Gibbard, Head, Voarintsoa and Toucanne2015; Shakun et al., Reference Shakun, Lea, Lisiecki and Raymo2015). The use of terminations to define the boundaries of glacial cycles works effectively for most glacial periods. Terminations have been associated with ice sheet instability and collapse at the end of glacial cycles (MacAyeal, Reference MacAyeal1993), thus indicating a glacier-forcing mechanism for limiting the length of glacial cycles. However, other factors have also been suggested, including increases in greenhouse gases such as CH4 and CO2 (Capron et al., Reference Capron, Vázquez Riveiros, He, Jacobel and Zhang2016), although determining cause and effect is difficult given the interrelationships involved. Whatever their cause, there is no disputing the importance of terminations in controlling global ice volume, and thus they represent an apt marker for defining many, though not all, glacial cycles. The only exception is for MIS 24–22, and this stems from debate regarding MIS 23 and its classification as an interstadial or interglacial period (see “MIS 23–22 (termination XI to X) or 25–22 (termination XII to X)”).
PATTERNS OF GLACIATION DURING GLACIAL CYCLES
When defined from termination to termination, glacial cycles varied considerably in duration during the past million years. The two longest glacial cycles by this definition encompassed the glacial intervals of MIS 5d–2 and MIS 12 (118 and 109 ka, respectively). All other glacial cycles were bounded by terminations 76 to 95 ka apart. Significantly, the last full five glacial cycles were all longer than the preceding five. Cold phases within the last five glacial cycles were remarkably similar in length (51–57 ka; mean=54.6±2.6 ka SD) (Table 1). However, the glacial cycles incorporating MIS 14, 16, 18, and 20 were largely characterised by short cold phase lengths (33, 51, 21, and 15 ka) (there are no global SST data for MIS 22–24 in Shakun et al., Reference Shakun, Lea, Lisiecki and Raymo2015). Only MIS 16 had a cold phase length similar to the last five cycles. The cold stages with the greatest maximum δ18O value of all of the last 10 glacial cycles (and the entire Quaternary) were MIS 16 and 12 (both 5.08 per mille), followed by MIS 5d–2 (5.02 per mille). The cold stage with the lowest maximum δ18O value was MIS 14 (4.55 per mille). However, when global SSTs are decoupled from the marine isotope record, then the most severe glacial intervals are MIS 12 and 10, whereas MIS 14 and 16 appear to have been of similar severity (Fig. 1). The final approach for describing glacial cycles, using marine isotope stage and substage lengths, provides another perspective. This approach identifies MIS 5d–2 as the longest interval (103 ka), whereas MIS 12 is almost half this length (58 ka) despite the latter being defined as a long glacial cycle when defined using terminations. These contradictions are not simply the artefacts of stage/termination boundary definitions but must also have some physical basis. For example, stage/substage boundaries closely correspond with glacial inceptions defined using solar/CO2 models (Ganopolski et al., Reference Ganopolski, Winkelmann and Schellnhuber2016), whilst terminations have a clear physical basis in ice-sheet dynamics. The contradictions apparent in the various definitions of glacial cycles stem from the complexity of the global climate signal that is recorded in different environmental systems.
Understanding the record of changes to the global cryosphere requires a closer look at the evidence for glaciation and associated proxy evidence during the different glacial cycles. This is done in the following sections for each of the last 10 glacial cycles. In this analysis we use marine isotope stratigraphy to identify time intervals within glacial cycles in conjunction with continental European chronostratigraphic terminology (and other terminologies) to describe terrestrially defined cold stages.
MIS 5e–2 (terminations II to I)
The span of the last cold glacial cycle (termination II to I) is the longest of all the glacial cycles at 118 ka. The end of the last interglacial period (MIS 5e) is placed at ca. 115 ka in the marine isotope record, based on a substantial cooling effect at this time (Shackleton et al., Reference Shackleton, Chapman, Sánchez-Goñi, Pailler and Lancelot2002, Reference Shackleton, Sánchez-Goñi, Pailler and Lancelot2003).
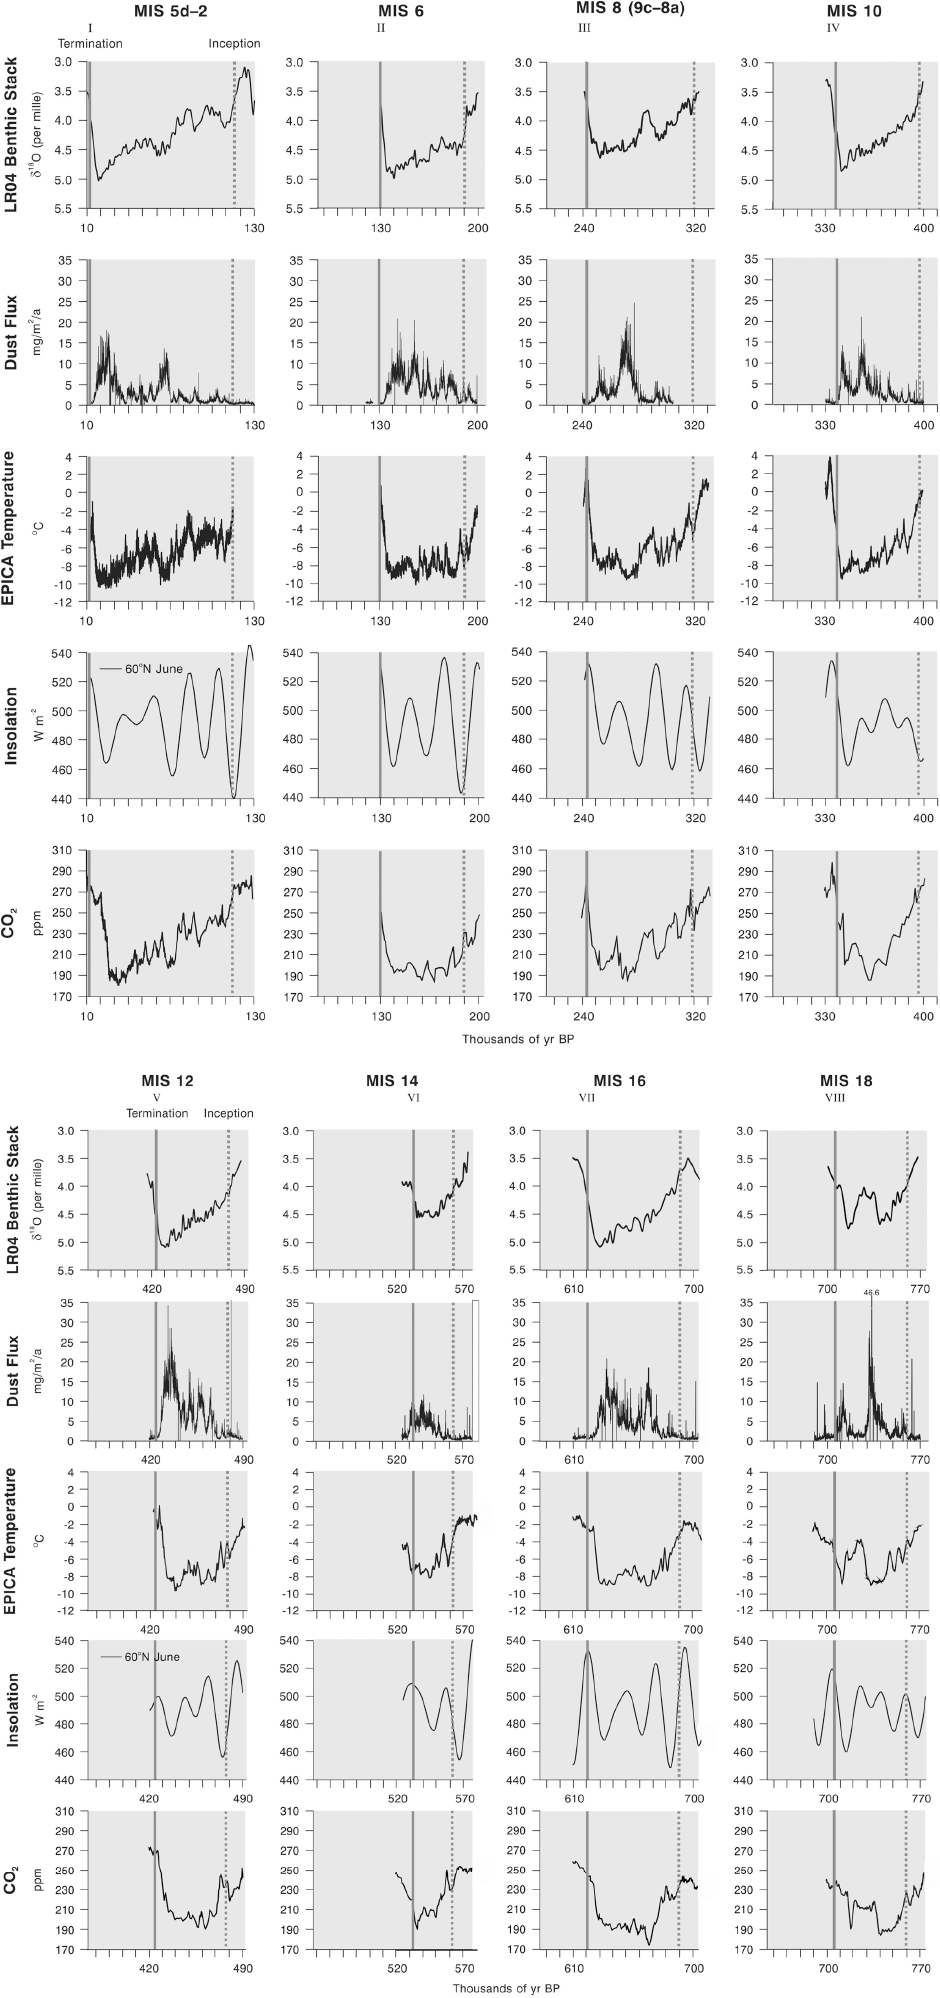
The last cold stage (Weichselian Stage) has two distinct and pronounced cold episodes during MIS 4 and 2. The paired cold-stage phenomenon of MIS 4 and 2 is also highlighted in dust and temperature records from Antarctica (Fig. 2). The dust flux peaks in the Antarctic ice cores for MIS 4 and 2 are 13.7 and 18.2 mg/m2/a, respectively. The estimated temperature difference over Antarctica (compared to the average of the past 1 ka) reached minima of −10.2°C and −10.6°C, for MIS 4 and 2, respectively (Fig. 2).
The last 8 glacial cycles (MIS 5d–2 to MIS 18) showing data over these periods from (i) the benthic δ18O stack of Lisiecki and Raymo (Reference Lisiecki and Raymo2005), (ii) dust flux from the EPICA Dome C ice-core record (Lambert et al., Reference Lambert, Bigler, Steffensen, Hutterli and Fischer2012), and (iii) temperature curves derived from the EPICA Dome C ice-core deuterium record (Jouzel et al., Reference Jouzel, Stievenard, Johnsen, Landais, Masson-Delmotte, Sveinbjornsdottir, Vimeux, von Grafenstein and White2007b, Reference Jouzel, Masson-Delmotte, Cattani, Dreyfus, Falourd, Hoffmann and Minster2007c). The temperature estimate in this curve is the estimated temperature difference over Antarctica compared with the average of the past 1 ka, (iv) insolation at 60°N from Berger and Loutre (Reference Berger and Loutre1991) and Berger (Reference Berger1992), (v) CO2 data are from the Antarctic ice cores revised 800 ka CO2 data (Bereiter et al., Reference Bereiter, Eggleston, Schmitt, Nehrbass-Ahles, Stocker, Fischer, Kipfstuhl and Chappellaz2015; National Oceanic and Atmospheric Administration, 2018).

MIS 4 and 2 are separated by the warm interval of MIS 3, which is not considered a true interglacial period, but an interstadial complex with climate oscillating on a 100–1000 yr time scale between near-interglacial and peak-glacial conditions (van Andel, Reference Van Andel2002). This high-amplitude millennial-scale climatic instability is evident in both Greenland and Antarctic ice-core records (Blunier et al., Reference Blunier, Chappellaz, Schwander, Dällenbach, Stauffer, Stocker and Raynaud1998; Markle et al., Reference Markle, Steig, Buizert, Schoenemann, Bitz, Fudge and Redro2017).
The terrestrial glacial record for the last glacial cycle is reviewed in detail in Hughes et al. (Reference Hughes, Gibbard and Ehlers2013), who noted the asynchronous record of glaciation around the world. In particular, many glaciers advanced early in the glacial cycle, especially in Asia (Svendsen et al., Reference Svendsen, Alexanderson, Astakhov, Demidov, Dowdeswell, Funder and Gataullin2004; Larsen et al., Reference Larsen, Kjær, Demidov, Funder, Grøsfjeld, Houmark-Nielsen, Jensen, Linge and Lyså2006; Vorren et al., Reference Vorren, Landvik, Andreassen and Laberg2011; Astakhov, Reference Astakhov2018) and mid-latitude mountains, with the latter phenomenon highlighted in a seminal paper by Gillespie and Molnar (Reference Gillespie and Molnar1995). Even in Antarctica, there is evidence that the ice sheets were thicker before the global LGM, and the ice in the centre of the East Antarctic Ice Sheet was no thicker at the LGM than it is today (Lilly et al., Reference Lilly, Fink, Fabel and Lambeck2010). Also, in the southern parts of the McMurdo Dry Valleys area of the Transantarctic Mountains, terminal moraines associated with the local LGM with a mean age of 36±8 ka are at most only 100 m from the current ice margin (Joy et al., Reference Joy, Fink, Storey, De Pascale, Quigley and Fujioka2017).
MIS 7–6 (terminations III to II)
Some marine δ18O records suggest that global ice volume was greater in MIS 6 (Saalian Stage) than in MIS 2 (Shackleton, Reference Shackleton1987; Roucoux et al., Reference Roucoux, Tzedakis, Lawson and Margari2011). This is supported by the lower quartile value of global sea levels indicated in the data calculated by Shakun et al. (Reference Shakun, Lea, Lisiecki and Raymo2015). However, in the Lisiecki and Raymo (Reference Lisiecki and Raymo2005) stack of 57 records, MIS 2 has a slightly higher δ18O than MIS 6, although the ice volume signal may be masked by temperature effects, since global SSTs were warmer in MIS 6 than during MIS 5d–2 (Fig. 1). Warmer global SSTs during MIS 6 may have allowed greater moisture supply to drive some ice masses to larger extents than in other colder glacial periods. Also, the distributions of global ice were different at the penultimate glacial maximum (PGM) compared with the LGM, with much larger ice masses over Eurasia in the PGM compared with the LGM, and smaller ice masses over North America at the PGM compared with the LGM (Rohling et al., Reference Rohling, Hibbert, Williams, Grant, Marino, Foster and Hennekam2017). The peak of the PGM occurred at ca. 140 ka (Stirling et al., Reference Stirling, Esat, Lambeck and McCulloch1998; Railsback et al., Reference Railsback, Xiao, Liang, Akers, Brook, Dennis, Lanier, Tan, Cheng and Edwards2014; Colleoni et al., Reference Colleoni, Wekerle, Näslund, Brandefelt and Masina2016).
The amplitude of precessional-scale solar variability at 60°N was large for MIS 6, larger than for MIS 5d–2, and many of the last 10 glacial cycles (Fig. 2). This resulted in major peaks in summer insolation in the middle of the glacial cycle. The middle of MIS 6 (MIS 6e, 166–178 ka) is characterised by a humid period in speleothem records from Israel (Ayalon et al., Reference Ayalon, Bar-Matthews and Kaufman2002), southern Tuscany (Bard et al., Reference Bard, Delaygue, Rostek, Antonioli, Silenzi and Schrag2002), and the Apuan Alps (Regattieri et al., Reference Regattieri, Zanchetta, Drysdale, Isola, Hellstrom and Roncioni2014). However, despite corresponding to a major peak in insolation, this interval was also relatively cool in Europe and the Mediterranean region, with few temperate trees compared to the analogous situation of MIS 3 in the last glacial cycle (Roucoux et al., Reference Roucoux, Tzedakis, Lawson and Margari2011). Climate in this interval does exhibit large-amplitude millennial-scale variability like MIS 3, but unlike the last glacial cycle, there is no evidence of major ice rafting, nor Heinrich events, from MIS 6 (McManus et al., Reference McManus, Oppo and Cullen1999; Margari et al., Reference Margari, Skinner, Tzedakis, Ganopolski, Vautravers and Shackleton2010). This suggests a different configuration of ice around the North Atlantic compared with the last glacial cycle.
The lack of trees in mid-latitude Europe during MIS 6e, compared to the analogous situation in MIS 3, is also matched by the most prolonged savannah phase of the last 540 ka at Lake Botsumtwi in Ghana, West Africa. The global dust signal recorded in the Antarctic ice cores is also more sustained through MIS 6 than during MIS 5d–2, with a pronounced dust peak in MIS 6e (Fig. 2). This hints at a significant global hydrological perturbation in this interval associated with a major build-up of ice volume, although the evidence of humidity in the Mediterranean region at this time highlights the complex response of the climate system to such events.
The glacial maximum of MIS 6 was the most extensive glaciation of the last 400 ka over Eurasia, the biggest since MIS 12 (Colleoni et al., Reference Colleoni, Wekerle, Näslund, Brandefelt and Masina2016). In Europe, MIS 6 is recorded by the largest ice advance of the Saalian Stage, during the Drenthe Stadial. This was several hundred kilometres beyond the later Weichselian Stage (MIS 5d–2) limits in the Netherlands and northern Germany (Ehlers et al., Reference Ehlers, Grube, Stephan and Wansa2011c; Laban and van der Meer, Reference Laban and van der Meer2011) and more than 100 km beyond in eastern Germany and Poland (Ehlers et al., Reference Ehlers, Grube, Stephan and Wansa2011c; Marks, Reference Marks2011). The ice also extended further southeast and east than the Weichselian Stage ice sheet in Russia and neighbouring states (Astakhov, Reference Astakhov2004); overall it was 56% larger in volume. The maximum glacier limits of the Saalian Stage in northern Europe were also more extensive than the earlier Elsterian Stage glaciation (MIS 12), and thus the Saalian Stage constitutes the most extensive glaciation recorded in a large part of northern continental Europe.
Compared to the LGM, the maximum extent of the MIS 6 glaciation in Eurasia was characterised by an overall considerably more extensive ice sheet. During the late Saalian Drenthe Stadial (early MIS 6) in Europe, the Fennoscandian Ice Sheet reached its maximum extent in the central Netherlands, Germany, Britain, and the Russian Plain. This was followed by ice-sheet melting under increasing summer insolation and sea-level rise at ca. 157 ka, the most extreme conditions occurring at ca. 157–154 ka (Margari et al., Reference Margari, Skinner, Tzedakis, Ganopolski, Vautravers and Shackleton2010; Reference Margari, Skinner, Hodell, Martrat, Toucanne, Grimalt, Gibbard, Lunkka and Tzedakis2014). After ca. 150 ka, eustatic sea-level records and glacial geological evidence suggest that ice sheets readvanced, with global ice volume reaching its maximum extent towards the end of MIS 6, reflecting the maximum growth of the Illinoian ice sheet in North America (e.g., Curry et al., Reference Curry, Grimly and McKay2011; Syverson and Colgan, Reference Syverson and Colgan2011). In Europe, the Warthe Stadial I and II ice advances were markedly less extensive than during the previous Drenthe (Ehlers et al., Reference Ehlers, Grube, Stephan and Wansa2011c), but that may have been compensated for by ice expansion in Russia and Siberia (e.g., Astakhov, Reference Astakhov2004; Astakhov et al., Reference Astakhov, Shkatova, Zastrozhnov and Chuyko2016).
In England the Saalian Stage-equivalent, the Wolstonian Stage glaciation, is represented by a large ice lobe that reached the Fenland basin in eastern England, and Midland England. This has again been correlated with MIS 6 (Gibbard et al., Reference Gibbard, West, Boreham and Rolfe2011; Reference Gibbard, West and Hughes2018) and represents the second-largest recorded glaciation in eastern Britain, smaller than the earlier Anglian Stage glaciation (MIS 12) and larger than the later Devensian Stage glaciation (MIS 5d–2).
The largest ice masses of Eurasia in the equivalent of the Saalian Stage were present over Russia. However, unlike in Europe, the MIS 6 glaciation equivalent in Siberia was less extensive than during the earlier MIS 8 (Samarovo glaciation)—see below [MIS 9–8 (termination IV to III)] and Fig. 3.
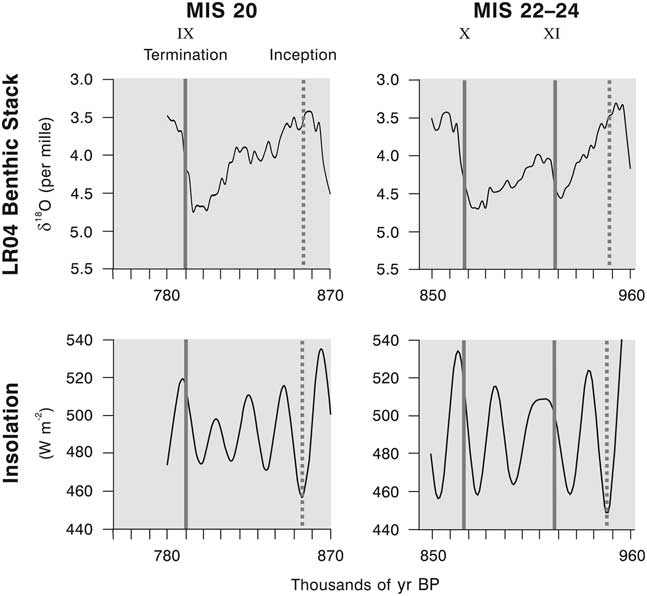
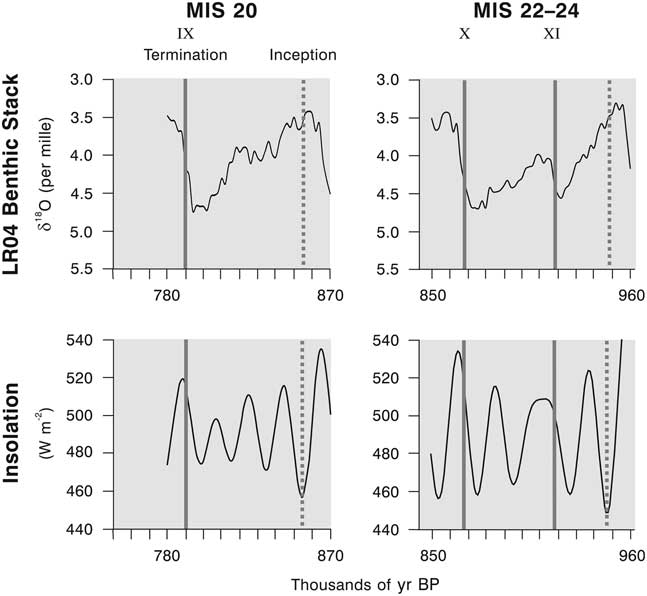
Benthic marine δ18O isotope record (from Lisiecki and Raymo, 2005) and solar radiation at 60°N and 30°N [full and dashed lines, respectively; from Berger and Loutre (Reference Berger and Loutre1991) and Berger (Reference Berger1992)] for MIS 20 and 22–24. These intervals are beyond the ice-core data records used in Fig. 2 and are therefore shown separately.
In North America the Illinoian glaciation is equivalent to MIS 6. Here, the southern margin of the Laurentide Ice Sheet extended 150 km beyond the later Wisconsinan (MIS 5d–2) limits in Illinois (Curry et al., Reference Curry, Grimly and McKay2011) at a peak of 140 ka (Colleoni et al., Reference Colleoni, Wekerle, Näslund, Brandefelt and Masina2016). In Wisconsin the Illinoian Stage glacial limits were only a maximum of 30 km beyond Wisconsinan limits, and in some places the latter was more extensive (Syverson and Colgan, Reference Syverson and Colgan2011).
In the high mountains of central Asia, the penultimate glaciation (MIS 6) was more extensive than the last cold stage in several areas (Owen and Dortch, Reference Owen and Dortch2014). This has been revealed by 10Be exposure age dating from the Pamirs (Seong et al., Reference Seong, Owen, Yi, Finkel and Schoenbohm2009; Owen et al., Reference Owen, Chen, Hedrick, Caffee, Robinson, Schoenbohm, Yuan, Imrecke and Liu2012) and the Karakoram (Seong et al., Reference Seong, Owen, Bishop, Bush, Clendon, Copland, Finkel, Kamp and Shroder2007).
MIS 9–8 (terminations IV to III)
This cold stage incorporates MIS 9c to MIS 8a. The structure of this glacial cycle is marked by a strong interstadial (MIS 9a) separating two glacial troughs (MIS 8a–c and 9b). MIS 8a represents the most severe part of the glacial cycle in terms of ice volume and lowest global sea levels (Lisiecki and Raymo, Reference Lisiecki and Raymo2005; Shakun et al., Reference Shakun, Lea, Lisiecki and Raymo2015). Overall, this was a relatively weak glacial cycle, second only to MIS 14 in terms of maximum δ18O values for the last 10 glacial cycles and the weakest in terms of the uppermost 5% percentile (Table 1).
As with MIS 10 (discussed in the following section), the dust peak in Antarctica does not coincide with the glacial maximum of MIS 8 recorded in the marine isotope curve. Instead, it occurs earlier, at ca. 272 ka, with a smaller peak at 252 ka coinciding with the isotopic glacial maximum. The first dust peak also coincides with the lowest CO2 levels and the coldest global SSTs of this glacial period (Figs. 2 and 1, respectively). A very large, isolated, single-layer dust peak at 277 ka may be related to an extraterrestrial impact event, as has been shown for MIS 12 (Misawa et al., Reference Misawa, Kohno, Tomiyama, Noguchi, Nakamura, Nagao, Mikouchi and Nishiizumi2010), although further research is needed to prove this.
The nature of environmental changes on land during this glacial cycle has been revealed by high-resolution pollen analysis from Tenaghi Philippon in Greece (Fletcher et al., Reference Fletcher, Müller, Koutsodendris, Christanis and Pross2013). Forest expansion events occurred during the early glacial period (equivalent to MIS 9c–a) and during mid- to late MIS 8, but are absent from the early part of MIS 8. This lack of trees in Greece early in MIS 8 corresponds with the largest dust peak in Antarctica at ca. 272 ka. Both are indicators of aridity.
The evidence for glaciation on land is sparse for this glacial cycle. However, there is evidence in eastern Russia that the Samarovo glaciation dates from MIS 8. In the western Siberian Plain and also the Central Siberian Plateau the Samarovo glaciation was consistently much more extensive than the later Taz glaciation, which is thought to date from later in the Saalian Stage in MIS 6 (Astakhov et al., Reference Astakhov, Shkatova, Zastrozhnov and Chuyko2016). Given the scale of the land areas involved, these Siberian ice masses would have been major contributors to global ice volume.
In northwest Europe, the evidence for the MIS 8 glaciation is limited. Recent research from eastern England has argued for extensive MIS 8 glaciation (White et al., Reference White, Bridgland, Westaway and Straw2017). Similarly, Beets et al. (Reference Beets, Meijer, Beets, Cleveringa, Laban and van der Spek2005) argued that tills in the southern North Sea are MIS 8 in age, based on measurements of the isoleucine epimerisation of mollusc shells and foraminiferal tests. However, throughout the region, no unequivocal physical evidence of glaciation during this interval has been identified, and questions remain as to the real extent of ice over northwestern Europe at this time. By contrast, ice advanced across Poland and the Baltic states, reaching the south Polish uplands (Marks, Reference Marks2011). Toucanne et al. (Reference Toucanne, Zaragosi, Bourillet, Cremer, Eynaud, Van Vliet-Lanoë and Penaud2009) showed that fluvial drainage through the English Channel during the MIS 10 and MIS 8 glaciations was significantly less than during MIS 6 and MIS 2. They attribute this difference to massive glacial meltwater drainage associated with much larger glaciations in MIS 6 and 2 compared to MIS 10 and 8.
In the mid-latitude mountains, glaciation dating to MIS 8 is sometimes reported (e.g., in the Italian Apennines; Giraudi and Giaccio, Reference Giraudi and Giaccio2017). In Montenegro, Hughes et al. (Reference Hughes, Woodward, van Calsteren and Thomas2011) dated moraine using U-series dating and found evidence for moraines predating MIS 6 yet post-dating older moraines ascribed to MIS 12. The presence of MIS 7 calcites within these moraines led Hughes and coworkers to tentatively suggest a MIS 8 age for the moraines, although they noted that in other valleys the MIS 6 glaciation was larger. Variations in the extents of mountain glaciers as a result of local topoclimatic controls is likely to complicate the glacial sequence at local scales, unlike for larger ice sheets, where the wider regional climate pattern drives glacier mass balance. However, in key mid-latitude mountains in the Southern Hemisphere, such as in Tasmania, what were previously thought to be MIS 8 moraines are now known to be older (Augustinus et al., Reference Augustinus, Fink, Fletcher and Thomas2017). So caution must be given to any tentative ages suggesting MIS 8 glaciation.
MIS 11–10 (terminations V to IV)
MIS 10 has a classic asymmetrical pattern in the marine isotope record (Fig. 2). The glacial cycle has a similar structure to MIS 12 but is less severe, with higher global sea levels (Table 1). The marine isotope record does not indicate major double-glaciation patterns exhibited in other glacial cycles and, unlike some glacial cycles, does not have pronounced interstadial conditions mid-cycle. However, the dust record from Antarctica does indicate two major dust peaks, one at ca. 342–341 ka corresponding to the “glacial maximum” indicated in the marine isotope record and another even larger dust peak earlier in the glacial cycle at ca. 355 ka. The latter occurs in substage MIS 10b, which is associated with the coldest part of MIS 10 recorded in global SSTs and also the lowest atmospheric CO2 levels (Figs. 1 and 2). This asynchrony and offset between the composite marine isotope record (as a record of both ice volume and SSTs) and decoupled global SSTs is ca. 25 ka for this glacial cycle.
Solar radiation in the Northern Hemisphere was lowest late in the glacial cycle, close in time to the glacial maximum indicated in the marine isotope record. Before this, insolation is relatively high and sustained at >480 W m−2, with only minor troughs earlier in the glacial cycle, except for a more significant trough at the MIS 11c/11a boundary that marks the beginning of the glacial cycle.
The evidence for MIS 10 glaciation on land is scarce despite it being characterised by one of the severe cold phases recorded in global SSTs and a pronounced event in marine isotope record on a par with other major glaciations. The terrestrial glacial record in Europe is similar to MIS 8, in that MIS 10 was usually a smaller glacial event than MIS 6, although MIS 10 was smaller than both MIS 8 and 6 in Siberia (Astakhov et al., Reference Astakhov, Shkatova, Zastrozhnov and Chuyko2016). In northern Germany, luminescence ages of ice-marginal deposits indicate ice advances during MIS 10 with ages ranging from 376±27 to 337±21 ka (Roskosch et al., Reference Roskosch, Winsermann, Polom, Brandes, Tsukamoto, Weitkamp, Batholomäus, Henningsen and Frechen2014). In their paper, Roskosch et al. (Reference Roskosch, Winsermann, Polom, Brandes, Tsukamoto, Weitkamp, Batholomäus, Henningsen and Frechen2014) argue that MIS 12, 10, 8, and 6 glaciations reached approximately the same position in the Leine Valley and further east in Poland (e.g. Marks, Reference Marks2011). However, the evidence for MIS 10, and indeed MIS 8 glaciation across wider Europe, remains in question, as the relationships between sand deposits dated using luminescence techniques and glacial extents can often be ambiguous. In the Italian Apennines, 36Ar/40Ar dating of tephra within glaciolacustrine deposits has shown that glaciers advanced in the catchment in MIS 10 (Giraudi et al., Reference Giraudi, Bodrato, Ricci Lucchi, Cipriani, Villa, Giaccio and Zuppi2011; Giraudi and Giaccio, Reference Giraudi and Giaccio2017.). Elsewhere, in southernmost central Tibet, Owen et al. (Reference Owen, Robinson, Benn, Finkel, Davis, Yi, Putkonen, Li and Murray2009, Reference Owen, Yi, Finkel and Davis2010) argued that moraines are considerably older than 300 ka and most likely formed during MIS 10 or during an earlier glacial cycle when ice caps expanded during the Naimona’nyi glaciation. This was based on 10Be exposure dating from moraine boulders.
Despite the relatively limited direct evidence of glaciation, global ice volume must have been substantial, because relative sea levels were on a par with MIS 12 (Rabineau et al., Reference Rabineau, Berné, Olivet, Aslanian, Guillocheau and Joseph2006). The δ18O signal also shows that this glaciation was the fifth in terms of magnitude of the last 10 glacial cycles after MIS 16, 12, 6, and 5d–2.
MIS 13-12 (terminations VI to V)
MIS 12 (Elsterian Stage) was one of the most pronounced of all cold stages, with an amplitude and δ18O maximum only matched by MIS 16. Based on the top 5% of δ18O values, MIS 12 was the severest glacial cycle. Calculations of detrended global sea levels (Shakun et al., Reference Shakun, Lea, Lisiecki and Raymo2015) also suggest that this was one of the largest glaciations in terms of ice volume of the last 10 glacial cycles (Table 1). It was also the coldest of the last 10 glacial cycles recorded in global SSTs (Fig. 1) (Shakun et al., Reference Shakun, Lea, Lisiecki and Raymo2015). In addition to the severity of MIS 12, it was the second longest glacial cycle (after the last glacial cycle), with a termination-to-termination length of 109 ka. This is partly because of the prolonged weak preceding interglacial period (MIS 13). The length of MIS 12 itself is relatively short (Table 1), as is the span of glacial inception to glacial termination (Fig. 2), although these measures clearly provide a misleading perspective of the magnitude and length of this glacial cycle. MIS 12 is especially significant, because it was characterised by some of the largest glaciations recorded in the Northern Hemisphere. Relative sea-level minima during this glacial cycle were the lowest of the past 500 ka at more than −150±10 m compared with −102±6 m for MIS 5d–2, 6, and 8 (Rabineau et al., Reference Rabineau, Berné, Olivet, Aslanian, Guillocheau and Joseph2006).
The severity of glaciation in MIS 12 is highlighted by the dust peak recorded in Antarctica (Fig. 2), which is very pronounced at the δ18O maximum (at ca. 435 ka) and represents the greatest dust flux of all the last 10 glacial cycles. The dust record from Antarctica indicates significant aridity in the build-up to the MIS 12 glacial maximum (MIS 12a), with significant dust peaks between 430 and 470 ka in MIS 12c. The intervening interstadial of MIS 12b is characterised by reduced dust flux and lower δ18O values. Major dust peaks at ca. 434 and 481 ka are associated with major bolide impact events (Narcisi et al., Reference Narcisi, Petit and Engrand2007; Misawa et al., Reference Misawa, Kohno, Tomiyama, Noguchi, Nakamura, Nagao, Mikouchi and Nishiizumi2010), with the 481 ka most obviously standing out from terrestrial dust signal, an event caused by atmospheric disintegration of a >108 kg projectile that caused continental-scale distribution of ablation debris across Antarctica (van Ginneken et al., Reference Van Ginneken, Folco, Perchiazzi, Rochette and Bland2010). This was soon followed by a steep collapse in global SSTs to the coldest recorded event of the last 10 glacial cycles, which occurred just 5 ka later at 475 ka in MIS 12c (Fig. 1). Significantly, this was not the global glacial maximum of MIS 12, which occurred later at ca. 438 ka in MIS 12a.
Solar radiation in the Northern Hemisphere was at its lowest early in the glacial cycle (at ca. 480–475 ka). Coinciding with this during the glacial inception into MIS 12, the SST in the North Atlantic Iberian margin decreased 5°C from 478 to 473.5 ka (Rodrigues et al., Reference Rodrigues, Voelker, Grimalt, Abrantes and Naughton2011). However, this initial trough in solar radiation was followed by the low-amplitude variations of solar radiation through the glacial cycle, because the amplitude of precession cycles was reduced due to low orbital eccentricity. In fact, the period between 460 and 425 ka was characterised by much lower-amplitude variations in solar radiation compared with many other glacial cycles (Fig. 2),
In continental Europe, the Elsterian Stage glaciation was more extensive than during the Saalian Stage (MIS 6) limits in eastern Germany and Poland, although not in western Germany and the Netherlands. In the Balkans, the largest glaciation has been dated to >350 ka by U-series dating of secondary carbonates within moraines, with the latter then correlated with MIS 12 by correlation with long lacustrine sequences in Greece (Hughes et al., Reference Hughes, Gibbard and Woodward2005, Reference Hughes, Woodward, Gibbard, Macklin, Gilmour and Smith2006, Reference Hughes, Woodward, van Calsteren, Thomas and Adamson2010, Reference Hughes, Woodward, van Calsteren and Thomas2011). The Elsterian Stage is equivalent to the Anglian and Okian Stages (MIS 12) in the British Isles and Russia, respectively. The Anglian Stage represents the most extensive recorded glaciation in southeastern England, when ice reached as far as London. In North America, MIS 12 is correlated with the Illinoian D Stage.
MIS 15–14 (terminations VII to VI)
MIS 14 is known to have been characterised by limited ice extent. This is indicated in the marine isotope record, where the maximum δ18O value of this cold stage was 4.55 at 548 ka, which is the lowest δ18O value of all the last 10 cold stages (Table 1). Ice volume would have been the lowest of all the last 10 glacial cycles, with global sea levels much higher than in other glacial periods (Table 1). The relatively weak global glaciation associated with MIS 14 has been proposed as a direct cause of the extended interglacial complex of MIS 15–13 (Hao et al., Reference Hao, Wang, Oldfield and Guo2015). A similar argument could be proposed for MIS 7, which also has an extended duration and is preceded by a relatively weak glacial cycle (Fig. 1). Despite this evidence, global SSTs during MIS 14 were as cold as other glacial periods that were characterised by much bigger glaciations (Fig. 1).
The onset of MIS 14 follows a trough in solar radiation between 570 and 565 ka at the end of MIS 15 (Fig. 2B). Hao et al. (Reference Hao, Wang, Oldfield and Guo2015) noted that MIS 14 is also characterised by a later trough in solar radiation early in the glacial cycle and argued for a southern inception of glaciation that was associated with changes in the Antarctic ice sheets, since MIS 14 is recorded as a severe cold interval in Southern Hemisphere records, but not so in the Northern Hemisphere.
The Antarctic dust signal for MIS 14 is much weaker than for any other glacial cycles, with dust flux <12 mg/m2/a. A double-peak pattern is evident at ca. 540 and 530 ka, with the first peak larger than the second (Fig. 2B).
There is little direct evidence of glaciation on land from MIS 14, probably because it was limited in extent compared to later glaciations. However, there are some rare accounts of indirect evidence for glaciation in this interval. In the Italian Apennines, there is evidence that MIS 14 was characterised by significant mountain glacial advances based on evidence recorded in a sediment basin immediately downvalley of glaciated uplands. Here, a glacier advance has been dated to MIS 14 by applying 36Ar/40Ar dating to tephra deposits in a pro-glacial lacustrine sequence in the Campo Felice Basin (Giraudi et al., Reference Giraudi, Bodrato, Ricci Lucchi, Cipriani, Villa, Giaccio and Zuppi2011).
MIS 17–16 (terminations VIII to VII)
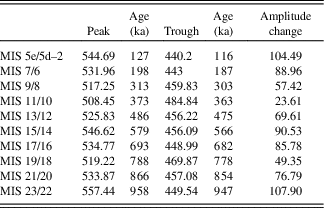
MIS 16 was a major cold phase, recording one of the greatest signals of global ice volume with maximum δ18O values equal to MIS 12 (Table 1). However, when SSTs are decoupled from the δ18O record, then MIS 16 appears less severe and no colder than MIS 14 (Fig. 1). Yet the lower quartile value of global sea-level reconstructions (Shakun et al., Reference Shakun, Lea, Lisiecki and Raymo2015) suggests that global ice volume was on a par with some of the largest glaciations in other glacial cycles (Table 1). MIS 16 was characterised by two major dust peaks, successively larger at 670–660 and 640–630 ka (Fig. 2B). These dust peaks are separated by a period of warming over Antarctica. However, depressed global SSTs were sustained between both these dust peaks, with the coldest temperatures reached at 650 ka (Fig. 1). Solar radiation is marked by a strong minimum early in the glacial cycle (690–680 ka) (Table 2).
Solar radiation peak-trough amplitude at 60°N early in glacial periods or at the end of preceding interglacial periods. Solar radiation data are derived from Berger and Loutre (Reference Berger and Loutre1991) and Berger (Reference Berger1992). Marine isotope ages are from Lisiecki and Raymo (Reference Lisiecki and Raymo2005).

In Europe, MIS 16 is associated with the Don glaciation (Donian Stage; “Cromerian Complex” Stage, glacial c). This was substantially less extensive than the Saalian Stage (MIS 6) and Elsterian Stage (MIS 12) glaciations in western and central Europe. The British and Fennoscandian Ice Sheets terminated in the central North Sea basin in MIS 16 (Lamb et al., Reference Lamb, Huuse and Stewart2016). However, MIS 16 was marked by the most extensive glaciation of the southern Russian Plain, with an ice lobe reaching into the Don Valley between Moscow and Volgograd, sourced from both Fennoscandia and Novaya Zemlya. In North America, Bierman et al. (Reference Bierman, Marsella, Patterson, Thompson Davis and Caffee1999) provided cosmogenic 10Be/26Al exposure ages consistent with glaciation during MIS 16 from eroded quartzite surfaces associated with some of the southernmost extensions of the Laurentide Ice Sheet in Minnesota. In the Southern Hemisphere, evidence for MIS 16 glaciation is also recorded in cosmogenic exposure ages in Tasmania (Fink and Augustinus, Reference Fink and Augustinus2010).
MIS 16 was characterised by very low CO2 atmospheric concentrations, the lowest of the last eight glacial cycles, with values below 180 ppm for 3 ka during MIS 16 (Lüthi et al., Reference Lüthi, Floch, Bereiter, Blunier, Barnola, Raynaud, Jouzel, Fischer, Kawamura and Stocker2008). This is attributed to pronounced oceanic carbon storage at this time. Major ice-rafting is recorded in North Atlantic sediments during MIS 16 at ~640 ka, and Hodell et al. (Reference Hodell, Channell, Curtis, Romero and Röhl2008) suggest that this represents the onset of Heinrich events in this region and the initiation of catastrophic surging of the Laurentide Ice Sheet. This is consistent with the global large ice volume indicated in the marine isotope record for this glacial cycle, since this record is dominated by the Laurentide Ice Sheet (Hughes et al., Reference Hughes, Gibbard and Ehlers2013).
MIS 19–18 (terminations IX to VIII)
MIS 18 spans 60 ka and contains two distinct glacial periods in the marine isotope record. These are MIS 18a and 18e, with the largest δ18O trough being in the later MIS 18a (Figs. 1 and 2B). However, the Antarctic ice-core dust record shows a much larger peak in MIS 18e (28 mg/m2/a) compared with 18a (15 mg/m2/a). An unusually large dust peak at 743 ka (46 mg/m2/a) is unlikely to be terrestrial dust and preceded the dust peak in MIS 18e by ca. 1.7 ka. It is likely that the 743 ka dust peak is associated with a meteoritic event like those that occurred at 434 and 481 ka (cf. MIS 12). MIS 18e is also characterised by colder global SST than the later MIS 18a.
The δ18O trough value of 4.75 at 718 ka is close to the median of the last 10 cold stages (Table 1), and the lower quartile value of global sea levels is higher than all other following glacial periods but lower than MIS 14 and 8. A notable characteristic of this glacial cycle is also the strong interstadial of MIS 18b–d. This represents the largest amplitude in δ18O variation within any of the last 10 glacial cycles. Peak amplitude can be defined as the difference in δ18O values between the peak of the substage (MIS 18c) and the smallest of the troughs either side (MIS 18e). This is only matched by MIS 9a and 23c. The interstadial of MIS 18b–d is also very prominent in the EPICA ice-core temperature record and is characterised by a 5°C amplitude peak.
MIS 18 is one of only three glacial cycles that do not have a major trough in Northern Hemisphere insolation early in the glacial cycle or at the end of the preceding interglacial period. The largest solar minimum in MIS 18 occurs late in the glacial cycle, close to the glacial maximum indicated in the marine isotope record. The warm interstadial of MIS 18b–d is characterised by an insolation peak.
As with MIS 14 (discussed earlier) and MIS 20 (discussed in the following section), there is little direct evidence of glaciation on land in MIS 18. Head and Gibbard (Reference Head and Gibbard2015) noted that this implies that later glaciations were more extensive and therefore probably destroyed evidence for these events, but also that some of these glacial deposits have been inadequately differentiated owing to the limitations of current dating techniques. However, MIS 18 is represented on the Russian Plain by the Setun Till (and equivalents), during which ice expanded from Scandinavia as far south as the Tula region (Velichko et al., Reference Velichko, Faustova, Gribchenko, Pisareva and Sudakova2004). It is related to ‘glacial b’ of the ‘Cromerian Complex’ Stage. In China, the Wangkun glaciation, the oldest in the Kunlun Shan Pass, was dated at 710 ka using electron spin resonance. This is similar to the 36Cl age of the bottom ice layer of a 309 m ice core of the Guliya Ice Cap, western Kunlun Shan. These ages coincide with MIS 18 and suggest ice build-up at this time (Zhou et al., Reference Zhou, Wang, Wang and Xu2006).
MIS 21–20 (terminations X to IX)
MIS 20 was the second shortest cold stage of the last 10 glacial cycles, with a span of 55 ka. In terms of ice volume, the marine isotope δ18O value was close to the median of the last 10 glacial cycles (Table 1). MIS 20 was preceded by a major Northern Hemisphere insolation minimum in MIS 21 at ca. 854 ka. The amplitude of solar flux declines through the following glacial cycle of MIS 20 (Figs. 2B and 4).
Limits of the Eurasia contiguous ice sheets during the middle and late Pleistocene. Adapted from information in Svendsen et al. (Reference Svendsen, Alexanderson, Astakhov, Demidov, Dowdeswell, Funder and Gataullin2004), Ehlers and Gibbard (Reference Ehlers and Gibbard2004), and Astakhov et al. (Reference Astakhov, Shkatova, Zastrozhnov and Chuyko2016).

In Europe, MIS 20 is equated to ‘glacial a’ of the ‘Cromerian Complex’ Stage. Little or no evidence of glaciation during this event is known. However, according to Velichko et al. (Reference Velichko, Faustova, Gribchenko, Pisareva and Sudakova2004), Fennoscandian ice expanded during this event as far south as Moscow, where till is attributed to the Likovo glaciation. Possible limited glacial extent elsewhere is implied by finds of erratic clasts in fluvial sediments in Europe (e.g. Clark et al., Reference Clark, Gibbard and Rose2004). Oceanic evidence of warm waters in the North Atlantic off-Iberia during MIS 20 and 18 indicate that atmospheric moisture derived from this warm water might have been advected deep into continental Europe and contributed to enhanced growth of Alpine glaciers (Bahr et al., Reference Bahr, Kaboth, Hodell, Zeeden, Fiebig and Friedrich2018).
MIS 23–22 (terminations XI to X) or 25–22 (terminations XII to X)
MIS 24–22 is important for considering global glaciations, because it has been identified by some as the first of the 100 ka cycles following the mid-Pleistocene Transition. It includes MIS 23, which some describe as an interglacial period (e.g., Pena and Goldstein, Reference Pena and Goldstein2014), whereas others consider MIS 22–24 to represent a long, single, glacial cycle, the first prolonged 100 ka cycle (e.g., Elderfield et al., Reference Elderfield, Ferretti, Greaves, Crowhurst, McCave, Hodell and Piotrowski2012). When δ18O values are compared with other glacial records, then MIS 23 does not have the magnitude of later interglacial periods (Fig. 1). Thus, the glacial cycle can be defined as the interval between terminations XII to X. On the basis of this subdivision, the glacial cycle represents the second-longest cold stage of the last 10 glacial cycles (after the last glacial cycle) when defined based on marine isotope stages and the equal second longest when defined from termination to termination (Table 1). MIS 24–22 is characterised by some significant changes in drivers of environmental change. The amplitude of solar insolation in the Northern Hemisphere in the downturn to MIS 24 was the largest of all the glacial cycles (Fig. 4, Table 2). MIS 22–24 was also a period of marked global CO2 reduction (Hönisch et al., Reference Hönisch, Hemming, Archer, Siddall and McManus2009) and saw major Antarctic ice expansion (Elderfield et al., Reference Elderfield, Ferretti, Greaves, Crowhurst, McCave, Hodell and Piotrowski2012). This cold stage was also marked by a significant change in the global ocean thermohaline circulation system, which became much weaker in this glacial cycle than in earlier glacial periods (Pena and Goldstein, Reference Pena and Goldstein2014).
Preservation of surface glacial evidence for such an old glaciation is obviously rare, but major glaciation is recorded indirectly in several contexts. In the Italian Dolomites, glaciation became established during MIS 22 (Muttoni et al., Reference Muttoni, Carcano, Garzanti, Ghielmi, Piccin, Pini, Rogledi and Sciunnach2003). Large-scale glaciation is first seen in North America in MIS 22 (Barendregt and Duk-Rodkin, Reference Barendregt and Duk-Rodkin2011; Duk-Rodkin and Barendregt, Reference Duk-Rodkin and Barendregt2011). In Pennsylvania, the most extensive glacial record is attributed to MIS 22 or older (Braun, Reference Braun2011) and presents a rare example of how the lateral extent of this glaciation was possibly greater than all later glaciations. The transition to a thicker Laurentide Ice Sheet around this time (~950 ka) has been attributed to a change in subglacial conditions caused by earlier ice sheet removal of thick regolith (Clark and Pollard, Reference Clark and Pollard1999). However, a substantial increase in ice volume through the mid-Pleistocene Transition was a global phenomenon. For example, in the Southern Hemisphere, in Tasmania, the Bulgobac glaciation—the most extensive on this island—has been dated to 890–783 ka using magnetic polarity (Augustinius and Macphail, Reference Augustinus and Macphail1997); this time period encompasses MIS 22 and 20.
CONTROLS AND DRIVERS OF GLACIAL CYCLES
Solar forcing and CO2
Solar forcing of global climate in response to orbital variations has been the established paradigm for understanding the pacing of glacial cycles for over 40 years (e.g., Hays et al., Reference Hays, Imbrie and Shackleton1976). However, the relationship between solar forcing and global glacier behaviour is less well established. Within glacial periods, precessional cycles and the seasonal patterns of solar receipt exert important controls on global ice volume, with deglaciations triggered every fourth or fifth precessional cycle (Ridgwell et al., Reference Ridgwell., Watson and Raymo1999). Glacier ablation is largely driven by summer temperatures, which is directly influenced by summer insolation. Thus, variations in the latter through glacial cycles are likely to have a profound impact on glacier mass balance. This has important implications for not only deglaciations but also glacier build-up at glacial inceptions.
Many of the glacial cycles with the biggest recorded glaciations saw the lowest Northern Hemisphere insolation during the glacial inception at the end of the preceding interglacial period. This was the case for MIS 5d–2, 6, 8, 12, 14, 16, 20 and 24–22. MIS 18 and 10 are both preceded by solar troughs, but this is exceeded later in the cold stage. The fact that many of the major cold stages begin with a major trough in insolation in the Northern Hemisphere suggests that glacial inception and the significant build-up of glaciers starts in the Northern Hemisphere. This is because of the much larger land area in this hemisphere. Furthermore, the build-up and collapse of ice sheets over the Northern Hemisphere, especially over North America, dominate the ice volume signal in the global δ18O record. This is compounded by the fact that there has been comparatively little change in ice volume over Antarctica between some glacial and interglacial periods (e.g., Lilly et al., Reference Lilly, Fink, Fabel and Lambeck2010; Hughes et al., Reference Hughes, Gibbard and Ehlers2013; Joy et al., Reference Joy, Fink, Storey, De Pascale, Quigley and Fujioka2017).
Ganopolski et al. (Reference Ganopolski, Winkelmann and Schellnhuber2016) highlighted the importance of CO2 in glacial inception. They identified points in time when low CO2 corresponded with low insolation as potential triggers for global ice build-up. This theory argues that low insolation alone cannot explain the inception of global glacial inception. Instead, it is the combination of insolation forcing with atmospheric CO2 concentrations that drives glacial inceptions. Nevertheless, the troughs in insolation in the high northern latitudes all coincide with the points in time identified by Ganopolski et al. (Reference Ganopolski, Winkelmann and Schellnhuber2016) as favourable for glacial inception.
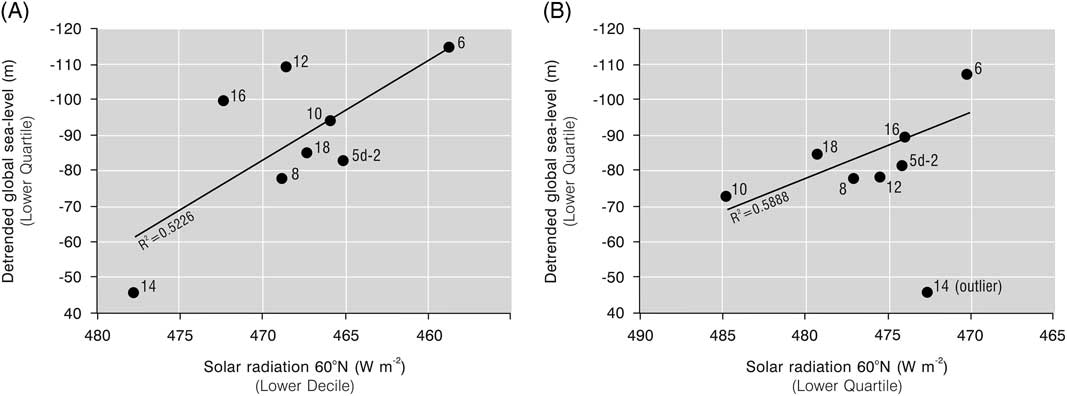
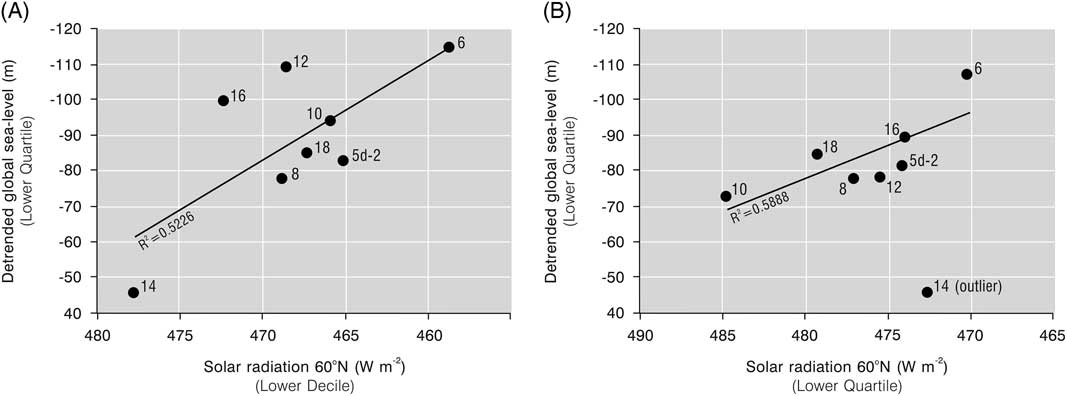
The relationship between Northern Hemisphere solar radiation and global sea levels is illustrated in Figure 5 for glacial cycles defined by both MIS boundaries (A) and when defined by termination to termination (B). Global sea-level minima are summarised by the lower quartile of detrended global sea-level data provided in Shakun et al. (Reference Shakun, Lea, Lisiecki and Raymo2015). Absolute minima from this data set are not used, because the sea-level values only represent approximate estimates. Nevertheless, a medium-strong relationship can be observed when comparing the sea-level data with solar radiation (Fig. 5). This shows that there is a statistically significant relationship between the lowest quartile or decile June solar radiation at 60°N and global sea levels as recorded in the lower quartile of detrended sea level in the global stack of Shakun et al. (Reference Shakun, Lea, Lisiecki and Raymo2015). The strongest relationships are seen when using the lower-quartile solar radiation values for the shorter MIS glacial definitions (i.e., MIS 5d–2, 6, 8, etc.) and when using the lower-decile solar radiation values for the longer termination-to-termination definitions. The strength of the relationships (R 2=0.5226 and 0.5888) indicates that just over half of global sea-level change may be explained through variations in Northern Hemisphere solar radiation. The explanation being that solar radiation drives global ice volume, which then drives global sea-level change. The rest of the variation in global sea-level change, unaccounted for by solar variations, must also be down to other factors, although still largely related to global ice dynamics and global temperatures. A striking outlier in the relationship when considering the termination-to-termination interval is MIS 14, which is excluded from the regression trend line in Figure 5B. This suggests that this marine isotope stage does not conform to the pattern of other orbitally driven glacial cycles.
Regression between mean Northern Hemisphere solar radiation (at 60°N) and the sea levels detrended from the δ18O record for the last eight glacial cycles using solar radiation data from Berger and Loutre (Reference Berger and Loutre1991) and Berger (Reference Berger1992) and detrended sea-level data from Shakun et al. (Reference Shakun, Lea, Lisiecki and Raymo2015). (A) Glacial cycles defined using the marine isotope stage boundaries (i.e., MIS 5d–2, 6, 8, 10, 12, 14, 16, 18). (B) Glacial cycles defined by termination to termination; MIS 14 is excluded from the regression trend line calculation. The relationships are statistically significant for trend lines shown in (A) and (B), where p-values are 0.0427 and 0.0440, respectively.
The correlations between global sea level and solar radiation highlights the importance of internal controls on glacier–climate dynamics in controlling the nature of glacial cycles. Almost all theories of ice ages feature a phenomenon of synchronisation between internal climate dynamics and astronomical forcing (Crucifix, Reference Crucifix2012). However, whilst solar forcing is clearly important in glacial inceptions (this paper) and also for the prediction of glacial inceptions and interglacial periods (Ganopolski et al., Reference Ganopolski, Winkelmann and Schellnhuber2016; Tzedakis et al., Reference Tzedakis, Crucifix, Mitsui and Wolff2017), there should not be too much emphasis placed on solar forcing as a driver of global glacier dynamics within glacial cycles.
The first of the 100 ka glacial cycles is marked by the cold interval of MIS 24–22. This cold stage was preceded early in the glacial cycle by the largest amplitude change (from peak to trough) in insolation in the Northern Hemisphere of the last million years. The second-largest amplitude change in insolation (from peak to trough) of the last million years occurred at the start of the last glacial cycle (MIS 5d–2). Significantly, both MIS 5d–2 and MIS 24–22 were the longest of the last 10 glacial cycles, hinting at a causal relationship between insolation amplitude changes at the beginning of glacial cycles and the glacial-cycle length. Whether the trough in insolation is at the end of the preceding interglacial period or at the start of the glacial period is not significant. This is partly because glacial–interglacial boundaries are relatively arbitrary constructs and, more significantly, because glaciers can form today in relatively warm conditions so long as snow accumulation is great enough (e.g. Hughes, Reference Hughes2008, Reference Hughes2009). The key is to provide a kick-start to glacier expansion via reduced summer melting at a time of sustained winter precipitation. The fact that MIS 25/24 saw the largest amplitude changes in solar radiation from peak to trough at both 60°N and 30°N, whereas for MIS 5e/5d the 30°N was much less than at 60°N, suggests that for the former the mid-latitudes were more affected. This is likely to have caused early glacier expansion in MIS 24–22 not just in high-latitude Asia, such as Siberia, as was the case for the last glacial cycle, but also in central Asia in places like the Altai, the Tien Shan, and the Tibetan Plateau.
It is possible that the first 100 ka cycle was driven by global glacier behaviour and associated climate feedbacks, with MIS 24–22 looking very much like MIS 5d–2 and MIS 23 analogous to MIS 3 (Figs. 1 and 2). Both MIS 5–2 and MIS 24–22 were characterised by an early glacier maxima in Asia (driven by a large insolation trough at the end of the preceding interglacial period), that was then followed by glacier advances spreading out to the maritime margins around the Atlantic (as climate cooled) for the second half (and maximum) of the glacial cycles. This effect prolongs the glacial intervals as first the Eurasian continental glaciers grow, then recede as climate becomes too dry, whilst the maritime-driven ice sheets around the North Atlantic continue to grow and dominate the world’s ice-volume record.
Another important consideration is the effect of precession on the melt season. During the last glacial cycle, the effects of precession decline through the glacial cycle. This means that the lengthening of the melt season during upswings to solar peaks becomes diminished. This is characteristic of most glacial cycles, and the resulting excess ice build-up causes ice sheet instability and ultimate collapse during terminations after the fourth or fifth precessional cycles (Raymo, Reference Raymo1997; Ridgwell et al., Reference Ridgwell., Watson and Raymo1999).
Geographic location
The pattern of solar radiation receipt in the Northern Hemisphere has a close relationship to the pattern of Antarctic air temperatures (Fig. 2). This implies a Northern Hemisphere role in driving global climate over the last ten 100 ka glacial cycles. Whilst Miocene ice build-up in Antarctica is likely to have been enabled by changing continental configurations in the Southern Hemisphere (e.g., Scher and Martin, Reference Scher and Martin2006), for the last 800 ka there are clear links observed between climate changes in the Greenland and Antarctic ice-core records (EPICA, 2006; Jouzel et al., Reference Jouzel, Masson-Delmotte, Cattani, Dreyfus, Falourd, Hoffmann and Minster2007a). The thermal bipolar seesaw, whereby climate changes in the Northern and Southern Hemispheres are closely linked, albeit asynchronously at millennial time scales, is often attributed to oceanographic controls (Shackleton et al., Reference Shackleton, Hall and Vincent2000; Stocker and Johnsen, Reference Stocker and Johnsen2003; Stenni et al., Reference Stenni, Buiron, Frezzoti, Albani, Barbante, Bard and Barnola2011). However, whilst Shackleton et al. (Reference Shackleton, Hall and Vincent2000) noted that the planktonic δ18O record off Portugal closely matched the Greenland ice-core records, the benthic δ18O record was in phase with the temperature record from the Vostok ice core in Antarctica. This led Shackleton et al. (Reference Shackleton, Hall and Vincent2000) to suggest that Antarctic temperatures changes as a result of global ice volume, which, as highlighted in the previous section, is dominated by events in the Northern Hemisphere.
Rohling et al. (Reference Rohling, Hibbert, Williams, Grant, Marino, Foster and Hennekam2017) highlighted the contrast in global ice distributions between the PGM and the LGM, with Eurasia displaying much larger ice volume during the former compared with the latter. This situation is likely to be partly driven by wetter conditions over Eurasia during MIS 6, a situation enabled by warmer global oceans (Fig. 1). This illustrates how geographic variations in the effects and strengths of oceanic/maritime influences on land can cause major differences in global ice distributions. However, whilst global ocean temperature patterns are likely to affect global glacier distributions, there is evidence, for the early Pleistocene at least, that the role of ice sheets themselves in controlling global air and ocean temperatures may be more limited (cf. Shakun, Reference Shakun2017).
Continentality affects glacier build-up and development in three ways. First, continental interiors are more sensitive to changes in solar radiation receipt than maritime areas. Land masses have a lesser heat capacity than the oceans, resulting in greater sensible and latent heat flux over the former in response to increased solar radiation. Second, moisture supply to continental areas is strongly affected by the prevailing synoptic conditions, especially the development of blocking anticyclones. The first effect essentially controls temperatures, whilst the second controls precipitation—both fundamental factors in glacier mass balance. A third effect of continentality is on the response of glacier mass balance to changes in temperatures. For example, cold and dry glaciers are less sensitive to a change in air temperatures than warm and wet glaciers (Braithwaite and Raper, Reference Braithwaite and Raper2007). This is important, because it means that, once established, continental glaciers will be less sensitive to climatic cooling than maritime glaciers. Continental glaciers are therefore not as sensitive to temperature effects compared with the effects of moisture supply. This third point therefore implies that it is moisture supply to the continental interiors that will ultimately drive glacier behaviour in these regions through glacial cycles. So, with respect to glacier mass balance, it is likely that the effect of solar radiation changes on seasonal distribution of precipitation (accumulation) is likely to be more significant than the relationship between solar radiation and summer temperatures (ablation). Furthermore, the supply of moisture to Arctic Asia would require an open Arctic Ocean, a situation that is much more likely early in a glacial cycle during the preceding interglacial periods.
The effect of early glacier advances in Arctic Asia and in mid-latitude interior mountain chains (cf. Hughes et al., Reference Hughes, Gibbard and Ehlers2013 and references therein) may explain the first prominent dust flux recorded over Antarctica. This indicator of global aridity is likely to have caused continental and mid-latitude glaciers to retreat. This is also enhanced by notable mid-cycle warming events recorded in Antarctica in many of the glacial cycles. In northeast Asia, the climate was warm and wet in summer at the global LGM (Meyer and Barr, Reference Meyer and Barr2017). Winters would have been severe, however, with extensive sea ice over the north Pacific inhibiting moisture availability in winter. Dry cold winters and warm wet summers are the least favourable combination for glacier development, and this may explain why glaciers were restricted in size over northeast Asia in the middle to later parts of the last cold stage (i.e., through MIS 3 and 2).The larger ice sheets at the oceanic margins are able to continue growing, as moisture supply is likely to be sustained through these interstadial conditions, as has been indicated in tree populations at mid-latitude locations for multiple glacial cycles (e.g., Fletcher et al., Reference Fletcher, Sánchez-Goñi, Allen, Cheddadi, Combourieu Nebout, Huntley and Lawson2010, Reference Fletcher, Müller, Koutsodendris, Christanis and Pross2013; Roucoux et al., Reference Roucoux, Tzedakis, Lawson and Margari2011). However, once ice masses reach a size sufficient to affect not only regional but global climate, then global aridity reaches its maximum late in the glacial cycle at the global glacial maxima. This is represented by a second prominent dust peak in all glacial cycles. For four of the last eight cold stages (MIS 16, 12, 6, 5d–2), which include some with the largest ice volumes, the second peak in dust flux is larger than the first. This pattern is reversed in MIS 8, 10, 14 and 18, which includes cold stages with the smallest ice volume. This may indicate that the early glacier advances in the continental interiors were the largest of the glacial cycles and not subsequently matched by significant glacier expansion in the oceanic margins. This is supported by the fact that some of the largest glaciations in Siberia occurred in MIS 8 (Astakhov et al., Reference Astakhov, Shkatova, Zastrozhnov and Chuyko2016), when overall this cold stage was one of the least significant of the last ten glacial cycles in terms of ice volume. This phenomenon can also be invoked to explain why in both MIS 8 and 10 global CO2 is lowest in the first major ice advance and higher in the second and at the global glacial maxima indicated in the ice volume record (Fig. 2).
Glacier size is important because of the effects of this on the rate of glacier response to climate changes (Bahr et al., Reference Bahr, Pfeffer, Sassolas and Meier1998). Alpine-style mid-latitude mountain glaciers respond more rapidly to climate changes than large ice sheets. This effect is partly interwoven with the climatic setting with small wet-cold maritime glaciers even more sensitive to climate changes than large dry-cold continental ice sheets. However, once glaciers achieve sufficient size, they can begin to control climate, causing positive feedbacks. Thus, as wet-cold maritime glaciers at oceanic margins grow to form ice caps, then ice sheets, and eventually submerge mountains, the climatic setting of these glaciers will morph from cold-wet maritime to dry-cold continental. In the process, the latter become less sensitive to changes in air temperature, as noted earlier (cf. Braithwaite and Raper, Reference Braithwaite and Raper2007). This may explain why the large ice sheets around the oceanic margins are able to persist and maintain growth late into the glacial cycle. Moisture-driven maritime glaciers are more likely to survive increased global aridity as glacial cycles persist, and by the time mid-glacial interstadial conditions are reached, as occurred in many glacial cycles, these glaciers have achieved ice sheet status. This has been confirmed through modelling for MIS 3, for example (Arnold et al., Reference Arnold, van Andel and Valen2002). If glaciers at oceanic margins have not achieved this size by mid-cycle, then it is possible that this explains why maximum ice volume is more limited in some cold stages than in others (i.e., MIS 8 and 14).
PROBLEMS AND PROSPECTS IN THE STUDY OF GLACIATIONS AND GLACIAL CYCLES
Southern Hemisphere glaciations and earlier 41 ka glacial cycles
This paper emphasises the role of the Northern Hemisphere in forcing global glaciations and concentrates on the last ten glacial cycles. This inevitably biases the study against the possibility of Southern Hemisphere glacial-forcing mechanisms and earlier 41 ka cycles. For example, the biggest glaciations recorded on land in places like Patagonia occurred at 1.1 Ma during MIS 30–34 (Rabassa et al., Reference Rabassa, Coronato and Salemme2005). Understanding the drivers of earlier glacial cycles requires further research, and it is not necessarily to be expected that the drivers of the last ten 100 ka glacial cycles can explain the patterns of earlier 41 ka glacial cycles.
Differences between individual glacial cycles as artefacts of larger 400 ka mega-glacial cycles
Figure 6 shows the moving average at 50 ka step intervals of the global marine isotope record for the past million years. This shows that the biggest amplitude variations between glacial and interglacial periods occurred during the past 450 ka. Lang and Wolff (Reference Lang and Wolff2011) made a similar observation in their study of glacial cycles, noting that strong interglacial periods are confined to the last 450 ka. However, whilst Figure 5 also shows that the largest glaciations are also confined to the past 450 ka, the phase change occurred earlier, at ca. 630 ka. Whilst the onset of 100 ka glacial cycles is often placed with MIS 24–22, Figure 6 shows that a distinct transition to the large-amplitude 100 ka glacial cycles can be identified after MIS 16. Global ice volume fluctuations therefore appear to lag the mid-Pleistocene Transition between 1.25 and 0.5 Ma (Head and Gibbard, Reference Head and Gibbard2005). Mudelsee and Schulz (Reference Mudelsee and Schulz1997) recognised this lag and suggested the onset of 100 ka cycle lags ice volume build-up by 280 ka, with an increase in amplitude at 641 ka. This is consistent with the large amplitude of MIS 16, and when examining glacial cycles in terms of 50 ka moving average (half the 100 ka cycle), then it becomes apparent that an abrupt change in glacial amplitude starts around this time (Fig. 6). The 50 ka moving average in Figure 6 shows that glacial periods became steadily stronger until MIS 16, and this was then followed by the prolonged interglacial/weak glacial complex of MIS 15–14–13. It is notable that it is not only some glacial periods that become longer and greater in amplitude after MIS 16, but interglacial periods become longer and greater in amplitude as well. In fact, the nature of preceding interglacial periods appears to affect the structure of some succeeding glacial periods, especially the weaker glacial periods encompassing MIS 14 and 8. The significance of MIS 12 in Figure 6 as one of the most pronounced glaciations is likely to be related to unique solar patterns, as noted earlier, with an initial trough in solar radiation that was then followed by the low-amplitude variations of solar radiation through the glacial cycle (Fig. 2B). This phase of low precession associated with minimum eccentricity towards the end of the 400 ka cycle (minimum at ~438–373 ka; Berger and Loutre, Reference Berger and Loutre1991; Laskar et al., Reference Laskar, Robutel, Joutel, Gastineau, Correia and Levrard2004) may have enabled ice sheets to expand dramatically during this glacial cycle. This is because lower precession diminishes the contrasts between winter and summer and so inhibits melting during the latter. This is potentially significant, since it hints at 400 ka glacial cycles that are modulated at 100 ka cycles, a pattern noted by Rial (Reference Rial1999).
The 50 ka moving average (dashed line) of δ18O in the global stack (thin black line) for Lisiecki and Raymo (Reference Lisiecki and Raymo2005). The interval of 50 ka is chosen, as this is half the theoretical 100 ka cycle. Increasing trends towards 100 ka cycles are illustrated by larger amplitudes in the 50 ka moving average of δ18O values. The vertical bold line marks the phase change from subdued 100 ka cycles to larger-amplitude 100 ka cycles from MIS 16 onwards.

CONCLUSIONS
The onset of glaciations within the last ten glacial cycles was driven by low solar radiation over Northern Hemisphere high latitudes with rapid glacier advance over the largest high-latitude land masses such as Asia. The driving solar forcing is likely to have been facilitated in conjunction with CO2 levels, with critical combinations required to cause glacial inception. This phenomenon of glacial inception can be recognised as a global hydrological event and is marked by early dust peaks in Antarctic ice-core records. In most glacial cycles, ice continued to build up in land areas bounded to the west by oceanic margins, such as the North Atlantic (British–Irish and Scandinavian ice sheets) and North Pacific (Cordillerran and Laurentide Ice Sheets). Whilst these ice masses grew, global climate became drier, resulting in a second and usually the most pronounced dust peak of glacial cycles recorded in Antarctic ice cores. Asian glaciers are likely to have retreated at this time.
The analogue for this scenario is the last glacial cycle, for which many glacier records are now well dated. MIS 24–22, the first cold episode of the 100 ka cycles, is very similar in structure to MIS 5d–2, especially in terms of its length and two-phase structure. Furthermore, MIS 24–22 was preceded by the largest amplitude drop in Northern Hemisphere solar radiation of all the last ten glacial cycles. As with the last glacial cycle, this would have caused early, rapid, and extensive Asian glacier expansion, and the intensity of this solar trigger may partly explain the length of the first 100 ka glacial cycle. Whilst common spatial and temporal patterns of glacier build-up and decay can be identified in four of the last eight glacial cycles, MIS 18, 14, 10 and 8 appear different. These were characterised by a more pronounced early dust peak in Antarctica compared with the second later peak, and this is attributed to weaker later oceanic margin glaciation, which usually occurs at the height of glacial cycles, in contrast to the early Asian advances.
Whilst solar radiation played an important role in glacial inceptions, it accounts for only about half of the variability in global ice volume magnitude during the last ten glacial cycles. The other half must be attributed to internal global climate dynamics, including the effects of glaciers themselves on the global climate system. In this respect, once ice sheets become sufficiently large, they exert feedback effects on the global climate system. Whilst glacier feedback mechanisms are well known as an explanation for the terminations of glacial cycles, this paper shows that glacier–climate feedbacks also influence the spatial and temporal patterns of global glaciations during glacial cycles.
ACKNOWLEDGMENTS
We would like to thank Doug Benn and an anonymous reviewer for their rigorous and very helpful reviews, and also the QR Associate Editor Jamie Shulmeister and QR Editor Lewis Owen for their comments on an earlier draft of this paper. The editorial process has greatly improved and refined our original ideas, and this is sincerely appreciated. We thank Bruce Railsback (University of Georgia) for helpful advice and comments on the subdivision of cold stages within glacial cycles; William Fletcher (University of Manchester), who provided some critical insight into the structure of glacial cycles; and also Chronis Tzedakis and Mark Maslin (University College London) for insightful discussion on glacial cycles and for pointing us in some useful directions. We thank Graham Bowden for drawing all the figures.