

Introduction
One of the distinct characteristics of the 1932–1934Footnote 1 famine (Famine hereafter) is the concentration of direct lossesFootnote 2 (or excess deaths) in a very short period, in the Ukrainian Soviet Socialist Republic (UkrSSR or Soviet Ukraine)Footnote 3 and the Russian Soviet Federative Socialist Republic (RSFSR).Footnote 4 Almost 90 percent of all direct losses in UkrSSR occurred in 1933, and 82 percent in RSFSR during the same period. None of the other Soviet Republics experienced such a high concentration of losses in 1933 (Rudnytskyi et al. Reference Rudnytskyi, Nataliia, Oleh, Pavlo, Curran, Luciuk and Newby2015a, 209). This concentration is even more pronounced in rural areas of both republics, and is actually the result of an extraordinary increase in mortality during the first half of that year. Thus, it is impossible to have a good understanding of the 1932–1934 famine in general and the Holodomor (name used to describe the famine in Soviet Ukraine) in particular, without an analysis of the mechanisms and causes related to this sudden increase in mortality at the beginning of 1933 and its sustained increase until mid-1933.
This characteristic of the Famine has been documented by Stanislav V. Kulchytskyi and Stephen G. Wheatcroft, among others. Starting in 1990, data on monthly mortality for the 1932–1934 period have been presented for Soviet Ukraine, RSFSR, and their regions in progressively more detail: (a) Wheatcroft (Reference Wheatcroft1990) provides monthly rural and urban crude death rates for UkrSSR and the RSFSR for the period 1932–1934; (b) Kulchytskyi (Reference Kulchytskyi2007, 399) registers numbers of rural deaths by month for 1932 and 1933 in UkrSSR; (c) Robert W. Davies and Stephen G. Wheatcroft (Reference Davies and Wheatcroft2009, 511) present yearly rural monthly crude deaths rates for 1932–1934, for UkrSSR, Kyiv and Kharkiv oblasts, and for RSFSR and the following regions: Moscow, Lower and Central Volga, Central Black Earth, and North Caucasus; (d) Wheatcroft and Garnaut (Reference Wheatcroft and Garnaut2013) graph monthly urban and rural crude death rates for UkrSSR, RSFSR, and several regions of RSFSR for 1932–1934; and (e) Wheatcroft, Garnaut, and Leikin (Reference Wheatcroft, Garnaut and Leikin2013) graph urban and rural monthly crude death rates for UkrSSR and its oblasts for the period 1932–1934. It is important to note that all crude death rates are based on registered, unadjusted deaths.
This progressive expansion of data on monthly mortality has brought attention to the seasonal dynamics during the Famine years, especially in 1933. However, all these data consist of or are based on registered deaths, and this presents two problems: (a) it has been shown that there was significant under-registration of deaths during the Famine, especially in 1933, and that this under-registration had significant variations across countries and regions (Andreev, Darskiy, and Kharkova Reference Andreev, Darskiy and Kharkova1998; Rudnystkyi et al. Reference Rudnytskyi, Nataliia, Oleh, Pavlo and Alla2015b; Vallin, Meslé, Adamets, and Pyrozhkov Reference Vallin, Meslé, Adamets and Pyrozhkov2002); and (b) the number of registered deaths, besides being affected by under-registration, includes the “normal” deaths that would have occurred had there been no Famine and the additional death caused by the Famine. Thus, analyses of the seasonal variation of mortality during the Famine years based on registered deaths are distorted by different degrees of under-registration and different levels of “normal” mortality. We eliminate these problems by analyzing these seasonal variations of mortality in terms of Famine losses or excess deaths—that is, additional deaths caused by the Famine. They are based on registered deaths adjusted for under-registration and do not include “normal” deaths. Losses provide a more precise estimate of the effects of the Famine on seasonal variations, as they measure the net effect of the Famine on mortality.
Little research has been done on the causes of the surge in mortality during the first half of 1933. Kulchytskyi (Reference Kulchytskyi2007) addresses only the situation in Soviet Ukraine (he also mentions the Kuban region in North Caucasus, but does not provide any data) and suggests that this increase was caused by two factors: (a) widespread searches of peasant’s homes looking for “hidden” and/or “stolen” grain, with requisitions of other food besides grain and, in many instances, practically all food (Boriak Reference Boriak2016; United States Commission on the UkrSSR Famine 1988); and (b) measures that prevented Ukrainian peasants from traveling to the RSFSR and Belarus SSR (BSSR) in search of food and directives that limited travel within Soviet Ukraine (Pyrih Reference Pyrih2007, 609–610, 615–617).
There are two problems with Kulchytskyi’s explanations of the 1933 surge in rural mortality in UkrSSR. First, these factors may explain the initial stage of this increase but, as we shall see, they do not adequately explain further sustained monthly increases until mid-1933. Second, the extent of searches for grain where all food was taken away has been questioned, as no document has been found that authorized the confiscation of all food during a search. Also, he does not address the possibility of such a mortality surge in RSFSR and other Soviet Republics.
Wheatcroft presents monthly patterns of crude death rates for the period 1932–1934 of the different regions in UkrSSR and RSFSR, but only provides a hypothesis for the high increase in monthly mortality in 1933 in the Kyiv oblast, and suggests reasons for the low mortality increases in the Donetsk oblast. No attempt is made to explain the monthly mortality increase in the other regions of Soviet Ukraine and RSFSR, as well as reasons for the differences among them.
As part of their analysis of Holodomor losses by oblast, Wolowyna et al. (Reference Wolowyna, Serhii, Nataliia Levchuk, Rudnytskyi, Kovbasiuk and Shevchuk2016) analyzed increases in 1933 monthly rural losses in four oblasts: Kyiv, Kharkiv, Odesa, and Dnipropetrovsk. Comparisons of these losses with the amount and timing of the food “assistance” provided during the first half of 1933 explain in part why yearly 1933 rural losses were much higher in Kyiv and Kharkiv than in Odesa and Dnipropetrovsk oblasts.
Our analysis has three objectives: (a) document and describe 1933 seasonal variations in rural registered and excess deaths in Soviet Ukraine and RSFSR and their regions; (b) evaluate the explanations for the 1933 surge in rural mortality in UkrSSR proposed by Kulchytskyi and Wheatcroft, and formulate a more comprehensive explanations applicable to both countries and their regions; and (c) provide evidence in support of the hypothesis that “they took away all the food” during searches of “hidden” grain based on an analysis of the monthly dynamics of relative losses. This is a first attempt at a comprehensive analysis of the surge in mortality during the first half of 1933 in UkrSSR and RSFSR and their regions.
Our analysis is limited to rural areas, as the 1932–1934 Famine dynamics is very different in urban areas and requires a separate analysis. We only analyze regions that experienced a substantive and monotonic increase in monthly rural losses during the first half of 1933. The following criteria were used to select these regions: (a) yearly 1933 losses of 30 per 1,000 population or higher and (b) sustained increase in monthly relative losses during the first half of 1933 with increases by a factor higher than three between January and the maximum monthly value in 1933. All seven oblasts of Soviet Ukraine satisfy these criteria, while the situation in RSFSR is more complicated. Of the 17 regions and three subregions analyzed by Levchuk et al. in this issue, only four regions (Central Black Earth oblast, Central Volga krai, Lower Volga krai, and North Caucasus krai) and two subregions (Saratov oblast in Lower Volga and Krasnodar krai in Northern Caucasus) satisfy these criteria. The Volga German ASSR also satisfies the first criteria (Levchuk et al., in this issue), but we were not able to analyze this subregion because 1933 mortality data are not available by month.
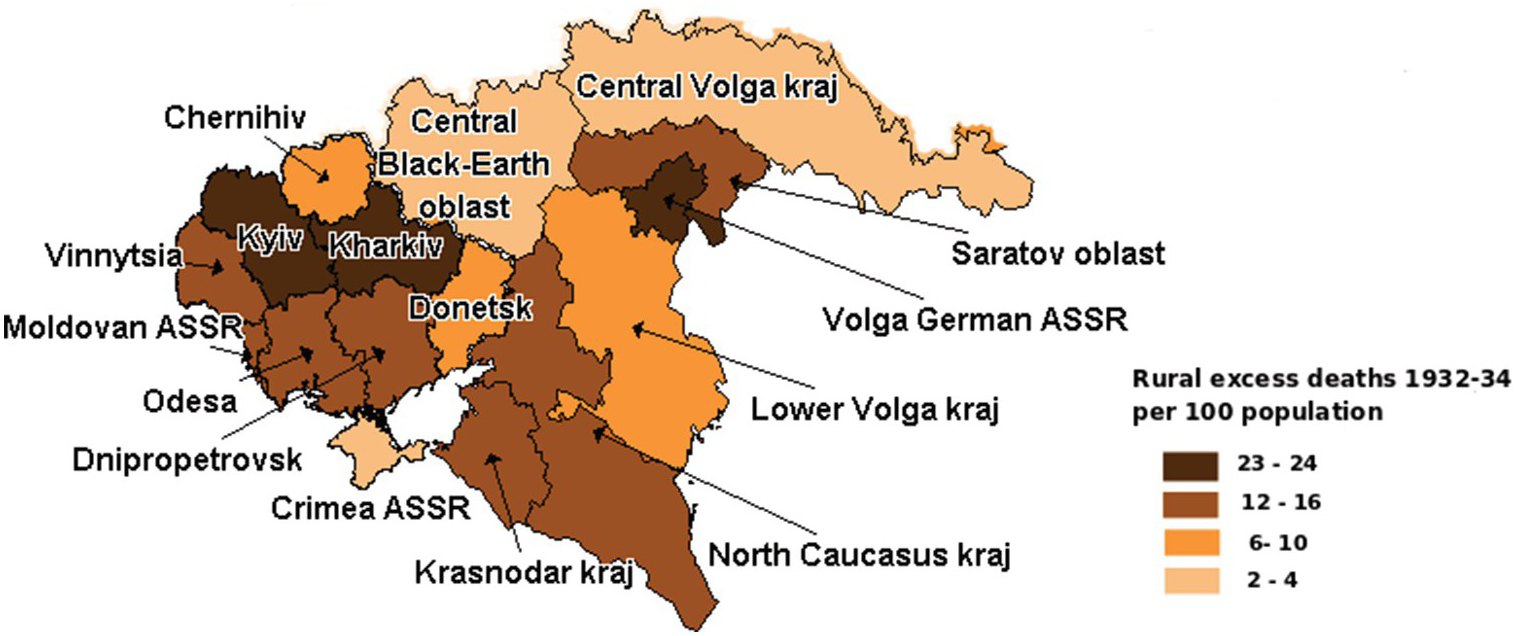
Estimates of monthly excess deaths are based on the monthly disaggregation of yearly losses in UkrSSR (Rudnytskyi et al. Reference Rudnytskyi, Nataliia, Oleh, Pavlo and Alla2015b) and its seven oblasts (Wolowyna et al. Reference Wolowyna, Serhii, Nataliia Levchuk, Rudnytskyi, Kovbasiuk and Shevchuk2016), and in RSFSR with the regions and subregions listed above (Levchuk et al., in this issue). We take these yearly losses as a given and do not dwell on the causes of these losses, as they have been analyzed in detail in these publications; our focus is on the dynamics of the monthly increases of losses during the first half of 1933. The map (Figure 1) provides background information for the analysis presented in this article. It shows the geographical location of the selected oblasts, regions, and subregions, and their levels of rural excess deaths for the 1932–1934 period, as percentages of the respective total 1933 rural populations. Kyiv and Kharkiv oblasts and the Volga German ASSR have the highest levels of relative losses, in the 23–24 percent range. Three oblasts—Vinnytsia, Odesa, and Dnipropetrovsk (and the Moldovan ASSR, see note 3), as well as Saratov oblast in Lower Volga krai and North Caucasus with its Krasnodar subregion have relative losses in the 12–16 percent range. Chernihiv and Donetsk oblasts and Lower Volga krai have losses in the 6–10 percent range and Central Black-Earth oblast and Central Volga krai (as well as the Crimea ASSR) have the lowest number of relative losses, in the 2–4 percent range. Moldova is not included in our analysis (see Note 3), and Crimea was not part of Soviet Ukraine during the Famine years.
The article is organized into the following sections: (a) analysis of monthly rural mortality in 1933 in terms of registered deaths; (b) limitations of Kulchytskyi’s explanation of the sudden and steady increase in monthly mortality in Soviet Ukraine and North Caucasus and a more comprehensive explanation of this increase; (c) independent support for the “all food was taken away” during searches for grain hypothesis; (d) detailed analysis of rural monthly losses in 1933; (e) effects of the food “assistance” program in 1933 on the monthly rate of increase of rural excess deaths in the different regions of UkrSSR and RSFSR; (f) factors affecting regional variations of the monthly increases of excess deaths; and (g) conclusions.
Map with the geographical location of the selected oblasts, regions, and subregions, and their levels of rural excess deaths for the 1932–1934 period.

Analysis of Monthly Registered Deaths in 1933
An examination of registered rural deaths shows that, compared to pre-Famine years, the seasonal structure and magnitude of deaths in 1933 shows two changes: (a) an extraordinary monthly sustained increase in number of deaths during the first half of the year and (b) a radical change in the yearly seasonal pattern of mortality.
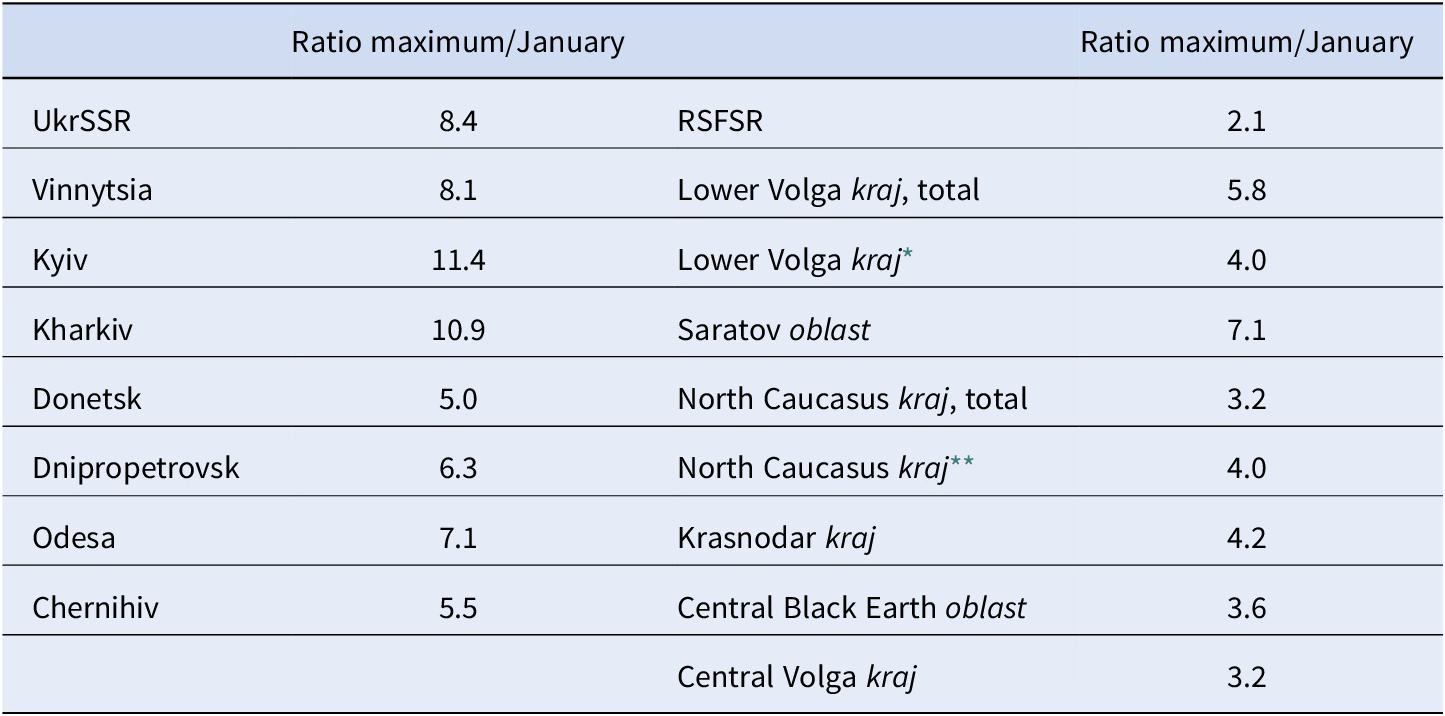
We estimate the overall rate of increase of registered deaths during the first half of 1933 by the ratio of the highest number of monthly deaths in that year and the number of deaths in January. Between January and June of 1933, the total number of registered rural deaths increased by a factor of 8.4 in UkrSSR and 2.1 in RSFSR (Table 1). At the subnational level, the months with the highest number of registered deaths varied between May and July for UkrSSR and between April and August for RSFSR. The rate of increase varied between five in Donetsk and 11.4 in Kyiv oblast in UkrSSR, and between 3.2 in North Caucasus and Central Volga krais, and 5.8 in Lower Volga krai in RSFSR. For the subregions in RSFSR, the ratio is 4.2 for Krasnodar krai and 7.1 for Saratov oblast. The two krais without their respective subregions, Lower Volga and Northern Caucasus, have ratios of four.Footnote 5
Ratios of maximum monthly values to January values for rural registered deaths by regions of UkrSSR and RSFSR, 1933

* Lower Volga without Saratov and Volga German ASSR.
** North Caucasus without Krasnodar.
Source: Authors’ calculations.
The following conclusions can be made from the data in Table 1. First, in spite of the very high level of under-registration of rural deaths in 1933 in UkrSSR (Rudnytskyi et al. Reference Rudnytskyi, Nataliia, Oleh, Pavlo and Alla2015b; Wolowyna et al. Reference Wolowyna, Serhii, Nataliia Levchuk, Rudnytskyi, Kovbasiuk and Shevchuk2016) and in RSFSR (Levchuk et al., in this issue), official registered deaths already show an extraordinary increase in rural mortality between January and the middle of 1933. Second, this increase is four times higher in Ukraine than in RSFSR. Third, large increases in rural mortality during the first half of 1933 are observed in all oblasts of Soviet Ukraine but only in one region and one subregion of RSFSR. Fourth, the range of the overall rate of increase among regions is much wider in UkrSSR than in RSFSR, between 5 and 11 and between 3 and 7, respectively. Fifth, upper values of these ratios in RSFSR, specifically Lower Volga krai (5.8) and Saratov oblast (7.1), are of a magnitude similar to the ratios in the lower range for oblasts in UkrSSR, Donetsk (5.0) and Odesa (7.1).
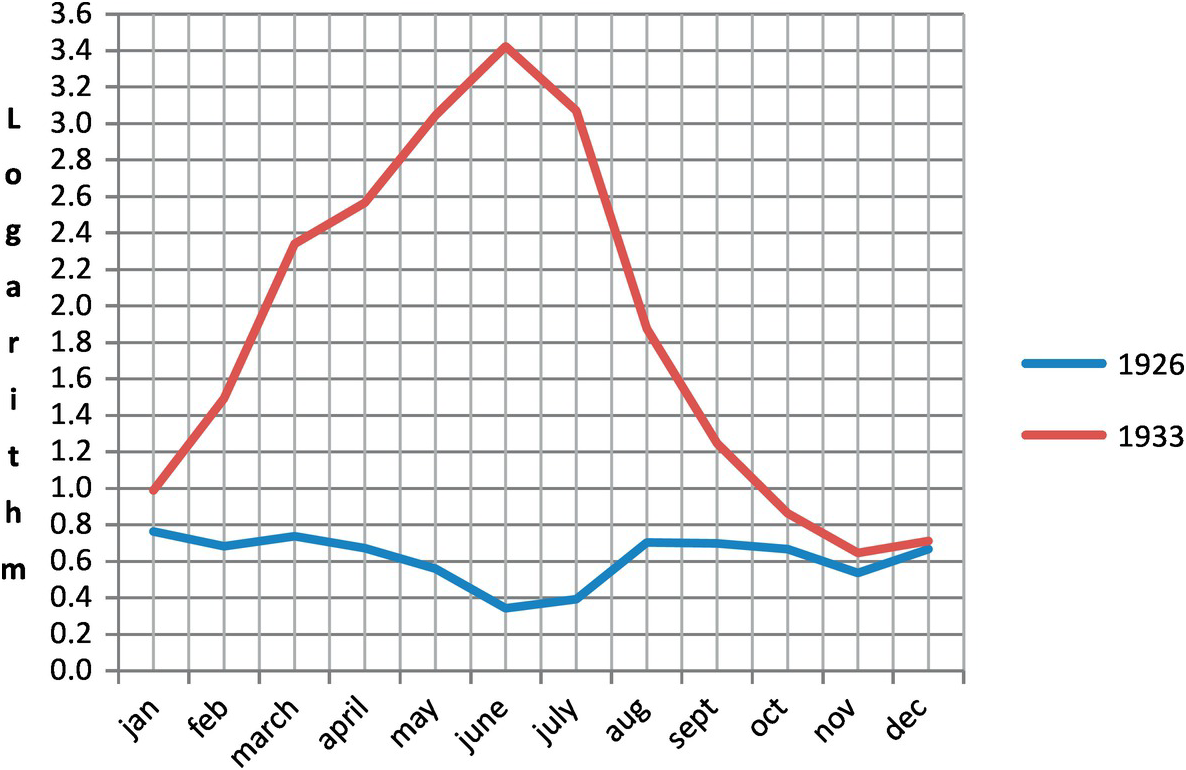
A second effect of the Famine is a radical change in the seasonal pattern of rural mortality. In “normal” times, this pattern usually reflects the relationship between the seasons and morbidity; the highest mortality is found toward the end of winter and the lowest in the middle of summer. In situations of extreme famine this pattern breaks down; a much stronger factor comes into play than the climatic factor—that is, acute scarcity of food. This is illustrated by comparing monthly patterns of rural registered deaths for 1926 and 1933 for Kyiv oblast in UkrSSR (we use the log of deaths in Figure 2 to reduce the graphic effect of the large differences in deaths between 1926 and 1933). The relative number of monthly registered rural deaths (per 100 population) is fairly constant during the first four to five months of 1926 and experiences a significant decline during the summer. In 1933, on the other hand, registered monthly rural deaths start with a steady monthly increase and reach their maximum value in June. Patterns similar to those in the Kyiv oblast in 1926 are found in all oblasts, regions, and subregions for all pre-famine years. The 1933 pattern for the Kyiv oblast is also replicated for the other oblasts and regions of RSFSR in that year. Thus, besides a surge in mortality during the first half of 1933, extreme famine conditions in early 1933 drastically changed the seasonal pattern of mortality found in pre-famine years.
Log of number of rural registered monthly deaths per 100 population: Kyiv oblast, 1926 and 1933.

Limitations of Kulchytskyi’s Explanation of the Sudden and Steady Increase in Monthly Losses in Soviet Ukraine and North Caucasus
As mentioned above, Kulchytskyi (Reference Kulchytskyi2007) proposes two factors responsible for the sudden increase in rural mortality during the first half of 1933 in Soviet Ukraine and Northern Caucasus: (a) increasingly larger numbers of households where all food was taken away during searches for “hidden” grain and (b) closing of the borders of Ukraine and Northern Caucasus, preventing peasants from these regions from traveling to other parts of RSFSR and Belarus SSR in search of food. A detailed analysis of the timeline of these two components shows that these two reasons are not sufficient for explaining the steady increase in monthly losses during the whole six-month period.
Kulchytskyi’s explanation is based on two documents and testimonies of surviving famine victims. The first document was Stalin’s January 1, 1933, telegram to the Central Committee of the Communist Party of UkrSSR suggests that the following be widely publicized across the country: (a) peasants and collective farms that voluntarily give back to the State stolen and hidden grain will not be punished; and (b) those collective farmers, collective farms, and private farmers who stubbornly insist on misappropriating and concealing grain will be subject to the strictest punitive measures provided by USSR Central Executive Committee resolution of August 7, 1932, “On the safekeeping of property of state enterprises, collective farms and cooperatives and strengthening pubic (socialist) property” (Pyrih Reference Pyrih2007, 282–283).
The second document was an order from January 22, 1933, that closed the borders of Soviet Ukraine and North Caucasus krai to prevent the mass flight of peasants from Soviet Ukraine and North Caucasus to RSFSR and Belarus SSR (BSSR) in search of food and, “after the filtration of counterrevolutionary element,” forcible return of the rest to their places of residence (Pyrih Reference Pyrih2007, 609–610). Tens of thousands of peasants from UkrSSR were arrested in different parts of RSFSR and BSSR, and most of them were returned to their places of residence (Pyrih 2012, 636). Also, thousands of Ukrainian peasants who traveled to Transcaucasia were arrested and forcibly deported by ship.
Although searches for hidden grain started in November 1932, Kulchytskyi (Reference Kulchytskyi2007, 302) suggests that Stalin’s telegram of January 1, 1933 was the causal factor in launching an extensive campaign of searches for grain. He argues that the only way to find out if there was hidden grain was by implementing extensive searches in collective farms and peasants’ homes.
Testimonies of thousands of Holodomor survivors attest that, during these searches, in many instances all other foodstuffs in addition to grain were taken away (Boriak Reference Boriak2016; United States Commission on the UkrSSR Famine 1988). Kulchytskyi states that the combined effect of these two factors condemned a significant segment of UkrSSR’s rural population to death by starvation and caused the sudden increase in mortality in early 1933.
Searches for hidden grain in UkrSSR and North Caucasus started in November 1932 and intensified in early 1933 (Pyrih Reference Pyrih2007, 388–397). The official end date for grain requisitions, January 1, 1933, was extended to February 6, as grain quotas had not been fulfilled by then, and the ban of traveling outside of UkrSSR and North Caucasus in search of food was implemented in early February. However, searches for grain did not end at the beginning of February. The decree of the Politburo of the Central Committee that extended the original deadline for ending grain requisition activities in UkrSSR from January 1 to early February also ordered to give priority to the recently started requisition campaign of seed grain, in parallel with grain procurement efforts (Pyrih Reference Pyrih2007, 624). The grain campaign was declared finished as of February 6, and all efforts were switched to requisitions of seed grain (Pyrih Reference Pyrih2007, 640). This means that searches for hidden grain continued during most of February and part of March, as grain quotas were still not fulfilled and seed grain quotas fared even worse. For example, searches for hidden grain were reported in early March in several regions of Dnipropetrovsk oblast (Pyrih Reference Pyrih2007, 741–742).
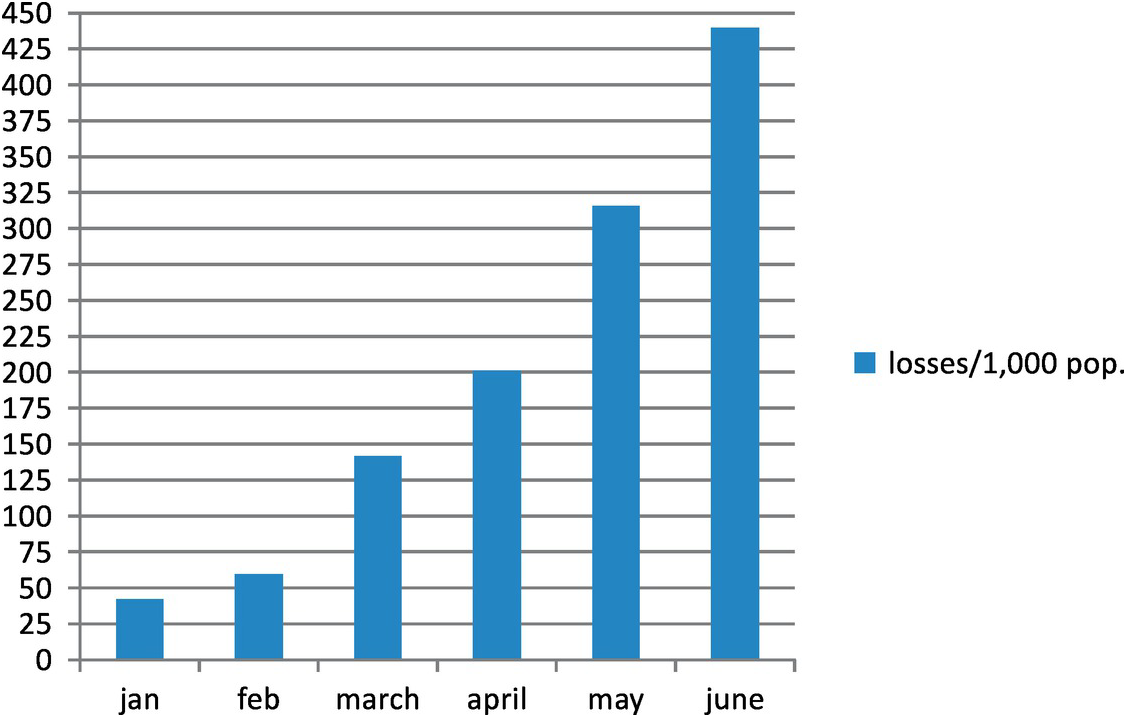
The two factors proposed by Kulchytskyi had different effects on mortality. The closure of borders was probably responsible for additional deaths during the whole six-month period, while the effect of the total confiscation of food during searches on Holodomor losses had probably run its course by, at most, the end of April 1933. Searches for grain stopped sometime in March, and many members of households with little or no food managed to survive at most a month. This means that starting in April, the rate of monthly growth in rural losses should have stabilized or slowed down, while it actually continued to increase until mid-1933 (Figure 3). Thus, Kulchytskyi’s explanation does not account for the further increase in losses until mid-1933, and other factors must have been responsible for this increase.Footnote 6
Monthly rural relative losses: UkrSSR, January–June 1933.

A key measure likely responsible for the continued growth of losses was the inclusion of three additional sources of grain to make up unfulfilled grain quotas: (a) grain set aside for seed for the next harvest; (b) grain fund set aside for emergency situations; and (c) grain paid to collective farmers for work previously performed that had to be returned if the collective farm did not fulfill its grain quota (Pyrih Reference Pyrih2007, 399). Extreme measures to fulfill the grain quotas depleted these grain funds, and efforts to fulfill the seed grain quotas depleted what was left.
The order to fill grain quotas with seed grain and emergency grain was reiterated by Kosior, Secretary of the Communist Party of UkrSSR, on December 24, 1932 (Pyrih Reference Pyrih2007, 521), and in a letter to members of Soviet Ukraine’s Politburo, he went out of his way to stress the importance of using seed grain to fulfill the grain quotas (Pyrih Reference Pyrih2007, 521, 579).
The seed grain requisition was resisted as much or more than the regular grain requisition (Pyrih Reference Pyrih2007, 636–639), as peasants were desperate to save some food in order to be able to survive the winter. For example, by February 15, 1933, only 35.6 percent of the seed quota was fulfilled in Kharkiv, and the campaign was widely resisted in the oblast (Pyrih Reference Pyrih2007, 697–698). Based on the experience of the grain procurement campaign, when the seed campaign was announced, Stalin recommended that the same (repressive) methods be used as for the grain campaign (Pyrih Reference Pyrih2007, 639–640).
Additional directives, applied mainly in Soviet Ukraine and North Caucasus, further aggravated the situation. First, collective farms that fulfilled their quotas were required to contribute more grain to make up the unfulfilled quotas of other collective farms. Second, they were forbidden to sell bread on their own in 1932. In some regions of RSFSR, collective farms were allowed to trade bread on their own starting in December 1932, while this was allowed in UkrSSR and North Caucasus starting only in March 1933. Third, on March 17, 1933, a directive from the Central Committee ordered the removal of all benefits from peasants in collective farms who left the farm without authorization, and to deny payment if they returned to the collective farm close to harvest time in order to “steal” government property, that is, food (see Levchuk et al., in this issue for more details about all these measures).
The implementation of the December 1932 directive to issue passports to urban residents was implemented first in April 1933 in large cities and gradually expanded to other cities. It was used to control travel of starving peasants to cities in search of food. Peasants and homeless children were rounded up and expelled from cities even before urban passports became prevalent (Pyrih Reference Pyrih2007, 836–838, 875–877). In some cases, local authorities implemented such restrictions on their own. The government of Kyiv oblast issued a directive on April 9, 1933 forbidding persons without a special permit to travel to the city of Kyiv from all rural and urban areas in the oblast (Kondrashin 2011–2012, 387).
As we shall see later, a further factor in the persistent increase in excess deaths was the selective distribution of food from the food “assistance” program during the sowing season of 1933. By distributing this food to the strongest and excluding the weakest, this program also contributed to further increases in mortality.
In sum, we suggest that a key factor responsible for the further increases of monthly losses beyond April was the requisition of seed grain and emergency grain funds to fulfill the grain quotas, implemented mainly in Soviet Ukraine and North Caucasus. These measures literally took away the ultimate safeguards for survival in extreme famine conditions. They totally depleted these special purpose reserves of grain, eliminating the possibility of last-resort relief in conditions of extreme famine, took away grain from collective farmers they received as pay for their work, and had a long-term effect with serious consequences beyond the initial surge of mortality in January. Although there were practically no searches for grain, and thus no confiscation of all food, in April, May, and June, the total depletion of seed and other reserve grains, as well as other measures listed above, caused the deaths of a large number of peasants who otherwise may have survived until June and then may have been saved with the arrival of the new harvest.
Analysis of Rural Monthly Losses in 1933
We have shown that registered deaths, with all their problems, already provide conclusive evidence about an extraordinary increase in rural mortality during the first half of 1933 in all oblasts of UkrSSR and in some regions of RSFSR. In this section we analyze in more detail the surge in rural mortality during the first half of 1933 in terms of monthly losses.
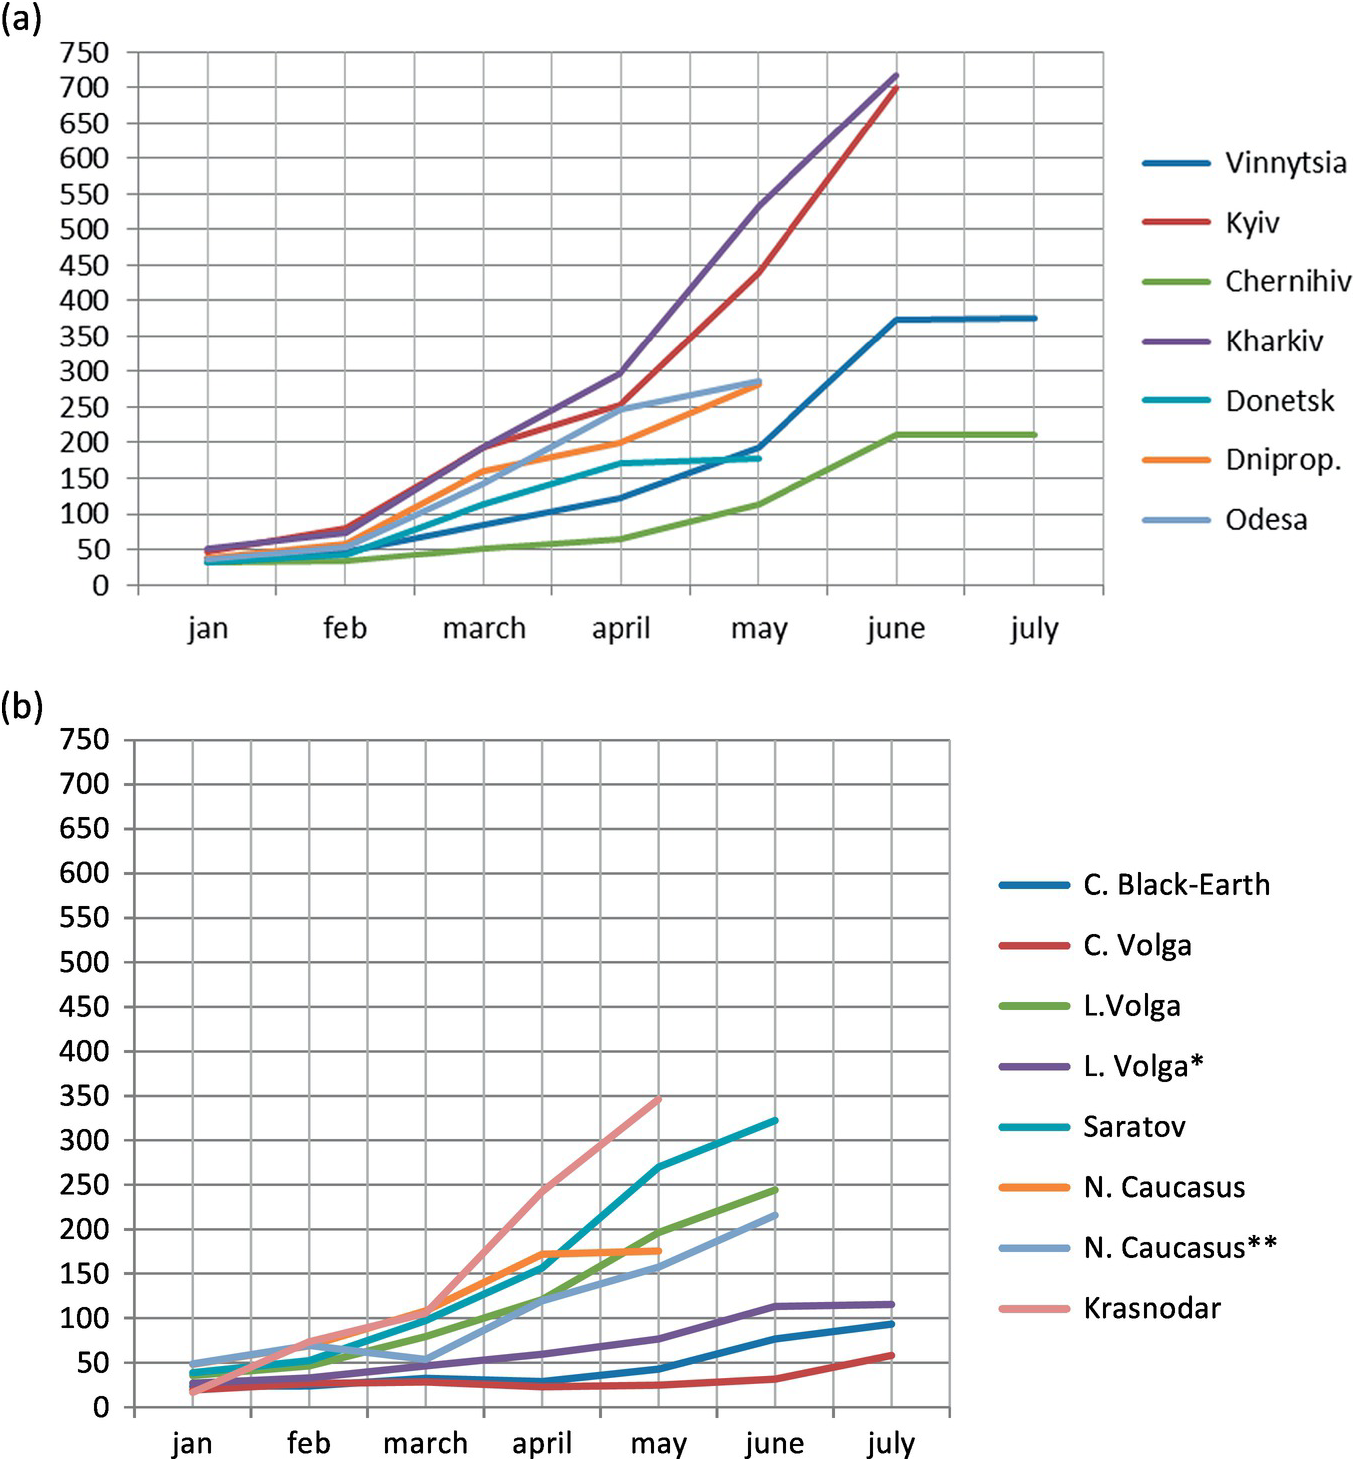
These losses are estimated by applying to 1933 yearly losses the monthly distribution of these losses. As no information is available that would allow us to estimate the distribution of monthly losses directly, we use an indirect approach. We take as our basis the monthly distribution of registered deaths in 1933 and make some adjustments to this distribution to obtain an estimation of the monthly distribution of losses for 1933. These adjustments consist of applying to the 1933 distribution of registered deaths deviations between the distributions of 1933 registered deaths and registered deaths for a non-crisis year like 1926. The estimation method is based on the assumption that the number of 1933 losses in a month is directly related to the number of registered deaths that month. Thus, the proportion of losses in early months with lower numbers of registered deaths is reduced, while the proportion of losses close to mid-year with higher numbers of registered deaths is increased. Figure 4a illustrates the 1933 monthly dynamics of relative losses (per 1,000 population) for the seven oblasts of UkrSSR. For each oblast, we graph the monthly relative losses from January to the month with the maximum rate: June for Kyiv and Kharkiv; May for Odesa, Donetsk, and Dnipropetrovsk; and July for Vinnytsia and Chernihiv.
(a) Monthly rural relative losses (per 1,000 population) for oblasts of UkrSSR, 1933. (b) Monthly rural relative losses (per 1,000) for selected regions of RSFSR, 1933. *Lower Volga without Saratov and German Volga ASSR. **North Caucasus without Krasnodar and Four Autonomous Republics.

Kyiv and Kharkiv have similar and very high rates of growth or slope. Odesa, Dnipropetrovsk, and Donetsk have intermediate slopes, and Vinnytsia and Chernihiv have the lowest slopes during the first five months, with a big increase in June and a very small increase in July. In the second group of oblasts, Odesa and Dnipropetrovsk have very similar monthly values, while the values for Donetsk are consistently lower. The slopes of the second and third group of oblasts are determined to a certain degree by the month of the maximum value. The maximum values for the three oblasts with intermediate slopes peak early, in May, forcing a faster monthly growth. Later peaks in July for Vinnytsia and Chernihiv provide more time to reach the maximum value. Figure 4b presents the 1933 monthly dynamics of relative rural losses for the regions and subregions of RSFSR. Besides the monthly rates for the four regions and two subregions, we also plot the monthly rates of the two regions without their respective subregions: Lower Volga without Saratov and the German Volga ASSR, and North Caucasus without Krasnodar. The regions and subregions can be classified into three groups: (a) Krasnodar all by itself with the highest slope; b) Saratov, North Caucasus, and North Caucasus without Krasnodar and Lower Volga with intermediate slopes; and (c) Lower Volga (without Saratov and the German Volga ASSR), Central Black-Earth, and Central Volga with much lower slopes.
The graph (Figure 4b) shows a rather complex picture of the monthly growth of relative losses among regions and subregions of RSFSR. At one end we have Krasnodar krai with the highest rate of monthly growth, while at the other end we have Central Volga, Central Black-Earth, and Lower Volga (without Saratov and the Volga German ASSR) with very low rates of growth. The low slope in Lower Volga without Saratov and the Volga German ASSR is probably an indication that losses in Lower Volga outside of these two subregions had low monthly growth.
The fact that the slope in North Caucasus krai without Krasnodar is only modestly lower than the slope for the whole krai shows that monthly losses in North Caucasus were also growing at a substantial rate outside of Krasnodar. The graph also shows that North Caucasus and Krasnodar reached their maximum values earlier than the other regions. This is consistent with the fact that repression activities started earlier in North Caucasus than in UkrSSR and other regions of RSFSR (Levchuk et al., in this issue).
The following conclusions can be made in comparing Figures 4a and 4b. First, the range of regional slopes is larger in Soviet Ukraine than in RSFSR. Second, slopes in UkrSSR are, on the average, higher than in RSFSR. Third, two regions and one region without a subregion in RSFSR have very small slopes compared to the other regions.
Kuban is consistently mentioned in the literature as the region in North Caucasus mostly affected by the Famine, mainly due to repressions of the large number of Ukrainians residing there. Thus, it may seem surprising that we analyze Krasnodar as a subregion of North Caucasus instead of Kuban. Due to frequent changes in the administrative structure of RSFSR, it was impossible to define Kuban as a stable region for the whole 1926–1939 period, and Krasnodar is used as an approximation to Kuban. (This problem is described in detail in Levchuk et al., in this issue).
Two alternative explanations have been suggested for the high levels of mortality in Kyiv and Kharkiv oblasts in 1933. Mark Tolts (personal communication) suggests that the oblasts with the two large cities of Kyiv and Kharkiv had more forms for registering deaths. This resulted in more registered deaths and thus higher losses in these two oblasts.
Data in the form итоги регистрации актов гражданского состояния [results of civil registration] for 1933 (RSAE) allow us to verify this hypothesis. The form registers, for each oblast and by rural and urban areas, the number of ZAG (civil registration offices) offices that sent each month their reports to the central office, and includes the total number of ZAG offices in each oblast. This allows us to calculate the percent of ZAG offices reporting each month. If many of the ZAG offices in Kyiv and Kharkiv oblasts had proportionally more forms than ZAG offices in other oblasts, one would expect that they would have lower percentages of ZAGs not reporting than the other oblasts. The data do not support this expectation, as two oblasts, Vinnytsia and Odesa, have consistently much lower percentages of nonreporting each month than Kyiv and Kharkiv oblasts.
Wheatcroft and Garnaut (Reference Wheatcroft and Garnaut2013, 389–390) suggest the following hypothesis for the high mortality in Kyiv oblast during the first half of 1933. The unfulfillment of the 1931–1932 grain quotas in UkrSSR forced the Soviet government to lower the central food allocations to urban areas and change their distribution among cities. For example, industrial cities in Donetsk oblast were protected, that is, received more food, at the expense of non-industrial cities in Kyiv oblast. After the campaign for grain collection was stopped in February of 1933, the central food allocation for the urban population of Kyiv oblast was significantly reduced, and the oblast government was forced to start collecting grain from its rural areas, condemning its inhabitants to starvation, in order to feed its urban population.
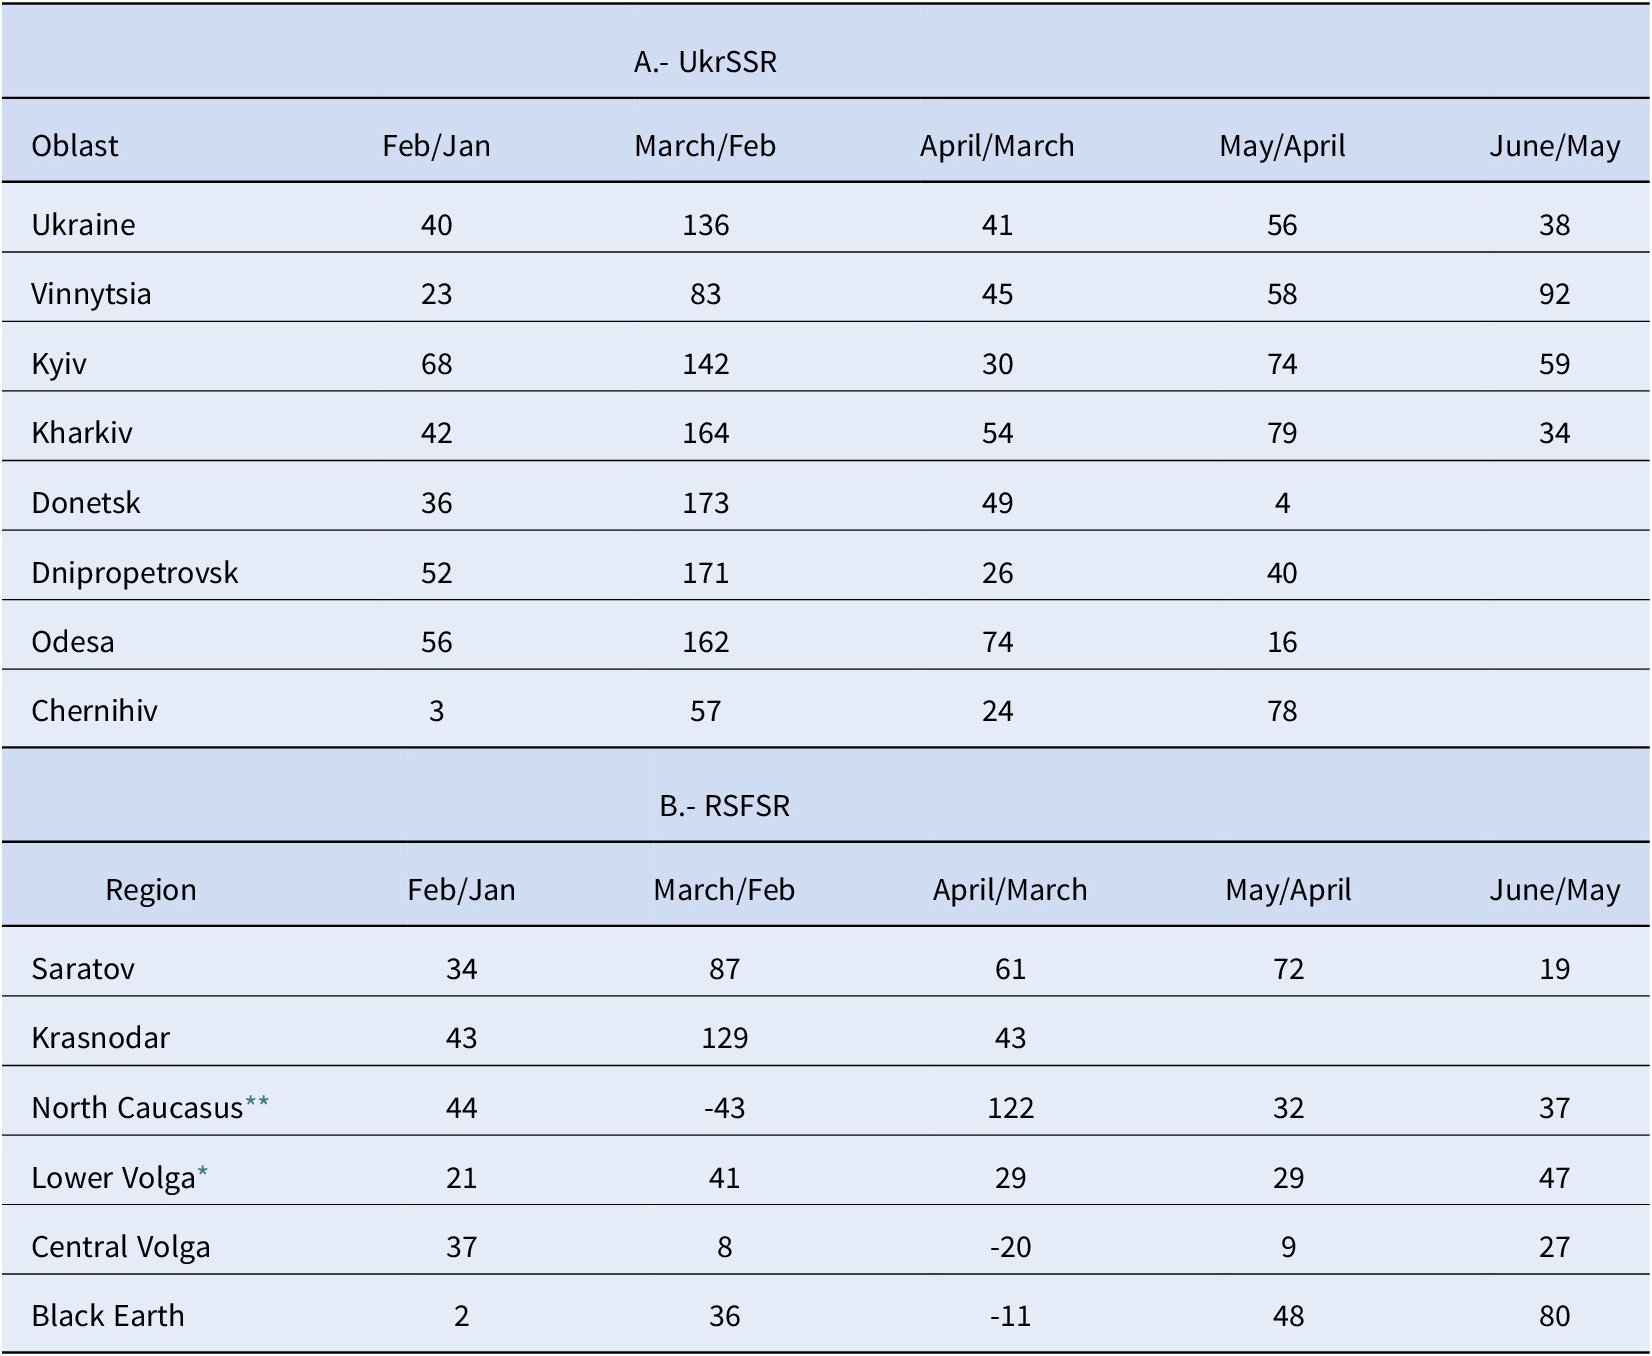
There are several problems with this hypothesis. First, it is difficult to believe that this change in policy in the Kyiv oblast had such a sudden and drastic effect on mortality, as reflected in relative monthly losses, from a 68 percent increase in relative losses between January and February to a 142 percent increase from February to March, and then a sudden drop in subsequent months to a more normal level until the harvest in July (see Table 2). Second, the Kharkiv oblast had as high levels of losses as Kyiv in 1933, both in terms of yearly and monthly relative losses, but Wheatcroft and Garneau do not provide an explanation for this. This hypothesis has countrywide implications, and a more comprehensive elaboration of this hypothesis, besides a comparison of only the Kyiv and Donetsk oblasts, would be in order. Third, although the redistribution of central grain funds among urban areas may have affected rural mortality in some oblasts, there is no justification for ignoring or dismissing the possible effects of such well documented directives like the closing of borders with RSFSR and BSSR and the confiscation of all food during many searches.
Month-to-month changes in rural relative losses by oblasts in UkrSSR and regions in RSFSR: January–June 1933.

* Lower Volga without Saratov and Volga German ASSR.
** North Caucasus without Krasnodar.
Source: Authors’ calculations.
The “They Took Away All the Food” Hypothesis
Several criticisms can be raised about this hypothesis. First, the survivors claiming that all food was taken away during searches of grain are not representative of all searched households. Second, it is impossible to estimate the proportion of rural households where all food was taken away. Third, the statement “they took all the food” is subjective and impossible to quantify in the aggregate. Fourth, no official document about the implementation of this practice has been found, along the lines of the decree about fines in kind (Pyrih Reference Pyrih2007, 388–395). Thus, the only way to validate and quantify this hypothesis is by indirect methods. We show that a detailed analysis of the monthly dynamics of losses in Ukraine and Krasnodar may provide independent evidence supporting this hypothesis for these areas.
Table 2 shows relative increases in the monthly rates of losses between January and June of 1933 for UkrSSR and its seven oblasts, and selected regions and subregions of RSFSR. These ratios, relative losses for one month divided by relative losses for the previous month, measure the relative changes in excess deaths from one month to the next.
We observe the following patterns in five of the seven oblasts of UkrSSR: the February/January ratios fluctuate around 50 percent, the March/February ratios jump to the 150–170 percent range, and then ratios for the other months revert to values similar to the February/January ratios. That is, the magnitude of the March/February ratios is larger by a factor of about three, compared with all the other ratios. The March/February ratios for Vinnytesia and Chernihiv oblasts are smaller because of special circumstances. In the case of Vinnytsia, Western parts of the oblasts had lower losses due to special programs for this international border. There was little grain grown in Chernihiv oblast and thus no need for extensive searches for hidden grain (see Wolowyna et al. Reference Wolowyna, Serhii, Nataliia Levchuk, Rudnytskyi, Kovbasiuk and Shevchuk2016, for a detailed explanation).
One possible interpretation of the patterns in the five oblasts is as follows. The extraordinary increase in relative losses from February to March is due to the fact that the effect of the confiscation of all food reached its maximum in March. Searches for grain, and thus confiscation of all food in many cases, stopped in February and the effect of no food in a household on losses ran its course in early April. This explains the sudden drop in the relative monthly increases for the following months. This pattern is consistent with the hypothesis that the confiscation of all food during searches for grain is one of the causes for the sudden increase in losses during the early months of 1933.
In RSFSR, Krasnodar is the only region with a similar pattern of monthly ratios to those found in the five oblasts of UkrSSR. It is no coincidence that Krasnodar is also the only region in RSFSR with similar experiences to Soviet Ukraine, such as closing of borders and testimonies about extensive searches with the confiscation of all food in many households. The other regions of RSFSR do not exhibit the pattern of ratios found in Krasnodar, and there are no testimonies about searches where all food was taken away.
This result, arrived at by a strictly demographic analysis, can be interpreted as independent support of the “they took away all the food” hypothesis, and provides more solid confirmation of this hypothesis than the testimony of an unrepresentative sample of Holodomor survivors.
Factors Affecting the Monthly Increase in Excess Deaths in 1933 at the Regional Level
The sudden and sustained increases in monthly losses during the first half of 1933 in all oblasts of the UkrSSR and some regions of the RSFSR poses several questions: (1) What differentiates the regions with these increases from regions without these increases? (2) What were the causes of this surge in mortality? (3) Which factors affected the magnitude of these increases?
Monthly increases during the first half of 1933 are associated with a certain level of yearly losses. Analysis of monthly losses in oblasts of UkrSSR and regions of RSFSR shows that these increases are found only in regions with yearly losses of more than 30 per 1,000 population; in other words, these sudden short-term increases occur only when the magnitude of yearly losses reaches a certain level. This answers the first question.
In a previous section we provided a comprehensive answer to the second question. The third question deals with the variation in the slope of this increase among the different regions. Levchuk et al. (in this issue) list three factors responsible for the yearly levels of losses: grain procurement plans and implementation, peasant resistance and repressions, and the “nationality factor.” Grain procurements affected mainly the level of losses, while our focus is on the monthly pattern of losses. We show that there is a relationship between the slope of these increases and the following four factors: confiscation of all food, closing of borders, levels of resistance and repressions, and the nationality factor.
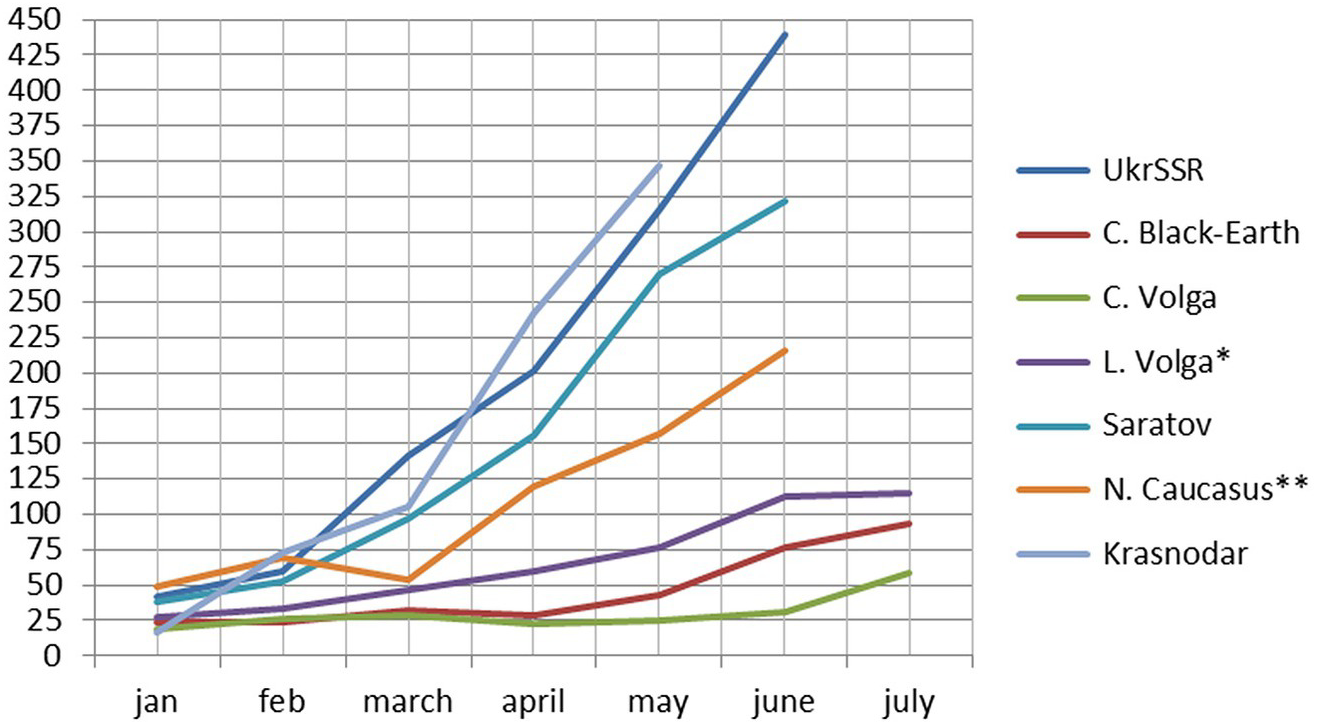
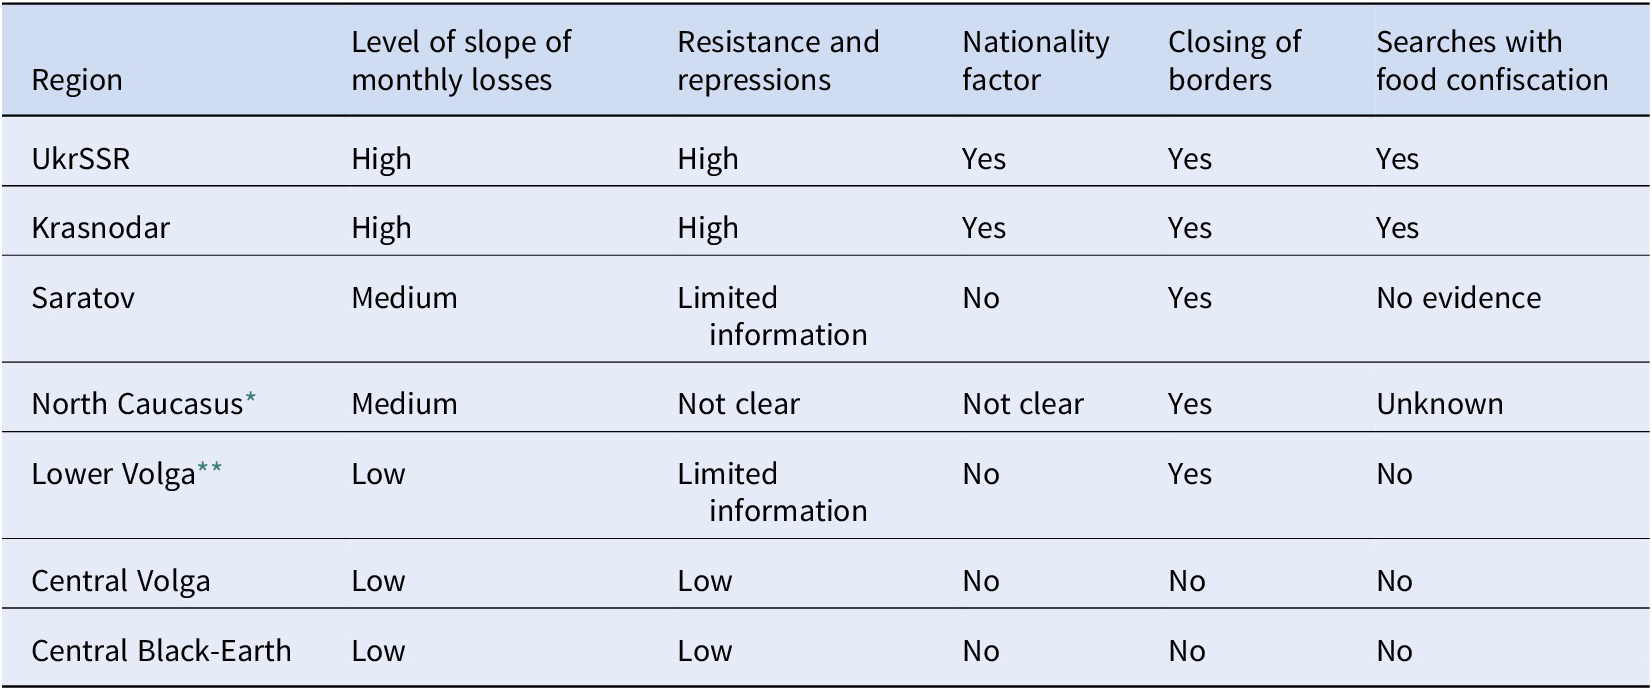
Table 3 is an attempt to summarize the relationship between the slope of the monthly losses and the four factors mentioned above. In order to simplify the table, we present data for UkrSSR without its oblast and the regions of North Caucasus and Lower Volga divided into two parts each: (a) Krasnodar and the rest of North Caucasus; and (b) Saratov and Lower Volga without Saratov and the Volga German ASSR. The seven regions in the table are classified into three groups, according to the level of their slope of monthly losses: high, medium, and low. This classification is based on Figure 5, which graphs the relative monthly losses for these seven regions.
Monthly rural relative losses (per 1,000) for UkrSSR and selected regions of RSFSR, 1933. *Lower Volga without Saratov and German Volga ASSR. **North Caucasus without Krasnodar.

Relationship between level of 1933 monthly growth of rural losses and different factors: UkrSSR and regions of RSFSR.

* Lower Volga without Saratov and Volga German ASSR.
** North Caucasus without Krasnodar.
Table 3 represents a model where the slope of the monthly losses is the dependent variable and the four factors are independent variables related to the slope. It shows for each region the presence or absence of the four factors. In the two regions with high slopes, three of the four factors are present, and the regions experienced high levels of resistance and repressions. In the three regions with low slope, three of the four factors are absent and there is no evidence of strong resistance and repressions in these regions.
The relationship for Saratov and North Caucasus without Krasnodar, regions with medium slope, is less straightforward mainly due to incomplete data. Only one factor, closing of borders, is present in both regions. There is no or little evidence of large numbers of households where all food was taken away during searches for grain, and more research is needed to determine the extent of resistance and repression in Saratov and North Caucasus outside of Krasnodar.
The nationality factor presents a more complex picture. Krasnodar and the Volga German ASSR satisfy the classical definition of nationality factor: high percentage of Ukrainians in the first case and high percent of Germans in the second case. Saratov, on the other hand, was 80 percent Russian in 1926 and experienced high levels of losses. This would indicate that the nationality factor may not be a necessary condition for high losses.Footnote 7
We have shown that, in general, the higher the slope the stronger its relationship with the four factors. This relationship seems to hold for regions with high- and medium-level slopes, but does not hold for Central Volga and Central Black-Earth, as three of the four factors are absent, and the fourth factor, resistance and repressions, is probably of much lower intensity compared to the other regions. This poses the question, what accounts for the monthly increases in losses in these two regions?
The answer may lie in the model proposed by Bongaarts and Cain (Reference Bongaarts, Cain and Cahill1981, 44–45):
During the famine period itself the death rate rises, slowly in the first weeks and then more rapidly as reserves are depleted and resistance to diseases declines…. [This increase] can be expected during and immediately following a moderately severe famine of approximately half a year’s duration with a well demarcated beginning an end…. Maximum mortality is observed at the end of the famine, when the death rate can reach levels several times higher than usual.
It should be noted that this model is based on the experience of developing countries and famines caused mainly by climatic factors. The 1932–1934 Famine, on the other hand, was a manmade famine; the key causal factors were government actions, and climatic factors played a minor role.
The Bongaarts–Cain model (Bongaarts and Cain 1981) suggests the following modifications to the model proposed in Table 3 (a) it is possible to have sudden and sustained increases in mortality during a famine determined solely by biological factors, but only when the level of the slope is low; (b) biological factors are present in all cases with sudden and sustained increase in mortality levels; and (c) increases with a slope above a certain maximum determined by biological factors require the presence of at least some of the other four factors. It would be useful to have some idea about this maximum, but we are not aware of any research about this.
Food assistance indicators for UkrSSR and four regions of RSFSR.

* per 1,000 population.
Source: Perih (2007), Kondrashyn (2012), and authors’ calculations.
In the next section we discuss an additional factor, the food “assistance” program in 1933, which we show has also an effect on the slope. If we add biological factors and the effect of the food assistance program, we have the outline of an explanatory model for the regional variations in monthly rates of growth of losses.
The 1933 Food Aid Program
Once Moscow realized the catastrophic consequences of the Famine toward the end of 1932, a program of “assistance” to UkrSSR and several regions of RSFR affected by the Famine was implemented during the first half of 1933, consisting of three components: food (mostly grain), seed grain for the 1933 harvest, and fodder. We focus here on the food component, as it is directly related to excess deaths.
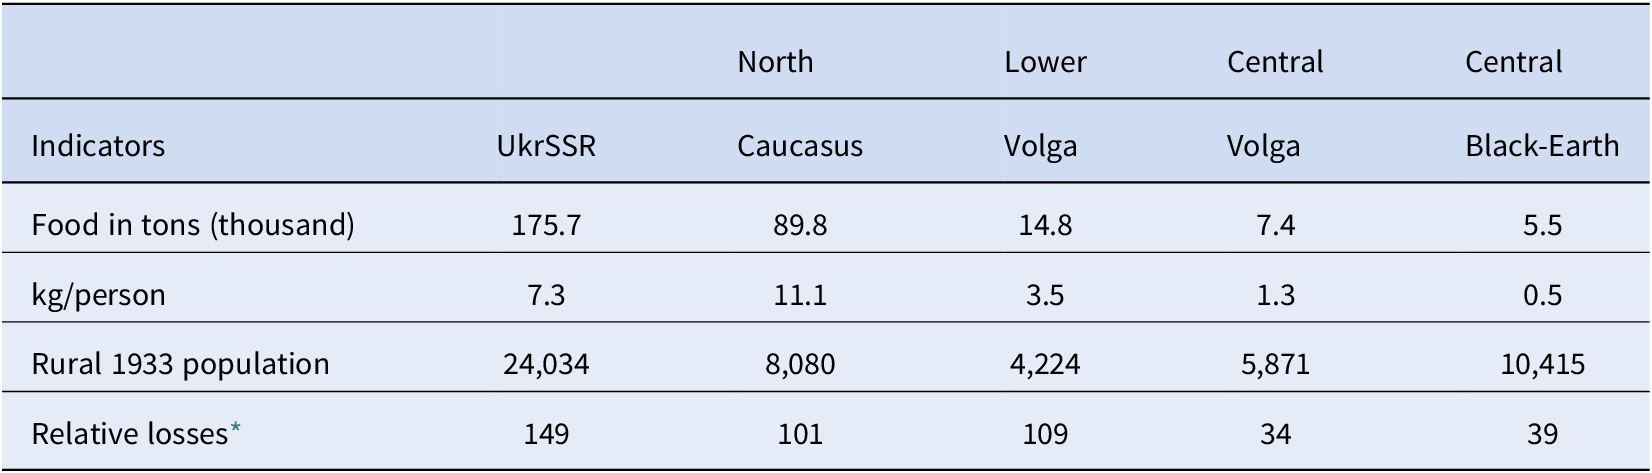
Soviet Ukraine received the largest amount of food, 175.7 thousand tons, followed by North Caucasus with 89.8 thousand tons; the other three regions received significantly less food (Table 4). Given the large variation in rural population size among the different regions, it is misleading to use amount of food as an indicator food aid for comparative purposes. A more valid indicator is amount of food standardized by rural population size. This indicator (kg/person) shows that actually North Caucasus krai received proportionally the largest amount of food, 11.1 kg/person, followed by UkrSSR with 7.3 kg/person. The relative amounts were much smaller for the other three regions in RSFSR.
The fact that Soviet Ukraine received the largest amount of food does not necessarily mean that Stalin treated UkrSSR more favorably than the other regions (Kondrashin Reference Wheatcroft and Kondrashyn2013). It seems that the criteria for deciding on the amount of food to be allocated to a region were guided more by the potential of grain production and the gravity of the Famine in the region than by political considerations. This is further corroborated by the amount of seed grain given as part of the program, compared to the amount of food component of the program (Table 5).
Amount of food and seed grain distributed in UkrSSR and regions of RSFSR: February–July 1933 (thousand tons).

Source: Davis and Wheatcroft (Reference Wheatcroft2009, 479–486).
Overall, the total amount of seed grain was four times the total amount of food. This ratio was almost two in UkrSSR and more than three in North Caucasus. The high seed/food ratios for Lower Volga and the other regions of RSFSR are due to the fact that the amount of food assistance in these regions was small. Soviet Ukraine and North Caucasus received large amounts of seed grain for two reasons: (a) they were the main grain-producing regions; and (b) their seed grain reserves were depleted in 1932 to compensate for the deficit in grain procurement.
Before analyzing the effects of the food program on the monthly relative losses, it is important to clarify its nature and purpose. First, this program, labeled “food assistance,” does not qualify as assistance in the usual meaning of the word; it was a loan to be repaid from the next harvest at a ten percent interest, to cover costs of “administration and transportation.” Second, food was also distributed in UkrSSR and several regions of RSFSR in 1932, mainly from local sources. The food distributed in 1933, on the other hand, came mainly from central sources, as local sources were basically depleted by then, especially in UkrSSR and North Caucasus. Thus, the food provided in 1933 was previously taken away from peasants and then partially given back to them a year later. Third, there were clear instructions on who should receive this food, as illustrated by the following examples.
The Vinnytsia regional party committee instructed the district committees on April 29, 1933, as follows (Davies and Wheatcroft Reference Davies and Wheatcroft2009, 220): “This assistance is provided for specific purposes, and is mainly directed to securing the successful achievement of the Spring sowing. Therefore, among the collective farmers and individual peasants who are really needy, this assistance must be provided primarily to those who conscientiously participate in the Spring campaign.” A second report from the Kyiv region dated June 3 contains the following recommendation (Davies and Wheatcroft Reference Davies and Wheatcroft2009, 220–221): “Organize the differential feeding of different groups, permitting increased feeding of those who need to begin work, and supporting those who have already started work for a certain time with an increased ration in order to avoid recidivism; assistance should be ceased for those who, after receiving state help, refuse to work.”
A recommendation on what to do with peasants in the Kyiv region who had been sent to hospitals with complications due to starvation, dated March 31, 1933, reads (Davis and Wheatcroft Reference Davies and Wheatcroft2009, 220): “Divide all those hospitalized into sick and improving, and considerably increase the food for the latter so that they can be released for work as quickly as possible.” Thus, the main objective of this food “assistance” program was not to save people from starvation, but (a) to make sure that there were enough peasants alive and able to work on the next harvest; and (b) to impress on surviving peasants that the only way to stay alive was to join the collective farm and work for the State.
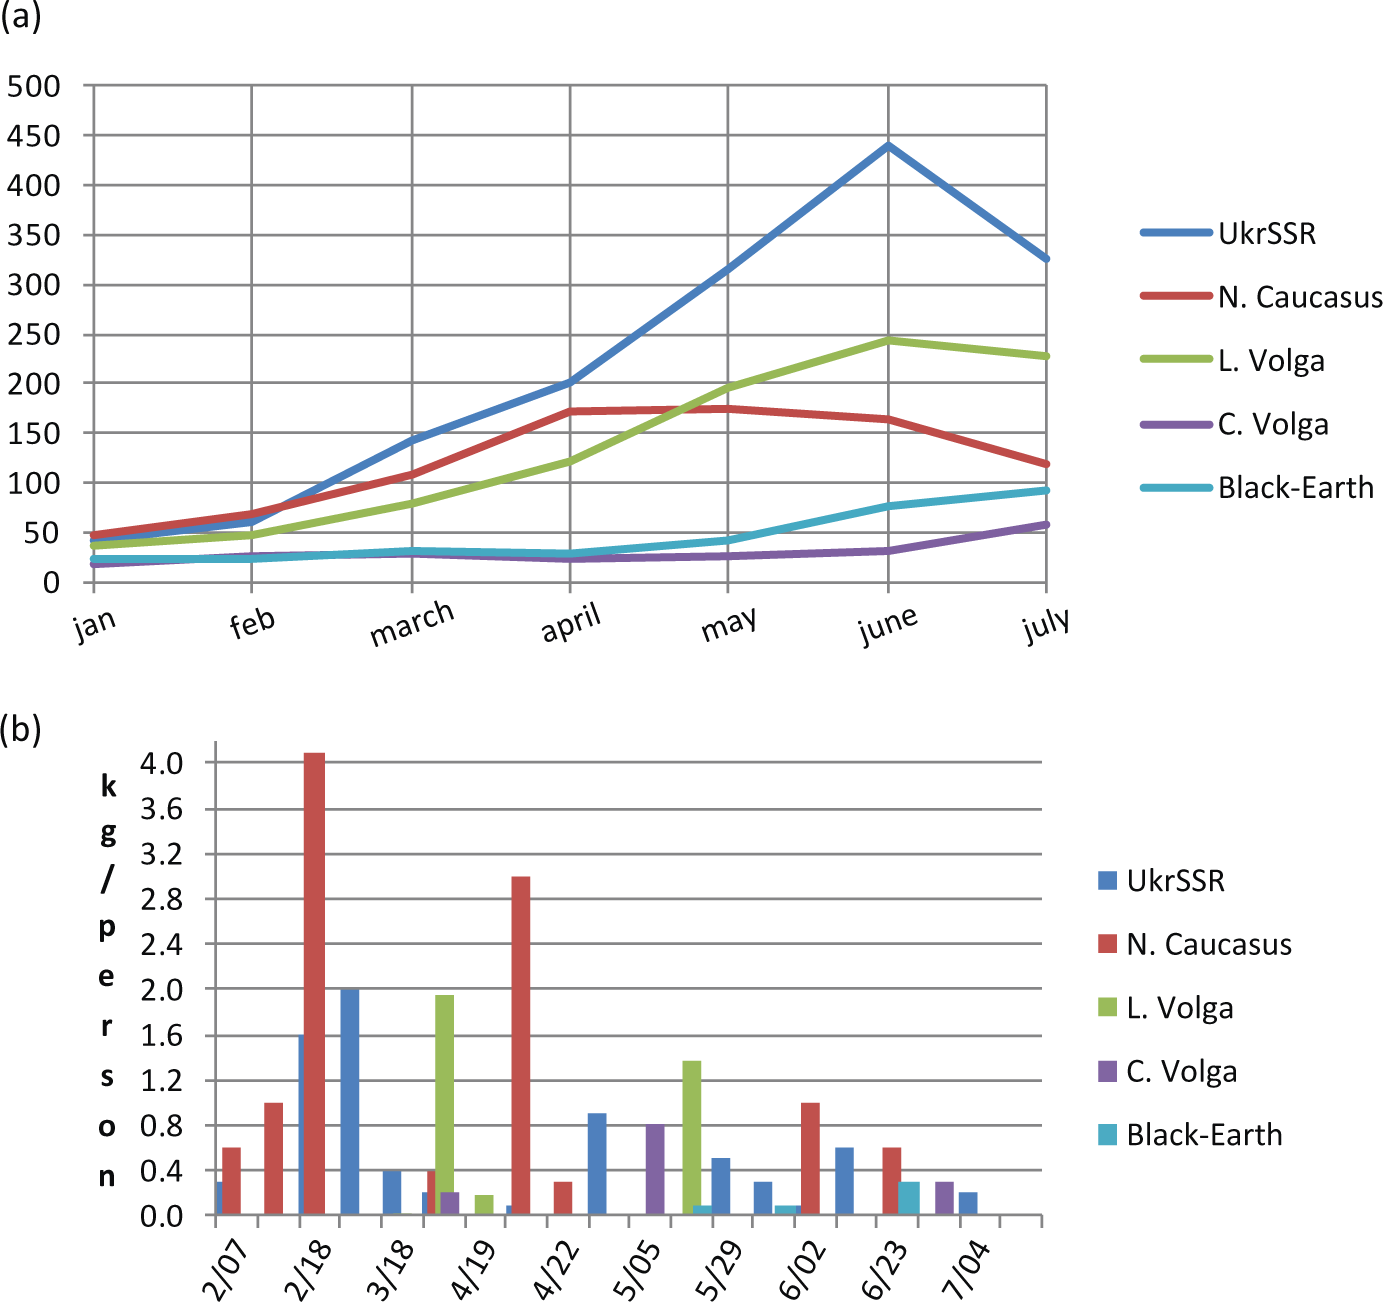
An important question is to what extent the food program affected the dynamics of monthly Famine losses in Soviet Ukraine and RSFSR as a whole, and in different regions of both Republics. Wolowyna et al. (Reference Wolowyna, Serhii, Nataliia Levchuk, Rudnytskyi, Kovbasiuk and Shevchuk2016) have shown that the food program affected the monthly distribution of rural 1933 losses in four oblasts of UkrSSR: Kyiv, Kharkiv, Odesa, and Dnipropetrovsk. Data on the food program are not available for the three subregions in RSFSR, and we cannot analyze the relationship between the monthly dynamic of losses and the food program in RSFSR in as much detail as in Soviet Ukraine, such as by oblast. Thus, we analyze this relationship in four regions of RSFSR and Soviet Ukraine as a whole. The analysis is done by aligning the monthly distribution of relative losses in these five geographical units with the respective schedules of food distribution during February–July 1933 (Figures 6a and 6b). We see that there is a direct relationship between the amount and timing of the food provided to a region and its pattern of monthly relative losses. The large amount of food sent to North Caucasus in February followed by a sizeable shipment in April is likely to have played an important role in halting the increase of losses by April and producing a decrease after that month. The amount of food sent to Soviet Ukraine was smaller in relative terms and started later than the food sent to North Caucasus; very little food was sent after April. This may explain to some degree the steeper slope of monthly excess deaths in UkrSSR compared to North Caucasus between February and April. The small amounts of food sent to Ukraine after April were not sufficient to affect the rapid increase in losses between April and June. The two significant allotments to Lower Volga in late March and late May could be related to the slowdown in rates between March and April and the slight decrease in the rate of growth in May. The food assistance to Central Volga and Central Black-Earth was too small to have a significant impact on the monthly patterns of excess deaths in these regions.
Monthly standardized rural losses (per 1,000 rural population) and schedule of food assistance in kg per rural inhabitant, for UkrSSR and four grain-growing regions in RSFSR, January–June, 1933. Source: Kondrashyn (2011–2012) and authors’ calculations.

In spite of this food “assistance,” people kept dying at an alarmingly increasing rate, especially in UkrSSR and North Caucasus, as well as in Lower Volga. Although apparently a large amount of food was distributed in these regions, its effect was very limited for three reasons: (a) 11.1 kg/person in North Caucasus, 7.3 kg/person in UkrSSR, and 3.5 kg/person in Lower Volga for a period of six months was totally insufficientFootnote 8; (b) most of the grain did not consist of the main two food grains (rye and wheat), but of grains normally used for fodder or for special purposes (Davies and Wheatcroft Reference Davies and Wheatcroft2009, 218); and (c) as documented above, criteria for the distribution of the food were political and economic, not humanitarian.
We have shown that the amount and timing of the food “assistance” provided during the first half of 1933 are important factors in explaining the different rates of relative monthly growth of losses in UkrSSR and regions of RSFSR seriously affected by the Famine.
Conclusions
Two shortcomings of research on Holodomor have been: (a) paucity of comparative research on the effects of the 1932–1934 Famine in Soviet Ukraine and other parts of the Soviet Union and (b) relatively little attention paid to the fact that in all oblasts of UkrSSR and several regions of RSFSR, there was a surge in rural mortality during the first half of 1933, and the majority of all 1932–1934 rural losses were concentrated in that period. The first shortcoming has been addressed by Rudnytskyi et al. (Reference Rudnytskyi, Nataliia, Oleh, Pavlo, Curran, Luciuk and Newby2015a) and Levchuk et al. (in this issue); the second is analyzed in this article. This is the first detailed comparative UkrSSR–RSFSR analysis of this important characteristic of the Famine at the Republic and regional levels. Possible causal factors for this surge are listed, and a model for explaining the regional variations in this surge is proposed. Two shortcomings in previous explanations regarding the surge in mortality during the first half of 1933 are addressed. Original explanations of this mortality surge are shown to be insufficient, and a more comprehensive explanation is proposed. Critiques of the “they took away all the food” hypothesis are addressed by proposing new evidence in support of this hypothesis, based on an analysis of the monthly dynamics of losses.
Several of our results underline the importance of comparative research of the 1932–1934 Famine. First, we show that the Famine affected all of Ukraine, not only in terms of level of losses but also in terms of extraordinary increases in mortality during the first half of 1933. Second, this surge in mortality is also found in RSFSR, but only in a few regions and with less intensity. Third, we show that the presence of the “nationality factor,” meaning minority nationalities in the Soviet Union, may not be a necessary condition for an extraordinary mortality increase. Saratov, with a predominantly Russian population, also experienced a sudden increase in mortality during the first half of 1933.
There are two main perspectives on the 1932–1934 Famine: “manmade by accident” and “manmade on purpose” (Wheatcroft Reference Wheatcroft2018; see also Graziosi Reference Graziosi and Hryn2008). The first perspective relies mainly on economic factors, such as excessive grain procurement targets, mismanagement, reckless ambitiousness, and inexperience of Soviet leaders, with climatic factors playing a contributing role. The second perspective argues that after a generalized Famine during most of 1932 affecting different parts of the Soviet Union, the Famine became a weapon of terror toward the end of 1932 and during the first half of 1933, targeting Soviet Ukraine and Ukrainians in North Caucasus.
Both economic and political factors were instrumental in determining the levels of Famine losses. Our focus is on the surge in mortality in early 1933 and the persistent increase in losses during the first half of 1933. Economic factors do not seem to have played a key role in the sudden increase in losses. We have provided empirical evidence that the rate of growth of monthly losses was determined mainly by political factors, such as massive searches for grain with confiscation of all food, restriction of travel (inter-republic and internal) in search of food, requisition of seed grain and grain reserves for emergencies, rebellions and repressions, selective distribution of food assistance, and the nationality factor.
A detailed analysis of the surge in mortality during the first half of 1933 strengthens the manmade on purpose perspective. It shows that such a rapid increase in mortality during a short period could have only happened due to politically motivated decisions that transcend the need to increase food production through collectivization and excessive levels of food requisition to support an extraordinarily ambitious industrialization policy.
Acknowledgments.
We would like to thank Andrea Graziosi, Mark Tolts, and the two anonymous reviewers for their helpful comments and suggestions.
Financial Support.
This research was supported by Fulbright Association, Harvard Ukrainian Research Institute, and Ukrainian Studies Fund and the programs it has established.
Disclosure.
Authors have nothing to disclose.