I. INTRODUCTION
Recently, polycrystalline garnet-type solid solutions of Ca3Sn2−x Ti x Al2O12 (x = 0.5 − 1.5) have been synthesized in the CaO–Al2O3–TiO2–SnO2 system by solid-state reaction, and the crystal structures and photoluminescence properties of the solid solutions have been investigated (Yamane and Kawano, Reference Yamane and Kawano2011). In the process of this research, a secondary phase that seemed to be a CaTiO3–CaSnO3 solid solution was found by powder X-ray diffraction (XRD). Isaeva et al. (Reference Isaeva, Lifshits, Fridberg and Cherkudinov1972) reported changes in the a-axis cell parameter of CaTi1−x Sn x O3 solid solutions and their dielectric losses at 10 GHz and 300 K. However, the solid solutions crystallize in orthorhombic cells and there have been no detailed structural studies of CaTi1−x Sn x O3 including the information on the b- and c-axes. The crystal structures of both CaTiO3 and CaSnO3 are of the same orthorhombic perovskite type (space group Pbnm) and composed of TiO6 and SnO6 octahedra, respectively, by sharing their corners (Vegas et al., Reference Vegas, Vallet-Regí, González-Calbet and Alario-Franco1986). TiO2 and SnO2, consisting of TiO6 and SnO6 octahedra, respectively, have the same rutile-type crystal structure (tetragonal, space group P42/mnm), and spinodal decomposition is known to occur in Ti1−x Sn x O2 solid solutions (Park et al., Reference Park, Mitchell and Heuer1975). In this study, CaTi1−x Sn x O3 solid solutions were prepared and their crystal structures were investigated by Rietveld refinement using powder XRD patterns.
II. EXPERIMENTAL
A. Synthesis
Starting materials were powders of CaCO3 (99.99%, Rare Metallic), TiO2 (99.99%, Rare Metallic), and SnO2 (99.998%, Kojundo Chemical Laboratory Co.). The CaCO3 powder was dried at 150 °C before mixing. The powders were weighed to the molar ratios of Ca, Ti, and Sn corresponding to the formula CaTi1−x Sn x O3 (x = 0.0−1.0), mixed in an agate mortar with a pestle, and pressed into pellets. The pellets were placed on a platinum–rhodium plate and calcined at 1200 °C for 12 h in air using an electric furnace. The calcined pellets were ground, mixed, pelletized, and then heated at 1450 °C for 12 h.
B. Data collection
The obtained polycrystalline pellets were powdered and powder XRD pattern measurements were conducted at a step width of 0.02° at 2θ using CuK α radiation with a graphite monochromator mounted on a powder diffractometer (Rigaku, Model RINT2200). The crystal structure parameters of the solid solutions were refined using the RIETAN-FP program (Izumi and Momma, Reference Izumi and Momma2007). Illustrations of the crystal structures and calculations of the interatomic distances, bond angles, and coordination polyhedron volumes were performed using the Visualization for Electronic and Structural Analysis (VESTA) program (Momma and Izumi, Reference Momma and Izumi2008).
III. RESULTS AND DISCUSSION
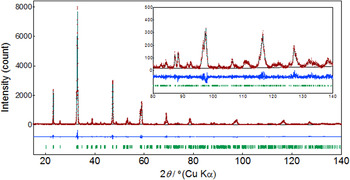
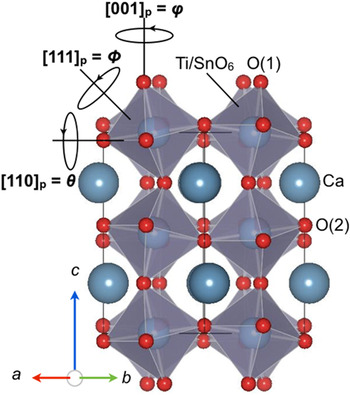
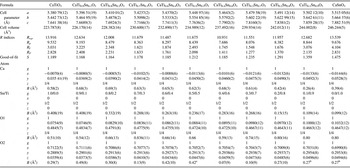
Single phases of CaTiO3 (x = 0.0) and CaSnO3 (x = 1.0) were synthesized by heating powders at 1450 °C for 12 h. Powder XRD reflections of the samples prepared with x = 0.1–0.9 under the same heating condition were indexed with orthorhombic cell parameters (space group, Pbnm). The crystal structure of CaTiO3 reported by Mitchell and Liferovich (Reference Mitchell and Liferovich2004) was used as a starting model for Rietveld refinement. Since all the obtained samples were single phases, the occupancies of Ti and Sn atoms in the Ti/Sn site were fixed corresponding to the starting compositions of x = Sn/(Ti + Sn). Table I lists crystallographic characteristics of CaTi1−x Sn x O3. The final R and S indices of the refinement were R wp = 10.931–13.916, R p = 7.686–9.676%, R I = 1.548–4.104%, R F = 1.277–2.828%, and S = 1.164 − 1.475. Figure 1 shows the observed and calculated powder XRD patterns of CaTi0.8Sn0.2O3 as an example. The largest misfit was observed around the diffraction peak of 121 with the highest intensity at 2θ = 32.88°. The full-width at half-maximum (FWHM) fitted by Rietveld analysis in the 2θ range of 20–140° was from 0.11° to 0.75° which was larger than the FWHM of CaTiO3 from 0.09° to 0.32°. Such diffraction peak broadening suggested the microstrain in the solid solution. The crystal structure of CaTi0.8Sn0.2O3 is illustrated in Figure 2 with Ti/Sn-centered oxygen polyhedra (Ti/SnO6).
(Color online) Rietveld refinement plot of the powder diffraction data for CaTi0.8Sn0.2O3. The bars indicate the allowed Bragg reflections for the Pbnm structure.

(Color online) The crystal structure of CaTi0.8Sn0.2O3 in a representation using Ti/Sn-centered oxygen polyhedra.

Crystallographic characteristics of CaTi1−x Sn x O3.

aConstrained the value of O1 and O2 with those of CaTi0.6Sn0.4O3.
bConstrained the value of O1 and O2 with those of CaTi0.2Sn0.8O3.
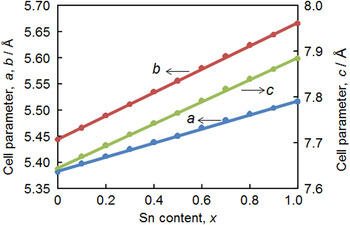
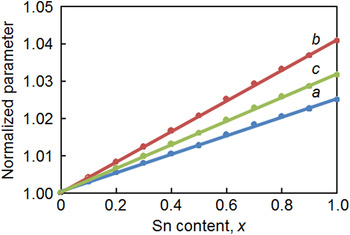
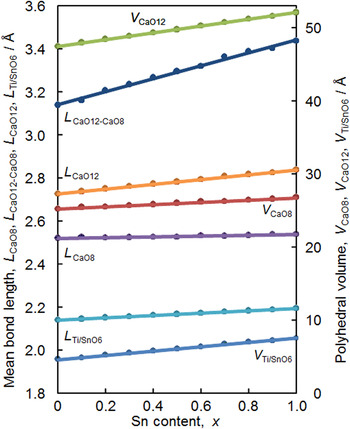
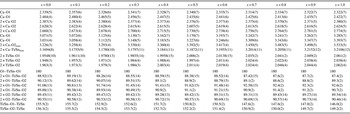
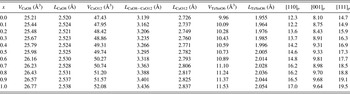
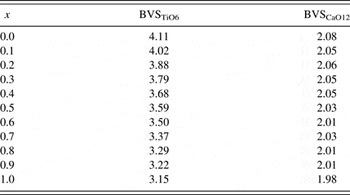
The cell parameters of CaTiO3 were refined to be a = 5.380 79(12), b = 5.442 73(12), and c = 7.641 38(16) Å and were in good agreement with reported values (a = 5.381 59(6), b = 5.442 81(7), and c = 7.642 07(10) Å) (Mitchell and Liferovich, Reference Mitchell and Liferovich2004). Refined CaSnO3 cell parameters were a = 5.515 05(6), b = 5.664 37(6), and c = 7.882 51(9) Å, comparable to those (a = 5.5142(2), b = 5.6634(2), and c = 7.881 62(17) Å) reported by Zhao et al. (Reference Zhao, Ross and Angel2004). Figure 3 shows the cell parameters refined by Rietveld analysis. As x increased, the cell parameters of the a-, b-, and c-axes linearly increased. Figure 4 plots the cell parameters normalized with the parameters of CaTiO3 (x = 0.0) as a function of the Sn content x. The rate of the b-axis increase (b x = 1.0/b x = 0.0 = 1.4) was the largest. The interatomic distances and bond angles of CaTi1−x Sn x O3 are shown in Table II. CaO8 and CaO12 polyhedral volumes (V CaO8, V CaO12), Ti/SnO6 octahedral volume (V Ti/SnO6), the averages of Ca–O distances in the first and second coordination spheres (L CaO8, L CaO12) and in between the spheres (L CaO8–CaO12), and the average of Ti/Sn–O bonds (L Ti/SnO6) are listed in Table III. The bond valence sums (BVSs) of the Ti/SnO6 octahedron and CaO12 polyhedra are listed in Table IV. The values of V CaO8, V CaO12, V Ti/SnO6, L CaO8, L CaO12–CaO8, L CaO12, and L Ti/SnO6 are plotted as functions of x in Figure 5.
(Color online) Unit-cell parameters of the CaTi1−x Sn x O3 solid solutions.

(Color online) Normalized unit-cell parameters of the CaTi1−x Sn x O3 solid solutions.

(Color online) Mean bond lengths and polyhedral volumes of CaO8 and CaO12 polyhedral volumes (V CaO8, V CaO12), Ti/SnO6 octahedral volume (V Ti/SnO6), the averages of Ca–O distances in the first and second coordination spheres (L CaO8, L CaO12) and in between the spheres (L CaO8–CaO12), and the average of Ti/Sn–O bonds (L Ti/SnO6) in the CaTi1−x Sn x O3 solid solutions.

Selected bond lengths (Å) and angles (°) of CaTi1−x Sn x O3.

Crystal chemistry of CaTi1−x Sn x O3.

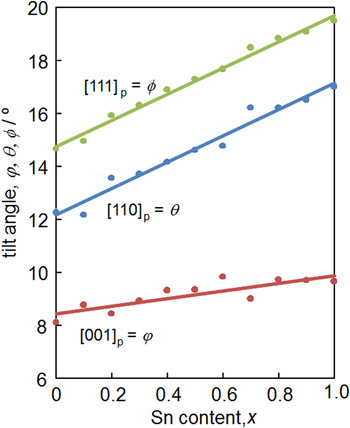
Notes: V CaO8 and V CaO12 are volumes (Å3) of polyhedra with Ca in 8- and 12-fold coordination, respectively. V Ti/SnO6 is the volume (Å3) of the Ti/SnO6 octahedron. L Ti/SnO6 is the mean bond length (Å) for the Ti/SnO6 octahedron, L CaO8, L CaO12, and L CaO8−CaO12 are the mean Ca–O distances in the first (CaO8) and second (CaO12) spheres and in between the spheres (CaO8−CaO12). [110]p, [001]p, and [111]p are octahedral tilt angles (°); all tilt angles are determined from bond angles.
BVSs of the Ti/SnO6 octahedron and CaO12 polyhedron.

BVS, Σj exp[(l 0−l ij )/B]; l 0, bond length (Å), B = 0.37 Å; l 0, bond valence parameter (Ti4+, 1.815 Å; Ca2+, 1.967 Å) (Brese and O'Keeffe, Reference Brese and O'Keeffe1991).
The increase of Ti/Sn–O bond lengths by substitution of Ti4+ for Sn4+ corresponds to the difference of ionic radii for Ti4+ and Sn4+ (six-coordinate: Ti4+ 0.605 Å, Sn4+ 0.69 Å (Shannon, Reference Shannon1976)). L Ti/SnO6 linearly changed from the average of Ti–O distances in CaTiO3 (L TiO6(x = 0.0) = 1.955 Å) to that of Sn–O distances in CaSnO3 (L SnO6(x = 1.0) = 2.054 Å). The increase rate of L SnO6/L TiO6 was 1.05. In accordance with this change, the volume of Ti/SnO6 octahedra increased from 9.96 to 11.53 Å3. The BVS calculated for the Ti/Sn site with the Ti4+ bond valence parameter (Brese and O'Keeffe, Reference Brese and O'Keeffe1991) monotonously decreased from 4.11 to 3.15 with increasing x from 0 to 1.0. The BVS with Sn4+ at x = 1.0 was 4.01, which was almost in agreement with the valence of Sn.
V CaO8 and L CaO8 did not change so much by substitution of Sn4+ for Ti4+. L CaO8 lengths are in the range of L CaO8(x = 0.0) = 2.520 Å to L CaO8(x = 1.0) = 2.538 Å (L CaO8(x = 1.0)/L CaO8(x = 0.0) = 1.01). V CaO8 changed from 25.21 to 26.77 Å3. L CaO12 increased from 2.726 to 2.837 Å with the L CaO12(x = 1.0)/L CaO12(x = 0.0) rate of 1.04, close to the L SnO6/L TiO6 rate of 1.05. As seen in each interatomic distance, the increasing rates of the distances with x become larger in the following order: L CaO8–CaO12, L Ti/SnO6, and L CaO8. The BVSs of Ca calculated for the CaO12 polyhedra were consistent with the valence of Ca.
The tilt angles of the Ti/SnO6 octahedra about the pseudocubic [110]p, [001]p, and [111]p axes (Table III and Figure 2) were calculated from the bond angles by following Zhao et al. (Reference Zhao, Weidner, Parise and Cox1993). As shown in Figure 6, the Ti/SnO6 tilt angles [110]p, [001]p, and [111]p increase uniformly with x from 12.3° to 17.0°, from 8.1° to 9.6°, and from 14.7° to 19.9°, respectively.
(Color online) Octahedral tilt angles (°) [110]p, [001]p, and [111]p in the CaTi1−x Sn x O3 solid solutions.

Judging from the results mentioned above, the lattice parameters and atomic arrangements of CaTi1−x Sn x O3 solid solutions gradually and continuously changed from the structure of CaTiO3 to CaSnO3. Phase separation similar to that observed in Ti1−x Sn x O2 solid solutions was not found in CaTi1−x Sn x O3 solid solutions.
CaTi1−x Sn x O3 solid solutions were sintered for measurement of capacitance (C) and dielectric loss (D) at 100 Hz–1 MHz and room temperature using an LCR (inductance (L), capacitance (C), resistance (R)) meter. The sintering conditions of the sample with x = 0.0–0.2, 0.4–0.6, and 0.8 were at 1550 °C for 24 h, at 1600 °C for 2 h, and at 1700 °C for 2 h, respectively. The ceramic bulk sample of CaSnO3 (x = 1.0) was prepared by covering the sample pellet with SnO2 powder and by heating at 1700 °C for 2 h. The relative densities were more than 82% for the ceramics with x = 0.0 − 0.8 and 72% for x = 1.0. The dielectric constants of CaTiO3 were 172–169 at 100 Hz–1 MHz and in good agreement with the reported value (170 at 5 GHz) (Jancar et al., Reference Jancar, Suvorov, Valant and Drazic2003). The dielectric constants and dielectric losses of CaSnO3 reported by Coffeen et al. (Reference Coffeen1953) were 17 and 0.0004 at 1 kHz and 14 and 0.000 at 10 kHz, whereas those reported by Mandal et al. (Reference Mandal, Sastry and Parkash1995) were 130 and 0.8 at 10 kHz, and 70 and 0.3 at 100 kHz. Both of these reports did not include information about the densities of the samples. The dielectric constants of CaSnO3 measured at room temperature at 100 Hz–1 MHz in our study were 37–13, values close to the former ones. The dielectric constants of CaTi1−x Sn x O3 ceramics decreased with x. The changes of CaTi1−x Sn x O3 dielectric loss with x had a tendency similar to that reported by Isaeva et al. (Reference Isaeva, Lifshits, Fridberg and Cherkudinov1972).
IV. CONCLUSION
The crystal structures of CaTi1−x Sn x O3 (x = 0.0–1.0) solid solutions prepared by solid-state reaction at 1450 °C for 12 h were investigated by the Rietveld analysis of powder XRD patterns. The parameters of the orthorhombic cells (space group Pbnm) and the Ti/Sn–O bond lengths were linearly increased by substitution of Sn for Ti.