





1. Introduction
Eskers are ridges of glaciofluvial sediment that are deposited in subglacial, englacial and supraglacial channels. Eskers and other proglacial landforms are commonly used in paleo-ice-sheet reconstruction to interpret subglacial channelized drainage network hydrological conditions (Boulton and others, Reference Boulton, Hagdorn, Maillot and Zatsepin2009; Trommelen and others, Reference Trommelen, Ross and Campbell2012; Livingstone and others, Reference Livingstone2020). However, directly linking the geomorphic expression of eskers preserved in the paleoglaciologic record to the processes responsible for their formation and evolution is challenging because they are deposited under or within glacial ice, making real-time observations difficult to impossible. Some other uncertainties in using eskers as records of paleo-subglacial drainage conditions are: (1) whether eskers record synchronous drainage networks (Brennand and Shaw, Reference Brennand and Shaw1994; Brennand, Reference Brennand2000; Boulton and others, Reference Boulton, Hagdorn, Maillot and Zatsepin2009; Trommelen and others, Reference Trommelen, Ross and Campbell2012) or near-margin conduit conditions as ice retreats (De Geer, Reference De Geer1940; Mäkinen, Reference Mäkinen2003; Hewitt and Creyts, Reference Hewitt and Creyts2019; Livingstone and others, Reference Livingstone2020); (2) whether eskers record the long-term dominant direction of subglacial drainage or only represent a snapshot of localized channelized flow, and to what extent their characteristics reflect deglaciation processes (Kleman and Borgström, Reference Kleman and Borgström1996; Trommelen and others, Reference Trommelen, Ross and Campbell2012); (3) whether eskers can be used as indicators of subglacial thermal conditions (Trommelen and others, Reference Trommelen, Ross and Campbell2012); and (4) whether esker systems fully represent a ‘fossil imprint of major longitudinal drainage channels’ (Boulton and others, Reference Boulton, Hagdorn, Maillot and Zatsepin2009) or only a fraction of the original deposit due to post-depositional erosive processes (Storrar and others, Reference Storrar2020; Lally and others, Reference Lally2023). In order to better interpret eskers preserved in the paleoglaciologic record, we analyzed the active emergence of an esker from the Breiðamerkurjökull glacier snout in southeastern Iceland. This esker was first observed emerging from the ice margin in 2021, and the evolution of the feature was mapped over a 1 year period by Lally and others (Reference Lally2023). The esker system has continued to evolve since, and by studying this evolution, we can link esker formation and modification processes with the resulting landforms observed in the landscape.
Using a time series of digital elevation models (DEMs) and orthophotos to monitor changes in glacial landscapes can provide valuable insights into glacial processes and landscape evolution (Chandler and others, Reference Chandler, Evans and Roberts2016; Tonkin and others, Reference Tonkin, Midgley, Cook and Graham2016; Seier and others, Reference Seier2017; Kaufmann and others, Reference Kaufmann2018). Repeat uncrewed aerial vehicle (UAV) surveys across the ice can also aid in the detection of glacier structural hazards associated with deglaciation, such as snout collapse events in part driven by subglacial channels (Egli and others, Reference Egli, Belotti, Ouvry, Irving and Lane2021). While this work focuses on hazards related to glacier ice front stability, increased volumes of glacier meltwater can also trigger geohazards, such as glacial outburst floods (jökulhlaups), landslides (Kääb and others, Reference Kääb, Reynolds, Haeberli, Huber, Bugmann and Reasoner2005; Mergili, Reference Mergili2016; Matti and Ögmundardóttir, Reference Matti and Ögmundardóttir2021) and glacier avalanches (Faillettaz and others, Reference Faillettaz, Funk and Vincent2015). Glacier-related hazards are expected to increase in magnitude and frequency over the next century (Harrison and others, Reference Harrison2018), but glaciers remain increasingly popular tourist destinations as well as significant cultural resources (Gagné and others, Reference Gagné, Rasmussen and Orlove2014; Allison, Reference Allison2015; Welling and others, Reference Welling, Árnason and Ólafsdottír2015; Stewart and others, Reference Stewart, Wilson, Espiner, Purdie, Lemieux and Dawson2016; Wang and Zhou, Reference Wang and Zhou2019). Tourism at glacier margins frequently involves glacier hiking and cave tours, so characterizing structural or physical hazards such as collapse hazards is highly relevant. Understanding esker formation and how the nearby glacier surface topography evolves will enable more precise identification of hazards associated with the esker-forming margin of a glacier. As part of our study, we conduct a survey of our data to provide an analysis of the glacial hazards present at this field site.
Eskers deposited subglacially, englacially and supraglacially may have different formation and evolution paths. Englacial eskers, in particular, lack many examples in the literature and may be less likely to be preserved (Storrar and others, Reference Storrar2020; Lally and others, Reference Lally2023). Here we address these knowledge gaps by studying the geomorphic evolution of an emerging englacial esker from Breiðamerkurjökull, Southeast Iceland, over weekly-to-annual timescales, extending the study period of the esker described in Lally and others (Reference Lally2023) and other eskers that have emerged since, to better understand the modification processes that impact eskers after they have been revealed by a retreating glacier.
2. Esker geomorphology
Eskers are sinuous ridges of glaciofluvial sediment deposited in ice-walled channels and can occur as single ridges (simple eskers) or ridge networks (complex eskers) (Price, Reference Price1969; Huddart and others, Reference Huddart, Bennett and Glasser1999; Brennand, Reference Brennand2000). Their morphology has been hypothesized to reflect ice conduit factors such as pressure, dimensions and slope. The Shreve model states that esker morphology can be related to the pressure regime within the conduit (Shreve, Reference Shreve1972). Assuming the conduit is completely filled, eskers should adopt the cross-sectional dimensions and crest morphology of the conduit (Banerjee and McDonald, Reference Banerjee, McDonald, Jopling and McDonald1975). Tall, sharp crests form on level or slightly descending bed slopes, whereas multiple crests form on gently ascending slopes and broad crests form on steeply ascending slopes (Shreve, Reference Shreve1972, Reference Shreve1985). Another study observed an emerging englacial esker in Alaska and found that the esker was initially flat-topped and capped by fluvial terraces, but a sharp crest developed as the sediment slumped off the slides of the ridge (Syverson and others, Reference Syverson, Gaffield and Mickelson1994). This indicates that although the esker shape generally reflects the geometry of the conduit, sharp crests can be the result of post-emergence esker modification. Indeed, Storrar and others (Reference Storrar2020) propose that the final morphology of eskers may reflect equifinality, e.g. that many different paths can reach the same end state. Therefore, caution must be taken in interpreting the geomorphology of eskers at any point in time.
Characterizing how esker morphology evolves after the landform is no longer encased within an ice channel is critical to interpreting eskers that are preserved in the paleoglaciologic record. This is particularly important for applications that infer conduit and glacier conditions based on esker morphology to inform ice-sheet models. However, our understanding of esker processes is limited by the lack of observations of esker deposition and their subsequent modification and evolution. This dearth of information is a result of the challenges associated with accessing eskers while they remain encased within glacier ice (Menzies and Shilts, Reference Menzies, Shilts and Menzies2002; Clarke GKC, 2005). Additionally, eskers can be deposited in subglacial, englacial or supraglacial channels. The differences between these types of eskers with respect to their formation, evolution and preservation are not well understood. Studies on eskers actively emerging from glaciers are essential for determining the relationship between esker form and depositional processes and conditions within their parent glacier.
3. Field site
The field site is located in Southeast Iceland at the Breiðamerkurjökull glacier, a ∼13.5 km-wide warm-based piedmont glacier draining the south side of the Vatnajökull ice cap (Fig. 1). The glacier has retreated approximately 7 km from its extent in 1890 and is composed of three main flow units. The western and eastern flows primarily terminate in proglacial lakes, while the central flow (the location of our study) terminates on an extensive glacial outwash plain. The field site consists of predominantly unlithified sediment sourced from primarily volcanic tephra and mafic igneous bedrock beneath and beside the glacier that was deposited in a variety of glaciofluvial landforms including eskers (Storrar and others, Reference Storrar, Evans, Stokes and Ewertowski2015; Guðmundsson and Evans, Reference Guðmundsson and Evans2022). Characteristics of the Breiðamerkurjökull glacier and proglacial area have been documented for centuries; historical observations of glacier retreat and advance date back to 900 CE (Ives, Reference Ives1991; Mckinzey and others, Reference Mckinzey, Ólafsdóttir and Dugmore2005; Björnsson, Reference Björnsson2016).
(a) Iceland and Vatnajökull ice cap with Breiðamerkurjökull marked by the red dot (ESRI basemap); (b) Breiðamerkurjökull and associated foreland (Sentinel-2 harmonized true color image from 8 August 2024) with extent of Figure 1c and numerous ice margin locations. Medial moraines delineating the central flow unit are labeled and Mávabyggðarönd (west) and Esjufjallarönd (east). The white lines in the foreland represent historic ice margin locations digitized from georeferenced geomorphology maps for 1890–1998 (Howarth and Welch Reference Howarth and Welch1969; Evans and Twigg 2000) and Sentinel-2 satellite imagery (2018). (c) Study area at the ice margin of the central flow unit of Breiðamerkurjökull with extent indicators for Figures 3 and 4. Notable foreland features such as bedrock area, pitted sandur and proglacial lakes are labeled. The basemap is a UAV-derived orthomosaic (6 May 2023) (Lally and others, Reference Lally2025).

1 Long description
A) Map of Iceland highlighting the Vatnajokull ice cap with Breidamerkurjokull marked by a red dot. B) Detailed map of Breidamerkurjokull and its foreland, showing ice margin locations from 1890-1998, medial moraines and notable features like Jokulsarlon. White lines indicate historic ice margins. C) Study area map at the ice margin of Breidamerkurjokull′s central flow unit, showing bedrock areas, pitted sandur and proglacial lakes. The map includes extent indicators and labels for features such as the active ice margin and glaciofluvial outwash plains. Scale bars and coordinates are provided for reference.
3.1. Previous Breiðamerkurjökull esker research
Breiðamerkurjökull eskers were the focus of foundational work by Price and Howarth (Welch and Howarth, Reference Welch and Howarth1968; Price, Reference Price1969, Reference Price1982; Price and Howarth, Reference Price and Howarth1970) and were identified across the foreland for the 1945–2018 map series of the entire ice front (Howarth and Welch, Reference Howarth and Welch1969; Evans and Twigg, Reference Evans and Twigg2002; Guðmundsson and Evans, Reference Guðmundsson and Evans2022). Storrar and others (Reference Storrar, Evans, Stokes and Ewertowski2015), using four ∼50 cm/px aerial images, mapped the evolution of Breiðamerkurjökull eskers between 1945 and 2007. They concluded that further work was required to confirm the location of esker formation (i.e. deposition in sub-, en- or supraglacial conduits) and how that relates to morphology. Lally and others (Reference Lally2023) made advances on this topic with observations of an actively emerging englacial esker and proposed a model for englacial esker evolution:
Stage 1: Esker deposition. Supraglacial water is delivered to the englacial drainage system, and glaciofluvial deposition occurs in the englacial conduit.
Stage 2: Meltout of esker crest. Glacier snout ice begins to downwaste, revealing a flat-crested esker. The esker crest emerges from the glacier ice with a flat morphology.
Stage 3: Destabilization of esker deposits. As the conduit’s ice walls begin to melt, the esker sediment is destabilized. Sediment from the crest slumps to cover the flanks, causing the crest to become round or sharp-crested.
Stage 4: Esker footprint increases. As the glacier ice retreats, more of the esker sediment slumps off the crest onto the flanks. These slumping deposits insulate the underlying ice, incorporating more ice into the ridge, which increases the apparent esker footprint. The esker becomes sharp-crested.
Stage 5: Ice-cored esker lowered onto foreland. As the glacier ice retreats, the esker is lowered onto the proglacial plain. The esker height decreases as the ice core melts, and the esker may be eroded by later meltwater flow and/or buried by glaciofluvial outwash deposits.
Stage 6: Post-depositional erosion. The esker can be eroded such that it is no longer recognizable in the landscape. Due to post-depositional processes such as the meltout of the ice core and erosion by later meltwater flow, the englacial esker may be preserved as a spread of gravel mounds and no longer recognizable as an esker in the landscape.
This model suggests that englacial eskers are not likely to be preserved in the landscape (Lally and others, Reference Lally2023). As eskers are used to infer glacial conduit conditions, this model implies that using only preserved eskers would not accurately reconstruct paleo-glacial drainage systems, as some would be missing. In this study, we investigate the same englacial esker analyzed by Lally and others (Reference Lally2023) but at weekly and annual timescales rather than seasonal to further analyze englacial esker processes and effects on esker morphology.
In this study, we extend the observation period for the englacial esker examined by Lally and others (Reference Lally2023) and quantify shorter-term changes (i.e. weekly) to gain further insights into englacial esker formation and modification processes. The englacial esker at the focus of this study was actively emerging from the retreating and thinning glacial ice margin. This esker was first observed in September 2021 (Lally and others, Reference Lally2023). Lally and others (Reference Lally2023) document the landscape changes that occurred at this esker over the course of 1 year (September 2021–22). Here, we use a time series of orthomosaics and DEMs to study the same englacial esker but expand the study period to capture both weekly and annual evolution from 2021 to 2024.
3.2. Glacial setting of the field site
Understanding the glacial context in which an esker forms is important to understand the processes that influence esker formation and evolution. Esker deposition in englacial conduits requires a sediment and meltwater supply. The most likely source of englacial meltwater is supraglacial channels entering the interior of the ice through moulins or crevasses. Sediment supply may also be supraglacial, melting out of the ice surface and then carried by supraglacial, and eventually englacial, channels. Lally and others (Reference Lally2023) suggest sediment at Breiðamerkurjökull can be elevated into the englacial environment from the bed of the glacier in the form of sediment-filled hydrofractures. The esker is located at the edge of an overdeepening which extends to the west, evidenced by the pitted sandur deposits (Fig. 1c). Meltwater forced to flow uphill, across the reverse-slope bed, may induce hydrofracturing in the overlying ice.
3.3. Hazards near the field site
Subsequent to the end of our field campaign, an event occurred that prompted the team to revisit our data to investigate glacial hazards at this field site in more detail. Our work concluded in early August 2024, and in late August 2024, collapse of a glacial channel near this field site caused a fatality in a tourist group (Moench and Jackson, Reference Moench and Jackson2024). The collapse occurred ∼200 m outside the region covered by our data, so we cannot directly assess this area. However, we can use our data to better understand this type of rapidly thinning glacier snout system, why it is conducive to forming the type of ice caves that attract tourists, and the warning signs that indicate these caves may be unsafe.
4. Methods
4.1. UAV data collection and processing
UAV data and field observations were undertaken during multiple field campaigns from September 2021 to August 2024 (Table 1). Two different field teams collaborated to produce this dataset, so the instruments and methods differed slightly. The UK-based team obtained the datasets from September 2021, early May 2022, September 2022, early May 2023 and May 2024. The 2021 and 2022 UK-based datasets were first reported in Lally and others (Reference Lally2023). The US-based team obtained the datasets from late May 2022, late May and early June 2023 and August 2024.
Nine distinct UAV datasets collected.

Table 1 Long description
Columns list team, dataset date, UAV model, and DEM or ortho output resolution in centimeters per pixel. UK entries are dated 8 Sep 2021, 6 May 2022, 6 Sep 2022, 13 May 2023, and 12 May 2024; US entries are dated 28 May 2022, 25 May 2023, 1 June 2023, and 9 Aug 2024. UK uses DJI Phantom 4 RTK for four dates with resolutions 5.8, 5.9, 5.3, and 5.7 cm per pixel, and uses DJI AIR 3S on 12 May 2024 with no resolution reported because only photos and videos were obtained. US uses DJI Phantom 4 Pro V2 on 28 May 2022 with 0.6 cm per pixel. US uses DJI Mavic 2 Pro on 25 May 2023 and 1 June 2023 with 1.0 cm per pixel for both dates. US uses DJI Mavic 3 T RTK on 9 Aug 2024 with 2.9 cm per pixel.
Aerial visible imagery was captured in a grid pattern using UAVs, and structure-from-motion techniques were used to create DEMs and orthomosaics using Agisoft Metashape (Smith and others, Reference Smith, Carrivick and Quincey2016; Koeppel and others, Reference Koeppel2022; Lally and others, Reference Lally2023, Reference Lally2025). The May 2024 field campaign did not obtain data to create an orthomosaic, but instead resulted in UAV-based video (Fig. S1) from which rough estimates of glacier margin retreat and esker emergence were derived.
A variety of field observations were made to complement the orthomosaics and DEMs, including photos taken from both the ground and the UAV, as well as trenching to investigate stratigraphy and depth to ice.
4.2. Esker analysis and mapping
All datasets were georeferenced to one basemap (the 13 May 2023 orthomosaic) using tie points in ArcGIS Pro. Difference maps show the change in elevation between early and late May in 2022 and between early May, late May and early June in 2023. The difference maps were created by first downsampling higher resolution DEMs to the lower resolution DEM, then subtracting them. To normalize each resulting difference map, we calculated the average value in an area that experienced no fine-scale change (selected visually) and subtracted that value from the map (see Supplemental Section 1 for additional details). This resulted in a difference map where the value of 0 represents a location that experienced no change. However, since the entire glacier was downwasting, the water levels were changing and the esker was evolving, there were very few locations in the scene that we could confidently say did not change between the two time periods. All of these locations were in the same part of the scene: the proglacial plain. Because this normalization was focused on only one side of the scene, the values on the other side of the scene (i.e. at the glacier) may have larger errors. DEMs created from images taken by UAV can also exhibit vertical ‘doming’ (i.e. James and Robson, Reference James and Robson2014), which would contribute to increased errors across the scene. We also note that these methods do not take into account the possibility of broad-scale change such as isostatic rebound that could occur in a glacial setting. For these reasons, the difference maps should be viewed as relative, rather than absolute, changes. In cases where we cite specific values for change, these values are ground-truthed with field photos and represent approximate estimates.
Shapefiles were created to capture the extent and characteristics of the esker (Fig. 2). The esker footprint shapefiles were outlined by hand using visible images, topography from DEMs and slope maps derived from the DEMs. When feasible, observations (i.e. photos) taken in the field were compared to the orthomosaics, DEMs and difference maps to support interpretations.
The esker footprint and slope for each study period, taken between September 2021 (left) and August 2024 (right). Subsections of the mapped esker are labeled on the right to refer to different parts of the esker for subsequent reference. Subsections include the distal bead, which was exposed by September 2021; the main esker segment, which emerged between September 2021 and September 2022, and new esker segments that emerged between September 2022 and May 2023, both of these areas are the focus of the change detection analysis; hummocky esker that was associated with the cave and supraglacial channel explored during the May 2023 field campaign; and the August 2024 esker ridge segments. Inset: UAV image from 27 May 2023 showing the main esker segment (photo facing north).

Figure 2 Long description
A time-series representation of esker evolution, with panels arranged chronologically from September 2021 to August 2024. Each panel shows mapped esker outlines and segments, highlighting morphological changes and slope variations. Starting with September 2021, the esker features a flat crest and isolated bead. By May 2022, the esker expands with a sharp crest and increased footprint. In between early and late May 2022, the esker is exposed via conduit roof melting. In September 2022, the esker footprint has increased. The June 2023 dataset shows western and eastern segments in addition to the central, primary esker. By August 2024, new eastern segments are visible and the western segment has disappeared. The inset UAV photograph from May 2023, facing north, highlights the main esker segment and shows the esker emerging from the glacial margin. Labels indicate specific features such as narrowing of footprint, erosion of distal bead and the emergence of new esker segments. The slope is represented by a color gradient, indicating low-to-high slope values. The diagram illustrates segmented esker planform outlines, supporting change detection analysis over time.
The orthomosaics, DEMs and shapefiles produced in this work are archived in Bennett and others (Reference Bennett2025).
5. Results
5.1. Annual evolution
5.1.1. Glacial context
Between September 2021 and August 2024, the Breiðamerkurjökull glacier margin experienced roughly 320 m of lateral retreat (Fig. S2). On the order of ∼100 m of retreat was observed each year. The glacier experienced 10–30 m of downwasting in our area of observation over the study period, depending on location (Fig. 3). An area near the main esker segment (Profile A in Fig. 3) experienced ∼10 m of glacier downwasting over the study, while further upglacier (i.e. the northernmost part of Profile B), it experienced over 20 m of downwasting.
(a) Orthomosaics for five of the study periods overlaid with a cumulative esker footprint obtained by merging all footprints throughout the study. The esker footprint is outlined in black, and two elevation profiles (A and B) are shown in solid white lines. Detailed labels are shown in the last panel in (a) and (b), in addition to Figure 2. (b) DEMs for the same study periods. The proglacial water is masked from the DEM due to erroneous values. (c) Profile A highlights elevation change across a cross-profile of the main esker segment, and Profile B shows elevation change across the esker crest from September 2021 to May 2023. A moulin is annotated on Profile B, and the same moulin is labeled in the first panel of (a).

Figure 3 Long description
Orthomosaics, DEMs and elevation profiles illustrating esker evolution. Section (a) shows orthomosaics for five periods with the esker footprint in black and elevation profiles A to A′ and B to B′ in white. Section (b) presents DEMs with elevation indicated by color gradients. Section (c) contains two line-profile plots. The top plot shows elevation profile A to A’ that is perpendicular to the esker crest. The bottom plot shows profile B to B’ which runs along the primary esker crest. Both plots show profiles from September 2021, May 2022, September 2022, May 2023, and August 2024. The x-axis represents distance in meters and the y-axis shows elevation in meters above sea level. The plots reveal changes in elevation, with notable increases and decreases near the moulin and specific segments. The esker shows signs of aggradation and segmentation over time.
The gap between the May/June 2023 and August 2024 datasets spans nearly two full melt seasons (summer 2023 and summer 2024), rather than one. UAV video from May 2024 (Fig. S1) was used to estimate the approximate location of the glacier margin to provide annual estimates of glacier retreat (Fig. S2).
The melt season at this glacier is expected to be primarily during the summer months. Hart and others (Reference Hart, Baurley, Bonnie, Robson, Bragg and Martinez2025) define spring beginning when air temperatures are continuously above 5°C at Breiðamerkurjökull (e.g. 8–30 May 2018) and summer as temperatures consistently above 10°C (e.g. 1 June–31 August 2018). Peak speed-up events were captured in their 2018 dataset on the 8th and 13th of May, indicating the beginning of the melt season velocities. Summer velocities remained stable compared to these spring speed-up events in the Hart and others (Reference Hart, Baurley, Bonnie, Robson, Bragg and Martinez2025) dataset. This suggests that although surface meltwater generation is higher during the summer months (evidenced by better-developed supraglacial drainage networks in the September datasets in Fig. 3), the melt generated in the spring season can also have significant impacts not only on glacier velocity, as evidenced by Hart and others (Reference Hart, Baurley, Bonnie, Robson, Bragg and Martinez2025), but also in impacting the structure of the glacier and associated landforms. Much of the data used in this study were taken in May (Table 1), which is very early in the melt season. Figure S2 indicates that much of the glacial retreat occurs between May and September, but there was also significant (∼30 m) retreat observed between 6 September 2022 and 13 May 2023.
Figure 3 shows that the esker is emerging near the edge of a proglacial lake. This is a common pattern for subglacial eskers observed in the outwash plain near the glacier snout at Breiðamerkurjökull (Lally and others, Reference Lally2023).
In locations where an esker is later revealed, the glacier was examined for any visible evidence that could indicate the presence of subsurface channels and eskers. No albedo features were identified, but in several locations, a moulin was present on the glacier ice near where an esker was later identified. For example, in September 2021, a moulin was observed (noted in profile B in Fig. 3) in the same place an esker was located in 2023. Another example is shown in Fig. S3. In 2023, an esker was identified near this location.
5.1.2. Esker evolution
The esker evolution is presented by the esker segments labeled in Fig. 2: the distal bead, the main esker segment (2021–22), hummocky esker and esker segments (2023) and esker segments (2024). Lally and others (Reference Lally2023) report this esker’s evolution from September 2021 until September 2022.
5.1.2.1. Distal bead (2021)
In September 2021, only the proximal bead was visible, and it had a crest length of 38 m; the ridge was crescent-shaped and flat-crested. By May 2022, the esker bead evolved into a sharp-crested ridge. In September 2022, this bead was almost completely surrounded by water from the proglacial lake, and part of the esker was eroded. By August 2024, only a small mound remained, and the area that had previously been occupied by the rest of the esker was covered in water.
5.1.2.2. Main esker segment (2022)
The main esker segment started emerging by May 2022, although it was still attached to the glacier. In May 2022, the main esker segment was observed to be flat-topped and covered in fine-grained sediment (Fig. S4). As of early September 2022, the esker crest length was 150 m. At this time, the main esker segment was located on the boundary between the proglacial lake and the outwash plain. By May 2023, the main esker segment remained intact but was sharp-crested, and the surface of the esker was no longer covered in fine-grained sediment. The esker flanks consisted of cobble-sized clasts. Elevation profile A–A′ in Fig. 3 shows that by May 2023, the esker crest had shifted to the east, away from the proglacial lake that borders the esker on the west. In August 2024, the main esker segment remained intact, but the footprint was reduced in area by ∼60% (Fig. 8) and the crest migrated further east.
5.1.2.3. Hummocky esker and esker segments (2023)
In May 2023, newly revealed sections of the esker generally appeared as islands within the lake, although one segment occurred as an ‘isolated esker bead’ (Fig. 2) located on the lake shore. Where the esker emerged from the glacial margin, the ice channel widened. The wide channel meandered and continued up-glacier until it narrowed where an englacial tunnel marked the location at which the channel continued into the glacier. This wide channel contained englacial esker sediment, as well as sediment deposited in the now supraglacial channel. The resulting landform (‘hummocky esker’ in Fig. 2) was a combined englacial and supraglacial esker.
In May 2023, two additional esker-forming tunnels/channels were observed near the primary esker (here we refer to the esker that is covered by Profile B in Fig. 3 as the ‘primary’ esker, as compared to the western and eastern eskers). One was connected to the western side of the wide channel near the glacier margin and similarly appeared as a supraglacial channel (parallel to the margin) that narrowed where an englacial tunnel marked the location where the esker continues into the glacier (labeled ‘western esker’ in Figs 2 and 4b). The other channel (‘eastern esker’ in Figs 2 and 4) was located roughly 25 m to the east of the main wide esker channel. By August 2024, the esker islands were almost entirely eroded, although the isolated esker bead remained. The esker section that formed in the wide channel in 2023 appeared as an island in 2024, but the morphology of this island did not present as a classic sinuous ridge. Instead, it was hummocky and irregular (‘hummocky esker’ in Fig. 2), likely reflecting complex post-emergence interactions with sediment deposited in the glaciofluvial outwash channel. In August 2024, the western esker was not preserved, and the area in which it was located was covered by water. The eastern esker was still present, and the footprint had increased in area. This part of the esker system was entirely located on the glacial outwash plain (Fig. 4).
Branching esker. (a) Context view from August 2024. Pink arrows show fractures in the glacier parallel to glacier margin, as well as edges of detached glacier ice that likely broke off the glacier margin along a fracture. Yellow outline shows the esker footprint. Blue arrows point to candidate eskers within the complex esker system north of the simple esker. (b) and (c) show the inset location in 2023 (25 May) and 2024, where eskers were under the ice/emerging from ice in 2023 and were present as eskers in the landscape in 2024. In this location, multiple tunnels/eskers branched off the main esker. The cyan arrows show esker-related meltwater pathways in this area, with the arrows showing the direction of flow. Question marks show where the existence of the pathways is inferred because eskers are not present and may have been eroded or never deposited. Red arrow in (b) indicates the location of the ice tunnel shown in Figure 7c and d. White arrows in (c) indicate additional sinuous ridges that were not included in our mapped esker footprint. (d) Ground photo from 13 May (while ice bridge was still intact) showing esker and ice bridge cross sections. White triangle in (b) shows the location the photo was taken from and the field of view for (d). White asterisk shows the same esker bead in (b) and (d). Orange arrows in (b) and (d) point to the same location. In (d), the orange arrow points to an ice bridge over an esker, and the green arrow points to a column of ice under the ice bridge that separates two tunnels. White dashed line shows the boundary between the esker ice core and esker sediment.

Figure 4 Long description
Thematic geomorphology mapping of a branching esker system shown in three annotated overhead map views plus one ground view; the context for this figure is shown in Figure 1. A) Overhead map view labeled, a, with date text, August 2024. A sinuous mapped esker footprint is traced through a narrow corridor. Multiple arrow annotations point along and across the ice margin area. A scale bar reads, 50 m. Two small inset markers labeled, b and, c, appear near the lower part of the map. B) Overhead map view labeled, b, with date text, 25 May 2023. Text labels identify, western esker, primary esker and, eastern esker. A dashed pathway line follows the esker, with arrowheads indicating flow direction. Several question mark symbols are placed along parts of the dashed pathway where no esker is present so water pathways are inferred. An asterisk symbol appears on an isolated esker bead. A scale bar reads, 15 m. C) Overhead map view labeled, c, with date text, August 2024. A dashed pathway line with arrowheads runs along the esker similarly to B. Several question mark symbols appear along parts of the dashed pathway where no esker is present so water pathways are inferred. A scale bar reads, 15 m. D) Ground view labeled, d, with date text, 13 May 2023. The cross section of an esker is shown, as well as an overhanging ice feature forming a bridge-like span. Text labels over the esker cross section read, esker sediment and, ice core. A dashed boundary line separates the areas indicated by those labels. A small asterisk symbol appears on the esker cross section in the ground view.
5.1.2.4. Esker segments (2024)
In August 2024, newly revealed sections of the primary esker appeared as islands within the proglacial lake (‘new primary esker segment’ in Fig. 2). UAV video from May 2024 showed the northernmost esker island segment emerging from the glacier margin (Fig. S1). In August 2024, the glacier margin had retreated more than 50 m beyond these new esker segments, but no additional esker segments were observed. Additionally, no new western esker segments were observed. More eastern esker segments were revealed by August 2024 (‘new eastern esker’ in Fig. 2; Fig. 4a). The new eastern esker segment continued north as a simple esker for roughly 125 m, then it transitioned to a complex esker near the glacier margin (blue arrows in Fig. 4a). UAV images from May 2024 showed the glacier margin at roughly the transition from simple to complex; only the simple part of the esker had been revealed at that time. No clear evidence for an esker or tunnel existed within the glacier near the complex esker at the margin in August 2024. Smaller ridges of sediment occurred next to this new esker system. These ridges were at times parallel to the esker (for example, the two sinuous ridges surrounded by water that were between the hummocky and irregular island and the southernmost portion of the new esker [brown arrows in Fig. 4c]) and other times perpendicular.
5.2. Weekly evolution
5.2.1. Glacial context
Between 6 May and 29 May 2022, the glacier front generally exhibited no retreat, although in one localized area it retreated ∼10 m (Fig. 5). The glacier was observed to downwaste between 1 and 1.5 m near the esker; estimates from both field photos and the difference map were consistent (Fig. 5).
Elevation changes between 6 May and 29 May 2022: (a, b) orthomosaics with the esker footprint outlined in yellow. Green arrows provide the directions of field photos in (d) and (e), and blue triangle points in the direction of the field photos in (f) and (g). The purple bracket provides the location for field photos in Figure 7a; (c) difference map highlighting elevation loss (reds) to areas of minimal change (whites) and elevation gains (blues). The largest elevation losses were associated with widening of tunnels, collapse features and fractured snout ice. The esker remained relatively unchanged compared to the lowering of the surrounding ice. (d) View west of an unroofed tunnel above esker sediment with (e) representing the same view ∼3 weeks later, showing that the ice tunnel had downwasted leaving a mound of esker sediment on the ice; (f) view south along the flat-crested esker, note the debris cone and the channel running along the esker flank; (g) shows the same view weeks later, where the esker becomes more prominent as the surrounding ice lowered.

Figure 5 Long description
The composite image includes orthomosaic maps and field photos illustrating elevation changes of an esker in May 2022. The orthomosaic maps from 6 May and 29 May show the esker footprint outlined in yellow. Green arrows and a blue triangle indicate directions of field photos. The difference map highlights elevation loss in reds, minimal change in whites and elevation gains in blues. The largest elevation losses are linked to tunnel widening and ice collapse, while the esker remains stable. Field photos from 9 May, 30 May and 31 May show changes in the ice tunnel and esker prominence. The maps are oriented with north at the top and the esker is located in a glacier field site. The scale bar provides context for distance measurement. The images demonstrate significant ice lowering around the esker, which stayed relatively unchanged.
Between 13 May and 1 June 2023, the visible glacier front receded north by roughly 1.5–20 m within our study area. Water levels were observed to be variable in this time, which may have influenced the visible glacier margin. Our teams were working in the area at various times between 13 May and 3 June 2023. Changes in the glacier were readily apparent on a day-to-day basis. For example, an ice bridge (Fig. 4d) that was noted to be more than a meter thick on 13 May had collapsed by 21 May, and had completely melted and disappeared by 3 June. The amount of glacier downwasting is apparent with the observation of the new esker channel between 13 May and 1 June (Fig. 6). These esker segments were initially completely covered by glacier ice, and by 1 June multiple segments had been revealed that rose above the glacier ice. From photos taken on the ground, we obtained a rough estimate using the amount of esker that was revealed in this time that the glacier must have downwasted at least 1.5 m, which matches the difference map estimate of ∼2 m of downwasting.
Esker evolution in May/June 2023. Orthomosaic of the study area with the esker outlined in yellow for (a) 13 May 2023, (b) 25 May 2023 and (c) 1 June 2023. Red arrow in (c) shows location of the esker tunnel shown in Figure 7c and d. Maps showing the difference in elevation at the study area between (d) 13 May and 25 May, (e) 25 May and 1 June and (f) 13 May and 1 June. The white arrow in (f) points to the eastern esker channel. The gray mask covers the extent of the water. The gray mask in (d) represents the water extent on 13 May, and in (e) and (f), the gray mask represents the water extent on 25 May. (g) Field photo of a cross section of an esker (dashed black arrow in (f)). White arrow points to undercutting. Photo taken 31 May. Person in orange vest for scale. (h) Field photo of a trench in the esker that was taken 1 June. Ice was present ∼40 cm below the esker flank surface. Location of the trench is indicated by the white triangle in (f).

Figure 6 Long description
Multiple parts illustrate the evolution of an esker from May to June 2023. The first row includes three orthomosaic maps labeled a, b and c, showing the study area on 13 May, 25 May and 1 June, respectively. Each map outlines the esker in yellow. The second row contains three maps labeled d, e and f, depicting elevation differences between the dates: 13 May to 25 May, 25 May to 1 June and 13 May to 1 June. These maps use a color gradient to indicate changes in elevation, with a gray mask representing water extent. The third row features two field photos. Image g shows a cross-section of an esker with a white arrow pointing to undercutting, taken on 31 May. Image h displays a trench in the esker with an ice core, taken on 1 June. The location of the trench is marked by a white triangle in the map labeled f. The images collectively document changes in the esker and surrounding glacier over the specified period.
5.2.2. Esker evolution
5.2.2.1. 2022 Weekly changes
By 6 May 2022, the distal esker bead was south of the glacier margin, and the southern half of the main esker segment had begun to emerge from the glacier, where it was located within an ice channel. At the southernmost tip, the channel walls were almost entirely melted back, while at the northernmost section, the channel walls still rose higher than the esker sediment. This heterogeneous channel wall height meant that the esker sides had varying levels of exposure to erosive agents. Generally, the uppermost esker sediment was above the glacier surface. Up-glacier from the emerging esker, the esker tunnel continued, although the tunnel roof was melting such that it sometimes appeared as a bridge (Fig. 5d).
By 29 May, another esker bead had emerged, and the esker tunnel entrance had retreated north. The distal portion of the main esker segment was now located entirely above the glacier surface, as demonstrated by outcrops showing stratified esker sediment on top of glacier ice (Fig. 7a). The ice in Fig. 7a is interpreted to be glacier ice rather than water that was transported in the esker conduit and then frozen because the ice appears pure and clear, which is representative of glacier ice, as opposed to ice that contains sediment, which would represent a matrix of ice that froze around esker sediment. At this point, the esker was completely unsupported by ice channel walls, and slumping was evident, but in many places along the main esker segment, the side was a nearly vertical face, and the esker crest was generally flat (Fig. 7a, b). The sediment observed in the vertical face was stratified (Fig. 7b). The top of the esker was ∼2 m above the glacier surface. The difference map created from the DEMs on the two dates (Fig. 5) highlights how the esker evolved in this time period. The greatest differences shown in Fig. 5c are related to the glacier downwasting and revealing new sections of the esker. The esker crest did not generally show any changes; it is flat-crested in both datasets. Change is apparent on the esker sides: the difference map varies from white (no change) to red (removal of material) along the sides of the main esker segment. The main esker segment area increased in this time period (Fig. 8), indicating that the footprint of the esker was increasing.
(a) Esker flank in 2022 showing esker sediment overlying ice. Photo taken 31 May 2022, at location indicated in Figure 5b. White box shows location of (b). (b) Outcrop of a nearly vertical face of esker sediment overlying ice. Photo taken 30 May 2022. Scale bar is 50 cm. (c) Inside the esker englacial tunnel in 2023. The entrance to the tunnel is shown in Figures 4b and 6c. Esker sediment is perched on an ice pedestal. Photo taken 1 June 2023. The tunnel is roughly ∼1.5 m tall. (d) A side view of the esker flank inside the tunnel. An ice body occurs within the esker sediment. Photo taken 1 June 2023. Scale bar is 10 cm. All: Orange arrows, lines and text indicate ice. Pink arrows point to streams.

Area (bar chart, primary y-axis) and maximum height (line chart, secondary y-axis) of the main esker segment (as defined in Figure 2) over the short (∼weeks long) timeframe datasets plus for the August 2024 dataset. Maximum height was determined by taking the maximum and minimum elevation from the DEM for the main esker segment shapefile.

5.2.2.2. 2023 Weekly changes
By 13 May 2023, the distal bead was nearly entirely eroded, and the entire main esker segment was south of the glacier margin (Fig. 6a). North of the main segment, the esker was completely surrounded by the proglacial lake. One bead of the esker appeared as an island. Another section of the esker runs along the glacier margin. The esker is mapped discontinuously because, in areas, the glacier ice tunnel still covers the esker. Field observations confirm that the esker is continuous in this area under the ice tunnel and bridge. North of the collapsed ice bridge, a ∼10 m wide ice-walled supraglacial channel occurs at the glacier margin that contains glaciofluvial sediment on the channel floor. A significant portion of the channel floor appeared to be ice-floored, but where sediment is apparent, several esker segments are mapped. The esker continues up-glacier within a glacial ice conduit. Several esker segments are also mapped within the offshoot channel to the west of the main channel. The isolated esker bead (Fig. 2; white asterisk in Fig. 4d) located on the shore of the lake next to the ice bridge is the only potential evidence of the new eastern esker—the tunnel is not yet apparent in the glacier. The main esker segment and the esker island both have sharp crests. The portions of the esker that run along the glacier margin and occur on the glacier have flat to rounded crests.
By 25 May 2023, the footprint of the distal bead and the main esker segment had slightly retreated where the esker was in contact with the proglacial lake, but otherwise the area remained similar (Fig. 6b; Fig. 8 indicates a ∼10% decrease in area of the main esker segment). The glacier margin retreated and collapsed (a block of glacier ice is observed in this area that is interpreted to have collapsed from the glacier snout, Fig. 6b, d), such that the esker along the margin was completely revealed. The esker was still mapped as discontinuous beads in this area because the esker had been eroded and was surrounded by water. The ice bridge that was visible in the 13 May dataset collapsed, but the residual ice was still blocking the associated section of the esker from a nadir UAV view (Fig. 6). The wide supraglacial channel floor now appears to be completely covered in sediment, and therefore the entire channel is mapped as an esker segment. The esker segments in the western channel increased in area. The area of the esker bead on the lake shore that is proposed to be part of the new eastern esker remained the same. Collapse pits and associated esker segments appeared in the glacier marginal ice ∼25 m east of the main esker, marking the first observed evidence of additional englacial tunnels in this area.
By 1 June 2023, the footprint of the distal bead and the main esker segment had slightly decreased where the esker was in contact with the proglacial lake (Fig. 6c; Fig. 8 indicates another ∼10% decrease in main esker segment area). The water levels in the lake also rose, so this change could have been due to either erosion or water level changes. The esker within the lake along the glacier margin also decreased in size, either due to erosion or rising water levels. The ice bridge melted, so the continuous esker became visible in the area at the end of the supraglacial channel (Fig. 6c). The englacial tunnels at the head of both the main supraglacial channel and the western channel retreated, revealing more of the esker. By 1 June 2023, the glacier surface pits overlying the eastern esker had coalesced to form an open-roofed sinuous channel, within which the esker was visible. At points, the esker rose above the glacier ice.
The esker-forming englacial conduit at the head of the primary wide supraglacial channel (Fig. 7c) was briefly investigated during the 2023 field season. Figure 7c and d show images taken inside the tunnel. Esker sediment was observed on top of an ice pedestal that was eroded by a stream within the tunnel (Fig. 7c). A body of ice was also observed within the esker sediment (Fig. 7d). Both of these sections of ice were observed to contain rock clasts within the ice matrix near the boundary with the esker sediment, but appeared to be clearer/purer ice further from that boundary.
The 2023 difference maps show no major changes in the esker over this 19 day interval. Instead, they highlight localized changes in the main esker segment (see arrows in Fig. 6f). An exposed cross section of the main esker segment (dashed arrow in Fig. 6f, photo in Fig. 6g) had a nearly vertical face that was eroded back between the two time periods, and the field team observed this backwasting occur on a daily basis. The vertical face appeared dark in Fig. 6g because the main esker segment contained a significant ice core that was melting and darkening the esker sediment. This interpretation was confirmed by observing the face throughout the day—it remained dark regardless of sun angle. Trenching on this section of the esker on 31 May revealed unstratified esker sediment overlying ice ∼40 cm beneath the surface on the flank (Fig. 6h) and ∼1 m beneath the surface at the crest. Undercutting was also observed beneath the esker (white arrow in Fig. 6g). Similar backwasting occurred at the other esker bead with an exposed cross section (isolated bead in Figs 2 and 7; white asterisk in Fig. 4). Erosion on the esker flank (purple arrow in Fig. 6f) was observed in the same location where ice was observed to outcrop within the esker in 2022 (Fig. 7b). An area of collapse on the esker crest in the southern part of the main esker segment (southernmost arrows in Fig. 6f; Fig. S5) likely occurred due to ice melting in the esker core.
6. Discussion
6.1. Multiple paths for englacial esker evolution
Lally and others (Reference Lally2023) presented one path for englacial esker evolution (see Section 3.1). With the additional data obtained in this work, we present an alternate conceptual model for englacial esker evolution (illustrated in Fig. 9). We note that the evidence for these potential evolution paths was observed at the same esker, but this study encompasses a longer time series of observations.
Conceptual model for one path of englacial esker evolution, for the scenario observed at this field site where the esker is deposited at the edge of a water-filled overdeepening: (a) An englacial conduit containing esker sediment within glacier ice. In this example, the conduit is located at the edge of an overdeepening. H tf represents the height of the tunnel floor above the subglacial bed. (b) While the esker is still within the glacier, meltwater streams inside the englacial conduit incise into esker sediment and glacier ice. (c) The esker emerges from the glacier ice with the tunnel roof and sides melting, but the esker is still perched on the glacier. (d) An ice core is created by slumping of esker material, and a sharp crest begins to form. (e) The esker detaches from the glacier. At this point, the height of the esker is similar to H tf because the esker has enveloped all of the ice between the original tunnel floor and the subglacial bed. (f) Over time, the ice core melts and interactions with a proglacial lake located in the overdeepening cause backwasting and crest migration. (g) The esker may be almost completely eroded.

Figure 9 Long description
A neutral and instructional scientific schematic arranged in seven panels labeled a through g, read left to right and top to bottom. Each panel has a caption sentence at the top describing the stage shown. Panel a shows a cross-section of glacial ice containing an englacial tunnel with an englacial esker inside it. Labels read: Glacial ice, Englacial tunnel, Englacial esker, Overdeepened area, Subglacial bed and H subscript t marking the height of the tunnel floor above the subglacial bed. Panel b shows the esker still within the glacier while meltwater streams widen and deepen the tunnel. Labels include: Glacier downwasting, Flat topped englacial esker, Glacier ice pedestal and Stream on both sides. Panel c shows the esker emerging with vertical sides. Labels read: Flat topped comma steep sided esker, Exposed ice pedestal backwastes, Alternate path: typical mass wasting and Stream. The caption states the esker remains flat topped with vertical sides due to exposed ice pedestal backwasting and stream erosion. Panel d shows sediment transported downslope. Labels include: Primary internal stratification is destroyed via slumping, Sharp crest and Ice pedestal is now an ice core. The caption states esker sediment is transported downslope via mass wasting processes comma creating an ice core and a sharp crest. Panel e shows the esker separated from the glacier. Labels read: Meltwater accumulation in overdeepening and H subscript t. The caption states the esker has separated from the glacier and its height reflects the initial height of the englacial tunnel. Panel f shows post-depositional changes. Labels read: Crest migration, Ice core melts comma height decreases, Backwasting and Undercutting. The caption states post-depositionally comma the ice core melts causing the esker height to decrease and interactions with water cause esker backwasting. Panel g shows near-complete erosion. The label reads: Continued crest migration. The caption states eventually ice and water interactions and ice core melting result in near complete erosion of the esker. Throughout all panels comma the uppermost layer represents glacial ice comma the mid layer represents esker sediment comma and the lower layer represents the subglacial bed. Water is shown at the base in later panels.
6.1.1. Englacial esker ice core development and evolution
The results from this study indicate that the abundant water present in the glacial system and the englacial esker conduit can lead to marginal streams at the boundary between the esker and the glacier. These streams can begin to carve into the glacier ice while the esker is still in the conduit (Figs 7c and 9b), and they can continue to impact the esker evolution after the esker has emerged from the conduit and the ice channel walls have melted (Figs 7a and 9c). The streams can erode into the glacier ice to a greater depth than the base of the esker, resulting in an esker sitting on top of a glacier ice pedestal. The ice pedestal is now exposed to air, insolation and further erosion by the stream, causing additional melting and/or thermal erosion that destabilizes the esker and causes sediment collapse (Figs 7a and 9c). These collapse deposits can cover and insulate the glacier ice pedestal and beyond, increasing the esker footprint and preserving the ice as an ice core. Figure 7a shows glacier ice underlying esker sediment, a stream at the base of the esker, and evidence of slumping that covers the ice. Additionally, the esker is observed to be flat-crested (Figs 7a and 9c) even after the entire esker has emerged from the ice and the sides are no longer supported by the ice channel walls. In areas where the ice pedestal was observed in the emerged esker, the esker was flat-topped, and the esker side had a slope of nearly 90° (Figs 7a and 9c). We propose that this is due to exposed ice melting and becoming undercut by the esker-marginal stream, causing the esker sides to collapse and form vertical faces. The esker crest thus becomes smaller in area but remains flat in form. Eventually, the vertical faces experience slope failure (due to gravity and/or variable cohesion of sediment as it gets wet from storms and subsequently dries out), and the esker reaches a sharp-crested stage (Fig. 9c, d).
In this model, the esker footprint and prominence (i.e. height above the surrounding glacier) both initially increase as esker sediment covers glacier ice, which is then preserved in the core of the esker (i.e. Fig. 8), also observed in Stage 3 of the Lally and others (Reference Lally2023) model. Rather than being ‘lowered’ onto the proglacial plain as the glacier downwastes (Stage 5 of the Lally and others (Reference Lally2023) model), we propose that englacial eskers can continue to grow in area and height as the glacier retreats and downwastes; the esker sediment continues to slump and cover additional glacier ice, such that the ice is preserved in its ice core until the esker base encounters the proglacial plain (Fig. 9d, e). Therefore, this suggests that the resulting ‘maximum’ height of the esker (i.e. the height of the esker immediately after it detaches from the glacier and can no longer accumulate additional glacier ice, and before the ice core significantly melts) is related to the thickness of the glacier ice that exists beneath the original englacial tunnel floor (i.e. the ‘height’ of the tunnel floor, called H tf in Fig. 9a and e). This interpretation is supported by Fig. 3b, which shows how the elevation profile of an esker evolved over time. The profile in May 2022, when the esker is newly emerged and still contained within the glacial ice channel, is a similar height to the maximum height of the esker observed in September 2022, when that section of the esker had recently detached from the glacier. It is likely that the maximum height of the esker and the height of the tunnel floor will not be exactly the same, given that the maximum height of the esker includes esker sediment in addition to ice, and it is likely that some melting of the ice core would occur prior to esker detachment from the glacier.
The esker morphology will continue to evolve after it is detached from the glacier. Once the ice core starts melting, the esker will start to decrease in height (Fig. 9f). This is observed in our quantitative geomorphology results in Fig. 8: in 2022, when the main esker segment is still on the glacier ice, its footprint increases, whereas in 2023, when the main esker segment is on the proglacial plain, the footprint decreases. Figures 4d and 6g both show cross sections of the englacial esker after it has separated from the glacier supporting this model, as they both contain a significant ice core. The interpreted boundary between the ice core and the esker sediment is illustrated in Fig. 4d. The visible side of the ice core is steep (nearly vertical), which could indicate that it was previously a stream-cut ice pedestal that was then subsequently covered by esker sediment. Figure 6h shows a trench in the primary esker section shown in Fig. 6g, in which an ice core was documented at a depth of ∼40 cm below the surface on the flank and ∼1 m below the surface at the crest.
6.1.2. Evolution of internal esker stratification
The majority of this work is based on aerial remote sensing supported by ground truth, focusing on the geomorphology of the esker. From our ground truth imaging and trenching, we also observed the internal stratification of the esker (i.e. Figs 7b and S4). Trench observations provide insight into the internal stratification at discrete points in time; however, the process of trenching disturbs the stratigraphy, which prevents repeated observations at the exact same location over time. As esker stratigraphy may show lateral variability over the scale of meters, the lack of repeat observations over time at the same exact location hinders direct observation of the stratigraphic evolution of englacial eskers.
Keeping these caveats in mind, field observations of the exposed strata further support the above model of esker deposition and modification. Figures 7b and S4a both show sections of the main esker segment that displayed internal stratification in 2022. Figure S4a includes lines that indicate interpreted set boundaries and foresets. The main esker segment was also observed in 2023 (i.e. Fig. S4b), so changes in esker morphology and stratigraphy can be observed. In 2022, this part of the main esker segment was expressed as a stratified vertical face, and the esker was flat-crested (Fig. S4a). In places, the stratified vertical face was overlying a glacier ice pedestal (Fig. 7b). In 2023, the esker morphology in this area presented as a typical, sharp-crested sinuous ridge. Trenching in the main esker segment in 2023 revealed a lack of distinguishable layers (Fig. S4b) and an ice core present only ∼40 cm below the surface on the flank. The observations in 2022 (Figs 7b and S4a) were not taken in the same exact location as those in 2023 (Fig. S4b; see Fig. S4c and d for localization). While there may be lateral variability within an esker segment, these observations provide examples of varying degrees of esker stratification as a result of ongoing surface modification and erosion. These observations support the esker evolution model presented above, in that the ice pedestal erosion causes the initially emplaced stratified esker sediment to collapse (therefore disrupting the stratification) and insulate an ice core. The resulting landform is a sharp-crested ridge with limited internal stratification and a thick ice core (Fig. 9e).
6.1.3. Englacial esker evolution after glacier retreat
The changes that occurred at the englacial esker between early May and June 2023 (Section 5.2.2; backwasting, flank erosion and core collapse) highlight the processes that contribute to englacial esker evolution after the esker detaches from the glacier and the esker now rests on the proglacial plain. Lally and others (Reference Lally2023) suggested that englacial eskers may be entirely eroded by a combination of glacier meltwater flow and ice core melting. Here, we suggest that englacial eskers can also experience thermal and physical erosion related to the interaction of the ice-rich core and proglacial lakes. Undercutting and flank erosion occur on the main esker segment (Figs 6d and 9e) because of the interaction between the ice-rich esker and the proglacial lake water. The water is warmer than the ice, so the ice melts more rapidly in areas where the lake water interacts with the esker. This is also demonstrated in the esker footprint, which was observed to retreat further on the lake side than the plain side throughout May/June 2023, as well as between June 2023 and August 2024. Similarly, the elevation profiles in Fig. 3b show that the esker was eroded more on the proglacial lake side than on the sandur side. Therefore, the localized changes in esker morphology that are observed in May/June 2023 in the main esker segment after it detached from the glacier are generally interpreted to be due to ice core melting, ongoing erosion from varying lake levels and the interaction between these two processes.
6.1.4. Esker enlargement
In some instances, primary esker deposition and post-emergence modification can overlap, as is the case for what we interpret to be supraglacial esker enlargement. In May 2023, an ice-walled supraglacial channel containing esker sediment was observed (Fig. 6), and in 2024, this section did not display typical esker features, as it had a wide footprint and hummocky relief (‘hummocky esker’ in Fig. 2). In 2023, the englacial tunnel (Fig. 7c, d) opened into this supraglacial channel, with meltwater streams running alongside the esker (photo: Fig. 7c; model: Fig. 9b) and potentially contributing to the widening of the downstream supraglacial channel. There was also an offshoot of the channel to the west (Fig. 6), which was supraglacial and also led to an englacial esker-forming tunnel (Fig. 9g). Therefore, this area can be interpreted as an englacial esker system, with multiple branches of esker-forming conduits. These multiple branches met where the supraglacial ice-walled channel occurred.
This location of the hummocky esker could represent a confluence point of multiple esker channels, which could have resulted in increased sediment deposition and meltwater supply. This high meltwater supply could have widened the area around this confluence to form an ice-walled ice-floored trough that filled with sediment. This meltwater also reworked the esker sediment that had recently emerged from the englacial tunnel(s) and likely also deposited additional glaciofluvial sediment. As this additional glaciofluvial sediment was deposited in an ice-walled supraglacial channel, the deposits are considered to be a supraglacial esker. Therefore, this segment is interpreted to be a combination englacial-supraglacial esker. All of this resulted in an esker section with a wider footprint than neighboring segments (Fig. 2) and an unusual hummocky morphology.
This process is similar to ‘esker enlargement’, in which the esker ridge becomes wide but then narrows again downflow (Lindström, Reference Lindström1993; Dewald and others, Reference Dewald, Lewington, Livingstone, Clark and Storrar2021). Dewald and others (Reference Dewald, Lewington, Livingstone, Clark and Storrar2021) interpret Canadian ice-sheet esker enlargement to be a result of subglacial conduit collapse close to the ice margin. While our study site represents a slightly different setting (englacial eskers in an Icelandic piedmont glacier), similar processes are likely at play. Close to the ice margin, the englacial conduit must have experienced roof collapse such that the tunnel became an ice-walled channel. At our field site, the enlargement may also have been enhanced by the joining of two englacial esker conduits meeting and/or thermal erosion by esker-marginal meltwater streams.
This supraglacial esker enlargement process represents another complex way in which an englacial esker can evolve after it has emerged from the englacial tunnel.
6.1.5. Building on the Lally and others (Reference Lally2023) model
Our conceptual model (Fig. 9) builds on the model presented by Lally and others (Reference Lally2023) and provides alternate paths for ice core formation and postdepositional processes. Unlike Stage 3 in the Lally and others (Reference Lally2023) model, whereby the apparent footprint of the esker increases due to slumping of esker sediments, our observations from May 2023 show the formation of an ice pedestal as meltwater is diverted around the esker sediment and incised into the surrounding ice. This pedestal then becomes covered by slumped sediments, creating the ice-cored feature. This model also provides evidence that the esker height relates to the thickness of the esker sediments and the height of the englacial tunnel it was formed in, which was not presented in Lally and others (Reference Lally2023). The subsequent stages in the Lally and others (Reference Lally2023) model represent the esker evolving on foreland sediments and evolving through erosion by later meltwater channels. The model presented here details how the esker evolves in a proglacial lake at the lateral edge of an overdeepening from observations from 2023 to 2024. This section also discusses how the internal stratification of the esker was observed to evolve and suggests that supraglacial esker enlargement occurred at the esker, neither of which was observed or discussed in Lally and others (Reference Lally2023).
6.2. An esker network at Breiðamerkurjökull
In 2021 and 2022, the emerging esker was a single sinuous ridge interpreted to be a simple englacial esker. In 2023, our data reveal that multiple esker conduits were active in the same area (Fig. 4) and that the resulting esker assemblage was deposited in a series of interconnected meltwater tunnels.
Figure 4b and c show the multiple esker branches (‘western’, ‘primary’ and ‘eastern’) and the inferred meltwater pathways. The western esker channel terminates in the primary esker channel, providing direct evidence for a connected meltwater pathway. The eastern esker channel observed in the glacier in 2023 does not directly connect to the primary esker channel. However, we infer that these channels likely connected at one point. In 2023, the primary esker followed the curve of the glacier margin, and this section of the esker was revealed over the May/June 2023 study period. Fifteen meters to the east of this main esker section, another isolated esker bead occurs (white asterisk in Fig. 4) near an ice bridge. This esker bead was most likely deposited in a separate channel due to the structure of the ice bridge. Figure 4d shows the primary esker running under the ice bridge on the side closest to the glacier margin (orange arrow). A column of ice (green arrow) separates this esker tunnel from the rest of the tunnel under the bridge. The isolated eastern esker bead is adjacent to the latter tunnel under the ice bridge, and we infer that the meltwater pathway for this esker also traversed the area beneath what is now the ice bridge. However, there are gaps in the eastern esker landform (noted by ‘?’ in Fig. 4b). These gaps coincide with the proglacial lake and with a glacial outwash channel. The esker may have previously been continuous through these areas, but then was later eroded. Alternatively, sediment may not have been deposited in these areas. When projecting the inferred meltwater pathways from the eastern esker channel to the eastern esker bead, it is reasonable to extend that pathway a short distance such that it connects with the primary esker (eastern line in Fig. 4b). Therefore, we hypothesize that all three of the esker branches were sourced from interconnected meltwater pathways and are part of the same esker system. At minimum, if the eastern branch was not connected to the rest of the conduit network, we have identified three englacial eskers and their conduits all within a localized area (i.e. <0.01 km2).
The western esker, similar to the primary channel in this area, was observed to be deposited englacially (an esker was observed in situ within an englacial tunnel at the location of the westernmost red arrow in Fig. 4b) and also supraglacially (esker sediment was observed in a supraglacial channel). The eastern esker is interpreted to be englacially deposited. The cross section of the isolated esker bead (white asterisk in Fig. 4), which is interpreted to be part of the eastern esker, exhibits a central ice core overlain by esker sediment (Fig. 4b). In 2024, a different section of the eastern esker was trenched, and an ice core was encountered. Recently emerged englacial eskers are expected to contain an ice core (Fig. 9, also Lally and others, Reference Lally2023), whereas subglacial eskers are not expected to have ice cores. We note that this branch of the esker transitions from a simple esker to a complex esker as it continues northward (Fig. 4a). Few observations of the complex section of the esker were obtained, so these interpretations should only be applied to the simple part of the esker.
Taken individually, the western, primary and eastern eskers are each simple eskers (i.e. there is only one main crest), aside from the northern section of the eastern esker described above. When examined together, we ask: is this a branching network of simple eskers or a single complex esker? Considering that the eastern esker transitions to a complex esker, this area of branching single eskers (shown in Fig. 4b and c) likely represents an area of transition between a simple esker and a complex esker. Sub- and englacial conduits are observed to become more numerous at the confluence of these three eskers (see discussion in Section 6.3), reflecting the more complicated meltwater pathways. This transition pattern continues northward when the eastern esker becomes a complex esker.
6.3. Glacial setting and hazards
The results from this work demonstrate an extremely active glacial hydrologic system in the field area. The meter-scale downwasting observed at the glacier ice over a period of only a few weeks provides the necessary supraglacial meltwater supply to facilitate englacial esker formation. The moulin identified in September 2021 (Fig. S3) was likely one source of supraglacial water and sediment for the englacial esker and suggests that the englacial tunnel was already present in this area in September 2021. Subglacial meltwater pathways also exist in the area, as demonstrated in Fig. S6, which shows water upwelling from beneath the glacier snout to the west of our study area. We did not find evidence of subglacial meltwater as a source for the englacial eskers in our study.
The increased melting and the resulting increased meltwater in the system can also be interpreted from a glacial hazards perspective. Figure 9 shows the potential glacial hazards (i.e. ice bridge formation and collapse, glacial margin undercutting, esker conduit roof thinning and collapse) and related features that were identified in the UAV datasets and field photos and observations. In particular, the difference maps were used to identify areas of change that could indicate potential hazards. Unless explicitly stated, all observations are from the May/June 2023 field season.
This area exhibits an extremely active surface hydrologic system. Abundant supraglacial channels are observed (orange arrows in Fig. 10d), and the point of convergence of these channels occurs in our study area. A waterfall is observed at the point of convergence (Fig. 10e). The active surface hydrology is evidence of and contributes to glacial hazards because glacial melting can contribute to a positive feedback loop in which the glacier ice melts and produces water, which, in turn, promotes more melting. The increased meltwater in the system is a hazard in itself, as the potential for jökulhlaups increases. The meltwater can also create hazards by eroding the ice so that it becomes unstable and collapses (e.g. the ice bridge collapse, Fig. 10 k, l). UAV video obtained near our study area (Fig. S6) shows an active subsurface hydrologic system, with water being expelled from the glacier margin with enough energy to eject boulders.
Hazards at the Breiðamerkurjökull glacier margin. All data in this figure are from 2023 unless noted otherwise. (a) Orthomosaic from 13 May 2023, (b) orthomosaic from 1 June 2023 and (c) difference map showing elevation change between these two dates, each labeled with features that are relevant to glacial hazards. In (c), the gray area masks water. (d) Oblique UAV view of the hazard-relevant glacial features. (e) A waterfall on the glacier. Location of the waterfall is shown by the ‘surface hydrology’ arrow in (a)–(c). (f) Red arrow points to a crack in an esker tunnel roof near the western esker (Figure 7). (g) Western esker supraglacial channel. Red arrows point to undercutting in the channel walls. Brown arrow indicates a very thin esker tunnel roof. (h) Yellow arrow indicates a tunnel and red arrow indicates undercutting in the glacier margin. Location of the tunnel is indicated by the ‘undercutting’ arrow in (a)–(c). (i) Looking up at the edge of a thinning esker tunnel roof. Tunnel location is indicated by the red arrow in Figure 7c. (j) August 2024. Looking up at a glacial tunnel roof with skylights (irregular shaped holes in the ice in the center of the photo) in the ice. (k) Intact ice bridge on 13 May 2023. (l) Collapsed ice bridge on 27 May 2023.

Figure 10 Long description
A multi-panel scientific figure documenting glacial hazards at the Breidamerkurjokull glacier margin, using orthomosaics, an elevation difference map, oblique UAV photographs, and photos taken from the ground. The figure captures rapid changes in surface and subsurface glacial features including esker tunnels, undercutting and ice-bridge collapse. The image A shows an orthomosaic dated 13 May 2023. Annotated labels identify surface hydrology, esker tunnel, new esker tunnel collapse, esker tunnel retreat and collapse, ice bridge, fracture parallel to glacier margin and undercutting. The image B shows an orthomosaic dated 1 June 2023 with the same set of annotated labels, allowing direct comparison with image A. Changes in the positions and extent of labeled features are visible between the two dates. The image C shows a difference map representing elevation change between the two orthomosaic dates. Labels match those in images A and B. Areas of elevation change are visible across the glacier surface. A masked area covers water. The image D shows an oblique UAV view dated 26 May 2023. Labels visible in this image include surface hydrology, esker tunnel, new esker tunnel collapse, esker tunnel retreat and collapse, ice bridge collapse and undercutting. Arrows in the image point to specific features. The image E shows a waterfall on the glacier surface, corresponding to the surface hydrology location marked in images A through C. The image F shows a close-up of a crack in an esker tunnel roof. An arrow points to the crack location near the western esker. The image G shows the western esker supraglacial channel. Arrows point to undercutting visible in the channel walls. An arrow also indicates a very thin esker tunnel roof. The image H shows undercutting at the glacier margin. One arrow indicates a tunnel entrance and another points to undercutting. This location corresponds to the undercutting arrow in images A through C. The image I shows a view looking upward at the edge of a thinning esker tunnel roof. The image J shows a view looking upward at a glacial tunnel roof containing skylights, described as irregular shaped holes in the ice visible in the center of the image. The image K is dated 13 May 2023 and shows an intact ice bridge. The image L is dated 27 May 2023 and shows the same ice bridge in a collapsed state.
At the glacier margin, undercutting is apparent throughout the field season (Fig. 10g, h). Undercutting can lead to hazardous collapse. On 13 May, blocks of ice were observed on the ground in front of the glacier snout that had presumably calved due to sudden fracture. Undercutting is also observed within the supraglacial channel walls (Fig. 10g). A fracture that is parallel to the glacier margin was observed to increase in size between 13 May and 1 June (Fig. 10a–c), which also indicates undercutting and incipient dry calving. Fractures such as this were also observed in August 2024, at a much larger scale (pink arrows in Fig. 4).
The ice tunnels from which the esker emerges can be hazardous if the ice roof collapses. Figure 10a shows a collapsed esker conduit observed on 13 May. The tunnel that was explored in this work (Fig. 7) represents a potential hazard for collapse. No collapse was observed at this tunnel during our field campaign, but the roof was observed to be thinning (Fig. 10i). Other esker tunnel roofs were observed to contain fractures that could indicate instability (Fig. 10f). In August 2024, an ice tunnel roof was observed with ‘skylights’ through the ice, indicating that the ice thinned nonuniformly creating an increased hazard for roof collapse (Fig. 10j).
The eastern esker that was observed to emerge throughout the 2023 field season (Figs 4 and 6) appeared as glacier ice dramatically thinned over the time period, revealing pits and channels associated with the esker. These pits and channels represent subsurface channels and void spaces that were present in the glacier prior to being revealed, but no evidence of their existence was observable prior to being revealed. The rapid thinning of the ice introduces hazardous conditions in which an unknown englacial tunnel roof could collapse if it were to be walked across when the roof is thin enough to be unstable but thick enough to be unrecognizable. In addition to the esker-hosting englacial tunnels, other subglacial tunnels were observed. The tunnel shown in Fig. 10h (yellow arrow) was observed only on 31 May and 1 June. The presence of additional, smaller sinuous ridges (white arrows in Fig. 4c) near the eastern esker in 2024 also suggests that a network of sub- or englacial tunnels may have existed within the glacier ice during the 2023 field season. These observations show that multiple sub- and/or englacial tunnels were being revealed during a time period of only a few weeks. The abundant supraglacial and subglacial meltwater supply also travels through fractures within and beneath the glacier ice, which creates these tunnel systems. These abundant tunnels create a hazardous environment because the ice is also rapidly thinning above these void spaces, which could catastrophically collapse. This dataset captures the development of glacial karst features, described by Clayton (Reference Clayton1964) and Mavlyudov (Reference Mavlyudov2006). As the ice thins and becomes stagnant, glacial karst features evolve from small moulins (e.g. Fig. 3a, September 2021) into more mature features such as caves and residual ice blocks (e.g. Fig. 10l, May 2023).
The largest collapse feature observed in this time period was an ice bridge that was present on 13 May (Fig. 10k) but had collapsed by 21 May (Fig. 10l). This feature completely melted by 3 June. This ice bridge is interpreted to be part of the esker-forming tunnel(s) (Fig. 4d).
We note that this week-long change detection work occurred in May, early in the melt season. May can capture ‘speed-up events’ (i.e. in Hart and others, Reference Hart, Baurley, Bonnie, Robson, Bragg and Martinez2025) at the beginning of the melt season, and our results indicate that structural glacier hazards are clearly present in the spring. However, our week-long change detection study conducted in May likely does not capture the peak of the melt season, and therefore the potential hazards in the middle-to-end of a melt season when more meltwater is being generated could be under-represented in this dataset.
7. Implications
7.1. Implications for interpreting eskers in the landscape
The results from this study support the hypothesis that there are numerous ways that englacial eskers can be modified after they emerge from a glacial conduit. In addition to the esker evolution paths presented in Lally and others (Reference Lally2023) and in Fig. 9, we observed esker enlargement occur at an englacial esker in a supraglacial ice-walled channel (hummocky and irregular in Fig. 3). Additionally, we find that an esker can experience erosion while it is still within the glacial conduit (Fig. 7c).
These results imply that with the right preservation conditions, the morphology of some eskers preserved in the paleoglacial record does not necessarily reflect the conditions of the glacial conduits in which they were deposited. If there is a question as to whether an esker was deposited subglacially or englacially, then one should not assume that the long-studied melt dynamics of subglacial eskers will apply. Eskers are the most prominent evidence in postglacial landscapes of previously existing glacial hydrologic networks, but care must be taken when using their morphologic properties to interpret glacier basal conditions. Our results strongly support the concept of equifinality in esker morphology that has been previously proposed (Storrar and others, Reference Storrar, Evans, Stokes and Ewertowski2015; Lally and others, Reference Lally2023). There are many depositional and evolutionary paths that can produce typical esker morphologies.
While this study focuses on morphological evolution, we observed the internal stratification to evolve on annual timescales as well (Fig. S4). Studies of esker sedimentology and stratigraphy should use caution when interpreting preserved stratigraphy and account for the potentially extensive morphologic evolution of englacial eskers. The esker was observed to initially display internal stratification that reflected primary depositional processes in the glacial conduit, but then that record was disrupted and destroyed due to subsequent melting of an ice core in the esker.
7.2. Englacial eskers: conditions for formation and their long-term preservation
Monitoring and mapping of the emerged esker over 3 years enabled the characterization of how englacial eskers evolve (see Section 5.1) and provides an outlook for the long-term preservation of englacial eskers in the landscape. By August 2024, much of the englacial esker had been eroded and/or was overtopped by the proglacial lake. However, the main esker segment was still intact on the proglacial lake shore and was recognizable as an esker (although its footprint had decreased). There is the possibility of future continued erosion; for example, the state of the ice core in the main esker segment in August 2024 is unknown and could continue melting; the glacial outwash or proglacial lake levels could shift and reinitiate erosion of the esker. However, the main esker segment is now located roughly 200 m from the glacier margin and the most dynamic part of the glacial hydrologic system, so it is likely that this esker segment will be preserved in the landscape for some interval. Additionally, the eastern esker segments revealed in August 2024 were also located on the shore of the proglacial lake and could similarly be preserved. In the future, there is a possibility of subglacial eskers emerging as the ice-cored terrain evolves within the overdeepening, as described in Lally and others (Reference Lally2025), who mapped pitted glaciofluvial deposits within the overdeepened area west of the esker examined in this study. The foreland east of the lateral edge of the overdeepening appeared stable over our study period (2021–25), and vertical losses were not noted in the UAV dataset. Future field studies of this site should address the outstanding question as to whether these eskers still contained a significant ice core in August 2024, and whether additional melting caused significant modification to the landforms.
These interpretations yield implications for the conditions required to form and preserve englacial eskers. The Breiðamerkurjökull field site appears to be at the lateral edge of an overdeepening, with a reverse slope bed imaged on radargrams by Lally and others (Reference Lally2023). In such overdeepened areas, like neighboring Fjallsjökull to the southwest (Evans and others, Reference Evans, Ewertowski, Tomczyk and Chandler2023), glacial meltwater networks tend to bypass the overdeepening due to a raised hydraulic head at the ice margin, resulting in a well-developed englacial drainage system. Our work further supports this, as englacial eskers continue to form at lower elevations as the glacier retreats (i.e. crest profile B, Fig. 3) in response to both thinning ice and a retrograde slope bed. Proglacial lakes often develop within overdeepenings as they flood with meltwater during ice retreat, which is observed at our field site. If an englacial esker tunnel were to emerge directly into the proglacial lake, any esker sediment would be deposited into and reworked by the lake, precluding any possibility of preservation as an esker landform. The emerging eskers observed in this study were emplaced near the edge of the proglacial lake, which is interpreted to be the lateral edge of the overdeepening. The esker segments that occur within the lake appear as islands and are quickly eroded by lacustrine processes. Other esker segments in our field site are perched on the lake shore margin, with one flank bounded by water and the other flank bounded by the proglacial plain. The complex segment of the eastern esker is located on the proglacial plain, but we do not have sufficient data to interpret how this complex esker was emplaced (sub-, en- or supraglacially), so it is excluded from this discussion. The esker segments located within the overdeepened area are heavily eroded, while the esker segments located to the east of the overdeepened area (i.e. east of the lake) appear to be better preserved.
Therefore, we propose that englacial eskers have the best preservation potential at the edge of an overdeepened area (any edge, either lateral, proximal or distal). Englacial eskers tend to form in times of glacial retreat when there is abundant water in the system that enhances the production of englacial conduits. Any of these conduits could host an esker if an adequate sediment supply exists. However, in order for an esker to be preserved, the esker conduit must emerge from the glacier near an edge of the overdeepening. If an esker-containing conduit emerges in the center of the overdeepening, the sediment will likely be deposited in the proglacial lake and will either immediately be distributed within the lake or will be eroded by the water/ice/esker interactions (Fig. 9f). In either scenario, an esker will not be preserved in the paleoglaciologic record. An englacial esker is less likely to be formed outside of an overdeepening, as those areas have a lower hydrologic head, which favors subglacial drainage networks. Therefore, the edge of the overdeepening represents a ‘Goldilocks’ situation where englacial eskers are likely to be deposited and also could potentially be preserved.
The geometry of the overdeepening will also likely play an important role in the preservation of englacial eskers. The evolution of the englacial esker presented here (Fig. 3) and the proglacial lake indicate that the edge of the overdeepening trends SSW-NNE. The main esker segment exposed between 2021 and 2022, which sits furthest west from the edge of the overdeepening, was not preserved. This is in contrast to the remaining part of that esker segment (labeled ‘main esker segment’ in Fig. 2), which, although the crest migrated east (Fig. 3 cross-profile A), was preserved during our study period, as it is likely within this ‘Goldilocks’ zone.
We note that this hypothesis for englacial esker preservation in an overdeepened Goldilocks zone is separate from the implications for preservation related to the presence of an ice core. The model for esker evolution presented in Fig. 9 includes the development of a significant ice core within an englacial esker. At our field site, we found that an esker ∼5 m in height contained an ice core only ∼25 cm beneath the esker surface. An ice core within an esker will eventually melt, and if the ice core is large enough, this can cause the morphology to be disrupted such that it is no longer recognizable as an esker. In the model proposed in Fig. 9, the sediment-to-ice core ratio (which will influence whether the esker is preserved in the paleoglaciologic record) is dependent on the initial amount of esker sediment at the time the esker emerges as well as the height of the tunnel floor above the subglacial bed (H tf).
Finally, as noted in Lally and others (Reference Lally2023) and supported by these results, interactions with proglacial lakes and streams also can contribute to erosion of an esker formed englacially.
We can examine this hypothesis at other glaciers close to Breiðamerkurjökull. Many of the glaciers in this area have excavated troughs in the underlying bedrock, indicating that as the glaciers retreat, they will continue to reveal overdeepened areas that are expected to fill with meltwater (Magnusson and others, Reference Magnússon, Pálsson, Björnsson and Guðmundsson2012). The location of englacial eskers at neighboring Fjallsjökull and Hrútárjökull (Chandler and others, Reference Chandler2020; Evans and others, Reference Evans, Ewertowski, Tomczyk and Chandler2023) is consistent with our hypothesis. Englacial eskers were mapped alongside a topographic high at the edge of an overdeepening at Fjallsjökull and have likely been preserved due to rerouting of glacial meltwater, which now drains away from the landforms. Hrútárjökull englacial eskers were mapped at the edge of the proglacial lake, similar to those presented in this work.
The nearby Kvíárjökull glacier exhibits an alternate path for englacial eskers not observed at Breiðamerkurjökull. This glacier is also retreating over an overdeepened foreland, and Bennett and Evans (Reference Bennett and Evans2012) identify an englacial esker that sourced sediment to supra-marginal outwash fans, thus bypassing the overdeepening. The englacial eskers at Kvíárjökull were interpreted to be revealed by ablation, such that after they emerged they were located on top of an actively eroding supraglacial frontal debris band (Bennett and Evans, Reference Bennett and Evans2012). This debris band is hypothesized to generally have a very low preservation potential, and the entire area is anticipated to experience future de-icing and meltout of buried glacier ice, resulting in commonly observed hummocky kame and kettle topography (Bennett and Evans, Reference Bennett and Evans2012). Based on these interpretations, we suggest that an englacial esker deposited in the center of an overdeepening in this context will also have a low preservation potential given the expected disruption to the geomorphology of the area due to de-icing and meltout of the underlying glacier ice.
Englacial eskers face a challenging path to preservation in the paleoglaciologic record. First, an englacial esker must be deposited within an overdeepening Goldilocks zone. The esker must contain sufficient sediment to remain prominent once the ice core melts. If the sediment is thin across the entire ice-cored feature, once the ice core melts, the sediment will not be distinguishable from the surrounding unconsolidated foreland sediments. Finally, the esker must avoid extensive erosion by proglacial lacustrine and fluvial processes. Englacial eskers may be more likely to be preserved if they are emplaced on an outwash plain, located either in a dry overdeepening or outside of an overdeepening, which would reduce potential erosion from a proglacial lake. However, eskers are not as likely to be deposited in this setting, as the raised hydraulic head of the flooded overdeepening is typically the catalyst to the creation of englacial conduits. We conclude that while it is possible for englacial eskers to be preserved, it is likely that many are not preserved or are preserved only as heavily eroded landforms. This improved understanding of where englacial eskers are likely to be preserved could inform future glacial geomorphological studies of paleo-landscapes. If englacial eskers were common across overdeepened areas once covered by paleo-ice sheets, their identification would improve estimates of meltwater supply and reconstructing glacial drainage systems during deglaciation. These findings indicate that identified englacial eskers likely do not reflect the entire population of meltwater conduits. In particular, englacial eskers that have been preserved in the paleoglaciologic record likely represent a specific subset of meltwater pathways that occurred at the edge of overdeepenings or were deposited in a less expected dry overdeepening or outwash plain.
These interpretations developed from studying an englacial esker located in Iceland are likely specific to temperate glaciers. At cold-based glaciers, representing a distinct depositional glacial setting where subglacial meltwater is scarce and debris is frozen to the bed, different mechanisms for sediment and water supply would be required to replicate the conditions observed in this study. Subglacial eskers have been observed at a range of small, high-Arctic polythermal glaciers (i.e. McCerery and others, Reference McCerery2025). Englacial debris layers, forming by glaciotectonics, have been observed near the ice margin at a polythermal glacier in Sweden (Glasser and others, Reference Glasser, Hambrey, Etienne, Jansson and Pettersson2003). In this situation where englacial debris is available and there was a mechanism to generate englacial meltwater tunnels from supraglacial melting, englacial eskers could theoretically be formed. More work is needed to understand esker development and preservation potential at polythermal and cold-based glaciers, especially as these systems evolve in a rapidly warming climate.
7.3. Rapid landscape evolution, climate change and glacial hazards
These results indicate that change is observable at the Breiðamerkurjökull field site on rapid (∼week) timescales. Our detailed analysis revealed significant landscape change over the course of 2–3 weeks, and small-scale change was observed daily while in the field. The observations show how quickly this glacier evolved, with new potential hazards appearing on the scale of days. Hazard assessments may be accurate in the morning, but then by the afternoon or the next day the ice may thin such that an englacial tunnel is now poised to collapse into a pit. This assessment was conducted in the early melt season, and future investigations could reveal whether the hazard risks at the ice front vary throughout the melt season.
The appearance of englacial eskers emerging from a glacier margin can be considered an indicator for enhanced glacial hazards. Englacial eskers tend to occur during glacial retreat when there is abundant meltwater in the system. This abundant meltwater is typically a result of enhanced surface melting of the glacier, which results in increased potential hazards (see Section 6.3 for many examples from the field site). Additionally, englacial eskers form in englacial tunnels. As demonstrated by our results, there was not merely a single englacial tunnel at the field site; instead, there were many englacial tunnels present in the glacier during the field season. Tunnels within a glacier contribute to potentially hazardous glacial collapse.
Others have found that glacial hazards are increasing due to climate change (i.e. Harrison and others, Reference Harrison2018; Egli and others, Reference Egli, Belotti, Ouvry, Irving and Lane2021). While we do not have pre-climate change elevation change datasets at this field site, historical records of this area indicate that most of the eskers have been subglacially deposited. We note that many of the eskers preserved in the broader Breiðamerkurjökull proglacial plain are interpreted to be subglacial eskers (Evans and Twigg, Reference Evans and Twigg2002; Boulton and others, Reference Boulton, Lunn, Vidstrand and Zatsepin2007; Lally and others, Reference Lally2023), but also note that englacial eskers may not be preserved in the landscape, as observed in this study. An abrupt change from a majority of subglacial eskers being emplaced to a majority of englacial esker emplacement in our study area is likely due to rapid glacial retreat (stemming from general warming trends) that is increasing the amount of meltwater in the system while at the same time is revealing an overdeepening. Increasing supraglacial melt also raises the hydrologic head of the glacial drainage system, for example, which promotes englacial conduit formation. Therefore, an increase in englacial eskers and an increase in glacial hazards could both be related to general warming trends. We posit that as the climate continues to warm, more glaciers will experience these shifts and englacial eskers may become more commonly formed. In particular, the glaciers in Southeast Iceland are all experiencing rapid retreat with many revealing overdeepenings (Magnusson and others, Reference Magnússon, Pálsson, Björnsson and Guðmundsson2012), and therefore englacial eskers may become more common in the near future. Looking further ahead, once the piedmont lobes from the Southeast Iceland glaciers have retreated back to the plateau, they will have also retreated past their overdeepenings. Therefore, the conditions conducive to englacial eskers being formed (rapid retreat + an overdeepening) will no longer be present, so at that point englacial eskers may be less likely to form.
Several of the processes proposed in our esker evolution models could also be related to general warming trends and increased meltwater in the system. For example, eskers perching on top of ice pedestals may be a result of this abundant water. Eskers are formed when sediment is deposited by water in a glacial tunnel. With increased meltwater in the system, the ratio of sediment to water decreases. This could cause the erosion of the tunnel rather than deposition of esker sediment within the tunnel. Similarly, the observed supraglacial esker enlargement could have occurred because of the rapid melting and abundant water in the system. The englacial esker tunnel roof melted more quickly than the tunnel/channel walls, leading to a supraglacial channel that could source more water and be widened more easily. Indeed, Dewald and others (Reference Dewald, Lewington, Livingstone, Clark and Storrar2021) found that subglacial esker enlargements are more abundant in areas of faster ice retreat and could have contributed to a positive feedback of ice-sheet retreat. This is consistent with our interpretation that the supraglacial esker enlargement occurred in an area of rapid ice retreat.
These observations from Breiðamerkurjökull serve as a record for future reference and a timely reminder that glacial melting and associated glacial hazards, such as glacier avalanches, marginal collapse, paraglacial rockfall and glacial outburst floods, are expected to increase due to climate change (Harrison and others, Reference Harrison2018; Egli and others, Reference Egli, Belotti, Ouvry, Irving and Lane2021).
8. Summary and conclusions
In our 3 year study of an emerging englacial esker at Breiðamerkurjökull in southeastern Iceland, we observed roughly 320 m of retreat (∼ 100 m annually) and between 10 and 30 m of downwasting at the glacier. Esker evolution was monitored annually, seasonally and over the span of several weeks. Extending the observation period of the emerging esker and examining smaller-scale weekly changes (as compared to Lally and others, Reference Lally2023) allowed multiple paths of esker evolution to be identified.
Esker sediment was observed to be perched on ice pedestals both inside the englacial tunnel and after the esker had emerged from the tunnel. Cross sections of eskers were observed to include substantial ice cores. We propose that englacial eskers are not always ‘lowered’ onto the proglacial plain as the glacier retreats. Instead, the englacial eskers can have an ice core that contains all the glacier ice that was beneath the englacial tunnel, such that the height of the esker upon separation from the glacier was related to the thickness of the glacier ice below the tunnel. Additionally, esker morphology was observed to evolve after the esker emerged from the glacier. The modification and evolution also impacted the stratigraphy recorded within the esker. We interpret post-emergence, supraglacial esker enlargement to have occurred, which represents another path of englacial esker evolution and reflects the glacier’s rapid retreat. These results indicate that esker morphology and stratigraphy observed in englacial eskers preserved in the paleoglacial record do not necessarily reflect conditions in the glacial conduit. This analysis supports the concept of equifinality in esker morphology, such that multiple paths can lead to the same esker morphology.
We propose that englacial eskers that are deposited at the edge of an overdeepening may be more likely to be preserved in the landscape than englacial eskers deposited elsewhere, representing a ‘Goldilocks’ zone where englacial eskers can be both emplaced and preserved. However, englacial eskers can also be quickly modified into subdued terrain if they contain a significant ice core that melts and disrupts the morphology. Englacial eskers can additionally be eroded by interactions with proglacial lakes and streams. Therefore, we conclude that while it is possible for englacial eskers to be preserved, it is likely that a majority are not preserved in the paleoglaciologic record. This has implications for using esker spacing as a proxy for meltwater production during deglaciation because if englacial eskers were deposited but not preserved, the amount of meltwater could be significantly underestimated using only preserved landforms. Further, if englacial eskers are preferentially preserved on the edge of overdeepenings, the preserved eskers would only represent a specific subset of meltwater pathways and would not accurately represent the broader glaciohydrologic system.
Enhanced top-down melting and rapid thinning of glaciers due to climate change are resulting in conditions conducive to englacial conduits. In particular, as the glaciers in Southeast Iceland retreat and reveal overdeepenings, englacial eskers and associated glacial hazards are expected to become more common.
Supplementary material
The supplementary material for this article can be found at https://doi.org/10.1017/jog.2026.10129.
Data availability statement
All data used in this paper are archived in the USGS Data Release at https://doi.org/10.5066/P1MCM7RE (Bennett and others, Reference Bennett2025).
Acknowledgements
This work was funded by NASA SSW award 80NSSC21K0908. Lally was funded by UKRI QUADRAT DTP (NE/S007377/1). For M.H., work was supported by NASA under award number 80GSFC21M0002. Any use of trade, firm or product names is for descriptive purposes only and does not imply endorsement by the US Government. We thank Ben Stoker and Rob Storrar for providing insightful reviews that improved the manuscript. We gratefully acknowledge the staff of Vatnajökull National Park, particularly Sigurður Óskar Jónsson, for helpful discussions and for granting us research permits, and the Icelandic Institute of Natural History for granting us sample export permits. Thanks to Rob Storrar and Frances Butcher for their help with planning, both logistical and scientific. Thank you to Gunnar Gudjonsson and Daniel Leeb for helpful logistics discussions and the loan of glacier safety equipment. Deepest thanks to Ryan Ewing, Mary Barger, Fred Nials, Laurie Rogers and Jean-Francois Smekens for in-field support. We also acknowledge the contributions to field team morale by Wren Ewing, Ayla Edwards, Maisie Edwards, Léo Smekens Rutledge and Zazie Smekens Rutledge. We thank the UK-based field team for providing their data: Alastair Ruffell, Andrew Newton, Rob Storrar, Thorsten Kahlert and Conor Graham.


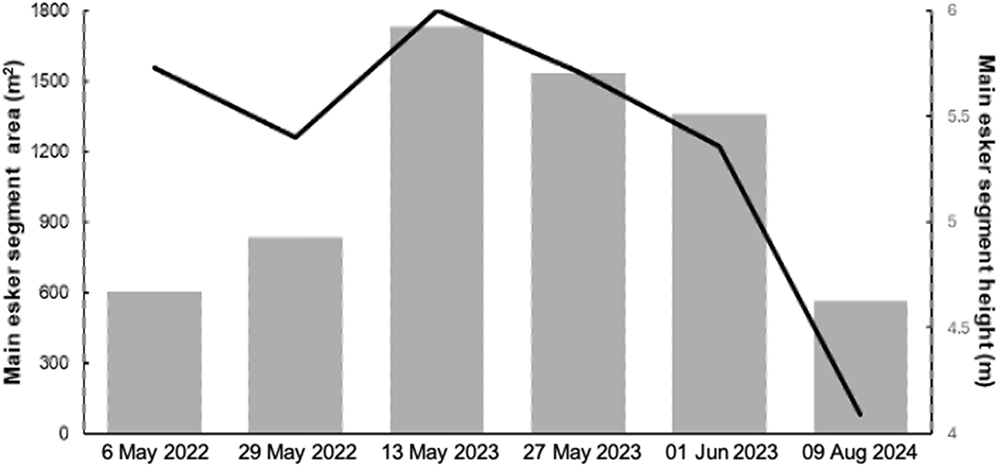


 Open access

