Implications
To combat the variable eating quality of beef, which is a major factor in declining beef consumption, the European beef industry needs an accurate and reliable description of eating quality. These results demonstrate that a single score can accurately describe a consumers eating experience, and therefore could be used to form the basis of a commercial eating quality grading scheme. If this model is pursued, the industry must continue to evaluate consumer assessment of eating quality, as there are indications that the relative importance of different sensory traits will change over time.
Introduction
Quantifying consumer responses to beef across a broad range of demographics, nationalities and cooking methods is vitally important for any system guaranteeing beef eating quality to the consumer. Within Europe, the introduction of an eating quality guarantee system would be well accepted by consumers and strengthen the European beef industry (Verbeke et al., Reference Verbeke, Van Wezemael, de Barcellos, Kügler, Hocquette, Ueland and Grunert2010). However, there are many diverse cultures with different cooking preferences, and it is unknown if a single system could accurately predict consumer responses to beef across Europe. One system that has the potential to reliably predict the eating quality of beef in Europe is the Australian quality prediction system called Meat Standards Australia (MSA). This system was judged uniquely innovative by French experts (Hocquette et al., Reference Hocquette, Botreau, Picard, Jacquet, Pethick and Scollan2011) and is 50% to 70% accurate in allocating beef to one of four categories; unsatisfactory, good-every-day, better-than-every-day or premium using inputs known to impact on palatability (Thompson, Reference Thompson2002; Polkinghorne, Reference Polkinghorne2006). At present, the MSA system is largely used within Australia, however, it has also been tested in a number of other countries including Korea, Japan, South Africa and France (Hocquette et al., Reference Hocquette, Van Wezemael, Chriki, Legrand, Verbeke, Farmer, Scollan, Polkinghorne, Rødbotten, Allen and Pethick2014).
At the same time that consumers allocate meat samples to quality grades, they also score the same sample for tenderness, juiciness, flavour-liking and overall-liking. Australian and Japanese experiments have shown strong correlations between these four sensory scores ranging from 0.70 to 0.99 (Thompson et al., Reference Thompson, Polkinghorne, Hwang, Gee, Cho, Park and Lee2008; Polkinghorne et al., Reference Polkinghorne, Nishimura, Neath and Watson2011). In contrast, the correlations for the Korean and South African consumers were more variable (0.31 to 0.76, 0.38 to 0.96) (Thompson et al., Reference Thompson, Polkinghorne, Hwang, Gee, Cho, Park and Lee2008 and Reference Thompson, Polkinghorne, Gee, Motiang, Strydom, Mashau, Ng’ambi, deKock and Burrow2010). In all tested countries, the correlations were quite consistent between diverse cattle groups and cooking methods. The consistency of these correlations suggests that they will be strongly present wherever consumers are tested, indicating some common eating behaviours of consumers towards beef in spite of the cultural diversity of these countries.
Initial consumer panels in Australia indicated that tenderness was the most important factor determining the quality grade of a piece of beef (Watson et al., Reference Watson, Polkinghorne and Thompson2008a). However, in recent years more recent Australian consumer testing has described flavour-liking as having equal importance with tenderness (Thompson et al., Reference Thompson, Polkinghorne, Gee, Motiang, Strydom, Mashau, Ng’ambi, deKock and Burrow2010). Work by Legrand et al. (Reference Legrand, Hocquette, Polkinghorne and Pethick2013) demonstrated that French consumers also considered flavour and tenderness to be equally important. However, in both Japan and South Africa, flavour-liking was the most important determinant of consumer satisfaction (Thompson et al., Reference Thompson, Polkinghorne, Gee, Motiang, Strydom, Mashau, Ng’ambi, deKock and Burrow2010; Polkinghorne et al., Reference Polkinghorne, Nishimura, Neath and Watson2011). Therefore, we expect that the importance of different sensory characteristics will vary between different countries.
This paper looks at consumers from France, Poland, Ireland, Northern Ireland and Australia, who tasted beef cooked by four different cooking methods. Based on the balance of the testing in other countries and of different cooking methods, we hypothesise that the consumer assessed sensory scores will be able to accurately predict the consumer assessed quality grades. However, we also expect that the importance of each sensory score in determining the quality grades of beef will vary between countries despite being strongly correlated with each other.
Material and methods
Consumer demographics
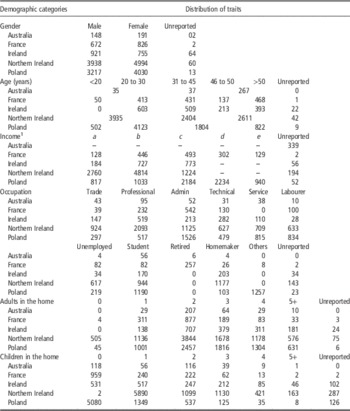
The consumer demographics are described in Table 1. In brief, there were 19 492 consumers, with each individual consumer scoring six beef samples. In addition to scoring beef samples, consumers also answered a demographic questionnaire (Table 1). The English version of this questionnaire is detailed by Anonymous (2008). In all countries, there were slightly more female than male consumers, except for Ireland. The majority of consumers came from households with one to three adults and zero to two children (Table 1).
Number of consumers within each of the demographic categories for each country who scored beef samples

Admin=administration.
1 Income categories are different for each country. France (€/month): a=<1000, b=1000 to 2000, c=2000 to 3000, d=3000 to 4000, e=>4000; Ireland (€/year): a=<20 000, b=20 000 to 50 000, c=>50 000; Northern Ireland (£/year): a=<20 000, b=20 000 to 50 000, c=>50 000; Poland (zł/month): a=⩽1000, b=1001 to 1400, c=1401 to 2200, d=2201 to 4000, e=>4000.
Animals and muscle samples
The carcasses used for this experiment are described in detail by Bonny et al. (Reference Bonny, Hocquette, Pethick, Farmer, Legrand, Wierzbicki, Allen, Polkinghorne and Gardner2016a). In brief, the data set was formed through combining the records of a number of specific, smaller, experiments. As a result, this data set provides a cross-section of European cattle types from France, Poland, Ireland and Northern Ireland. The cattle were slaughtered commercially according to standard practice in each country. There was a range of 5 to 28 days postmortem wet ageing at 1°C in vacuum pack bags. A total of 25 different muscles were collected, though not all muscles were collected from each carcass.
Meat preparation and consumer panels
Muscle samples were prepared for consumer testing by four different cooking methods, grill, roast, slow cook and Korean barbeque, and three different levels of cooking doneness, rare, medium and well done, according to protocols for MSA testing by personnel trained in MSA testing procedures (Anonymous, 2008; Watson et al., Reference Watson, Gee, Polkinghorne and Porter2008b; Legrand et al., Reference Legrand, Hocquette, Polkinghorne and Pethick2013). A brief description of the cooking methods, including preparation and final cooking doneness, which have been employed in this experiment has also been published by Bonny et al. (Reference Bonny, Pethick, Legrand, Wierzbicki, Allen, Farmer, Polkinghorne, Hocquette and Gardner2016c). The grill cooking method was performed in all countries and the roast cooking method was performed in all countries except for France. The slow cooking method was only tested in Poland and the Korean barbeque was tested in Ireland. Each consumer scored samples prepared by a single cooking method, cooked to a single cooking doneness. Not all muscles were prepared by each cooking method, the distribution of muscles and cooking method is described in more detail by Bonny et al. (Reference Bonny, Pethick, Legrand, Wierzbicki, Allen, Farmer, Polkinghorne, Hocquette and Gardner2016c). A consumer received and evaluated seven meat portions: in every case the first portion was derived from either a generic striploin or rump muscle and expected to be of average quality. The remaining six portions were derived from different muscle samples selected to present each consumer with a diverse quality range, from poor to excellent, which were served in accordance with a 6×6 Latin square to balance potential order effects, as described by Watson et al. (Reference Watson, Polkinghorne and Thompson2008a).
Consumers scored meat from their country of origin, except for two sessions where meat was tested between Poland and France in a complete factorial design. In all countries, consumers were sourced through both commercial consumer testing organisations and local clubs and charities. They were selected to reflect the general population. Consumers scored samples for tenderness, juiciness, flavour-liking and overall-liking, by making a mark on a 100-mm line scale, with the low end of the scale representing poor acceptability and the high end of the scale representing high acceptability. Consumers were also asked to allocate each sample into one of four categories that best described the sample; unsatisfactory, good-every-day, better-than-every-day or premium quality. For a more detailed description of the testing procedures and the questionnaire see Anonymous (2008).
Statistical analyses
The ability of the four sensory scores (tenderness, juiciness, flavour-liking and overall-liking) to predict the consumer grades (unsatisfactory, good-every-day, better-than-every-day and premium) for the entire data set was calculated using a linear discriminant function (PROC DISCRIM SAS v9.2) (SAS, 2002). This was also performed for subsets of the data split into separate muscles, cooking methods and cooking doneness by country. From these results, we can also effectively compare the quality grades, and in particular locate the point where a consumer is deciding between two adjacent categories. This point is assumed to be where adjacent functions are equal and is calculated by subtracting one adjacent function from the other. The boundary between those two quality grades (a number from 0 to 100) is calculated as the intercept after the resulting equation is divided by the sum of the coefficients for the four sensory scores. This procedure, including the discriminant analysis and boundary determination, was repeated using two different weighted combinations of the four sensory scores. The weightings used were the current weightings, employed by the Australian MSA model current meat quality 4 score (cMQ4): 0.3×tenderness, 0.1×juiciness, 0.3×flavour-liking and 0.3×overall-liking (Thompson et al., Reference Thompson, Polkinghorne, Gee, Motiang, Strydom, Mashau, Ng’ambi, deKock and Burrow2010), and the initial weightings (original meat quality 4 score (oMQ4)) used when the MSA model was first developed: 0.4×tenderness, 0.1×juiciness, 0.2×flavour-liking and 0.3×overall-liking (Watson et al., Reference Watson, Gee, Polkinghorne and Porter2008b). Optimal weightings for the sensory scores were calculated averaging the discriminant functions as performed by Watson et al. (Reference Watson, Gee, Polkinghorne and Porter2008b). The discriminant procedure was performed both with and without overall-liking, and then the two resulting functions averaged to redistribute more of the components of overall-liking back to the other sensory scores. This was performed for all the data and for each country individually.
Results
Allocation of beef samples to different quality grades by untrained consumers
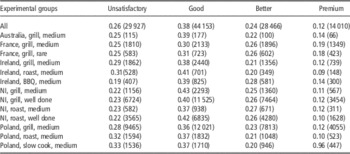
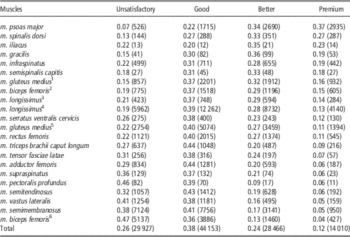
The proportion of samples allocated by consumers to each of the four quality grade was relatively consistent between the different experimental groups (Table 2). In all cases, the good-every-day category contained the highest proportion of samples, ranging from 30% to 42%. In contrast, consumers only considered 10% to 19% of samples tested to belong to the premium category. The Irish consumers tasting grilled and roasted samples, and the Polish consumers overall considered a higher proportion samples to be unsatisfactory than other consumer groups. In total, 15 out of 22 muscles tested had over 20% of the samples classified as unsatisfactory. And for five of those muscles this increased to over 35% (Table 3). In contrast, consumers classified over 20% of samples from the m. iliacus, m. spinalis dorsi and m. psoas major, as premium quality.
Frequency distribution (and number of samples) of eating quality grades allocated to beef samples by untrained consumers across countries, cook methods and degrees of doneness

Good=good-every-day; Better=better-than-every-day; BBQ=Korean barbeque; NI=Northern Ireland.
Cooking methods degrees of doneness are described by Bonny et al. (Reference Bonny, Pethick, Legrand, Wierzbicki, Allen, Farmer, Polkinghorne, Hocquette and Gardner2016c) and Anonymous (2008).
Frequency distribution (and number of samples) of eating quality grades allocated to beef samples by untrained consumers across the different cuts tested

Good=good-every-day; Better=better-than-every-day.
1 Eye of rump.
2 Rump cap.
3 m. longissimus thoracis et lumborum, Cube roll.
4 m. longissimus thoracis et lumborum, Striploin.
5 Eye rump centre.
6 Silverside.
Simple correlations between sensory scores
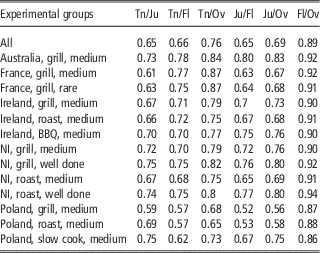
All of the sensory scores were highly correlated (Table 4). Overall-liking and flavour-liking had the strongest correlation of all the sensory scores for all of the countries, cooking methods, cooking doneness levels, the correlation between overall-liking and flavour-liking were ⩾0.9 (P<0.05) except for the Polish scores, which were ⩾0.86 (P<0.05). Similarly, overall-liking and tenderness had the second highest correlations across all the groups. The scores for the Polish grill and roast generally had lower correlations between the sensory scores than the rest of the data. Juiciness and flavour-liking were the least correlated of all the sensory scores, with values ⩾0.52 (P<0.001). Overall, the different muscles tested followed a similar pattern to the different countries, cooking methods and levels of cooking doneness (data not shown). Lower correlations, down to a minimum of 0.42 between flavour-liking and juiciness, were seen in muscles with less data (data not shown).
Simple correlation coefficients (P<0.001) between untrained consumer sensory scores for beef samples across all data or within sub-groups defined by their country, cook method and doneness

Tn=tenderness; Ju=juiciness; Fl=flavour-liking; Ov=overall-liking; BBQ=Korean barbeque; NI=Northern Ireland.
Cooking methods degrees of doneness are described by Bonny et al. (Reference Bonny, Pethick, Legrand, Wierzbicki, Allen, Farmer, Polkinghorne, Hocquette and Gardner2016c) and Anonymous (2008).
Relative importance of sensory scores and the accuracy of the discriminant analyses
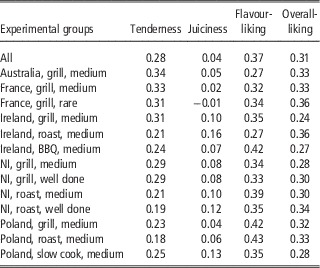
The importance of the sensory scores in determining the quality grades of beef were inferred from the discriminant analyses using all four sensory scores. In all cases, juiciness was the least important when consumers were determining the quality grade of beef (Table 5). Flavour-liking was the most important factor for consumers from Ireland and Poland. However, tenderness, flavour-liking and overall-liking were all of similar importance for Australian, French and Northern Irish consumers (Table 5).
Optimal weightings of sensory scores overall, and for each country from a discriminant analysis using the sensory scores to allocate beef to quality grades

BBQ=Korean barbeque; NI=Northern Ireland.
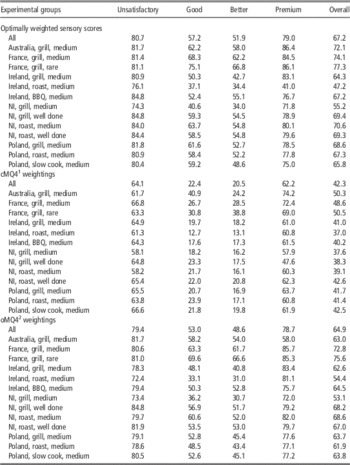
The accuracies of the three discriminant functions, using the optimally weighted sensory scores and two different composite scores, are shown in Table 6. The optimally weighted to sensory scores and the oMQ4 weightings were similar, and more accurate than the cMQ4 weightings. For all groups, the accuracy was higher at the extreme ends of the quality grades, categories unsatisfactory and premium. For the models with the optimally weighted sensory scores, and the oMQ4 weightings, an average of 81% and 79% of the samples were correctly allocated into categories unsatisfactory and premium. In contrast, only 57% and 49% of samples were correctly identified as either good-every-day or better-than-every-day (Table 6).
Percentage accuracy of the discriminate functions to allocate beef samples to the quality grade assigned by the consumer

Good=good-every-day; Better=better-than-every-day; BBQ=Korean barbeque; NI=Northern Ireland.
Expressed as a percentage of the number allocated to the correct grade relative to the number predicted for a particular grade.
1 cMQ4 (current meat quality 4 score)=a weighted combination (0.3, 0.1, 0.3, 0.3) of four sensory scores, tenderness, juiciness, flavour-liking and overall-liking.
2 oMQ4 (original meat quality 4 score)=a weighted combination (0.4, 0.1, 0.2, 0.3) of four sensory scores, tenderness, juiciness, flavour-liking and overall-liking.
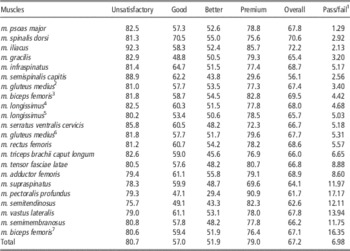
The accuracies for each muscle were highest for the unsatisfactory and premium categories, similar to the accuracy pattern for each country (Table 7). The accuracy of the discriminant analysis was similar for all muscles tested, with slight decreases in accuracy for muscles where there was less data. The average or overall accuracy of prediction for each of the muscles was similar, between 60% and 70% for all but two muscles. Muscle groups with accuracies <66% tended to have <1000 consumer responses (Tables 3 and 7). If all the samples categorised as unsatisfactory by the discriminant function were removed, then only 6.98% of the remaining samples would be unsatisfactory according to the consumer classification. This percentage varied by muscle with the m. psoas major only having 1.29% of unsatisfactory samples remaining, and the m. pectoralis profundus having 17.17%.
Percentage accuracy of the discriminate functions, using all four sensory scores, to allocate beef samples to the quality grade assigned by the consumer for each muscle

Good=good-every-day; Better=better-than-every-day.
Expressed as a percentage of the number allocated to the correct grade relative to the number predicted for a particular grade
1 Percentage risk that a consumer would have an unsatisfactory eating experience if purchasing beef classified as good-every-day, better, or premium by the discriminant analysis.
2 Eye of rump.
3 Rump cap.
4 m. longissimus thoracis et lumborum, Cube roll.
5 m. longissimus thoracis et lumborum, Striploin.
6 Eye rump centre.
7 Silverside.
Boundaries between the quality grades
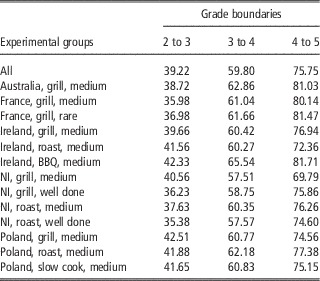
Boundaries between the quality grades calculated from the discriminant analysis using the optimally weighted sensory scores, split by country, cooking method and cooking doneness are shown in Table 8. There is little difference between the boundaries between the groups, with a maximum difference for the better-than-every-day to premium boundary of 12 points between the Irish Korean barbeque samples and the Northern Irish grill samples. The lower boundary cut-off was about five points lower for the French than the Polish, whereas the upper boundary was about five points higher for the French than the Polish. This is reflected in the greater range between the different cut-off points demonstrated by the French, with the upper and lower boundaries differing by ~44 points. In contrast, the Polish had the narrowest range, with the difference between the upper and lower boundaries only 32 to 35 points. Within a country the Northern Irish had the most variation in cut-off points, with the medium grill samples having a range between the upper and lower cut-off 10 points narrower than the well-done roast samples.
Grade boundaries calculated from the discriminate functions for the optimally weighted sensory scores (from Table 5)

2 to 3=grade boundaries between unsatisfactory and good-every-day scored beef; 3 to 4=grade boundaries between good-every-day and better-than-every-day scored beef; 4 to 5=grade boundaries between better-than-every-day and premium scored beef; BBQ=Korean barbeque; NI=Northern Ireland.
Discussion
Simple correlations between sensory scores
Supporting our hypothesis the European untrained consumer sensory scores for tenderness, juiciness, flavour-liking and overall-liking all had strong correlations, aligning well with similar studies in Australia and Japan (Thompson et al., Reference Thompson, Polkinghorne, Hwang, Gee, Cho, Park and Lee2008 and Reference Thompson, Polkinghorne, Gee, Motiang, Strydom, Mashau, Ng’ambi, deKock and Burrow2010; Polkinghorne et al., Reference Polkinghorne, Nishimura, Neath and Watson2011). Correlations were also similar between different cooking methods following the results of Thompson et al. (Reference Thompson, Polkinghorne, Hwang, Gee, Cho, Park and Lee2008). These results validate the protocol of combining the sensory scores into a single ideal meat quality 4 score (MQ4) score to describe the consumers eating experience. In addition, they potentially indicate that the use of a single score, such as overall-liking, may be sufficient for untrained consumers. However, the correlations between the sensory scores are not perfect, indicating some ability of untrained consumers to differentiate between certain sensory characteristics of beef, particularly flavour and juiciness. Further supporting this, the relative importance of flavour-liking in Australia has increased over the last 15 years (Watson et al., Reference Watson, Polkinghorne and Thompson2008a), possibly because the MSA system resolved a large proportion of the tenderness issues in the domestic market (Thompson et al., Reference Thompson, Polkinghorne, Hwang, Gee, Cho, Park and Lee2008).
Weightings of sensory scores to determine a single eating quality value
Aligning with the hypothesis, the weightings of the sensory scores differed between countries. For the Australian consumers, the calculated optimal weightings of the sensory scores for the MQ4 score closely match the formula currently used in the Australian MSA system (Thompson et al., Reference Thompson, Polkinghorne, Gee, Motiang, Strydom, Mashau, Ng’ambi, deKock and Burrow2010). This trend was similar for the French consumers with the results closely aligning with previously published work on the same consumers (Legrand et al., Reference Legrand, Hocquette, Polkinghorne and Pethick2013). Flavour-liking was more important in determining the MQ4 score in Ireland, Northern Ireland and Poland, similar to Japan and South Africa (Thompson et al., Reference Thompson, Polkinghorne, Gee, Motiang, Strydom, Mashau, Ng’ambi, deKock and Burrow2010; Polkinghorne et al., Reference Polkinghorne, Nishimura, Neath and Watson2011). This variation in the importance of tenderness and flavour-liking may relate to cultural differences between consumer groups (Lorenzen et al., Reference Lorenzen, Neely, Miller, Tatum, Wise, Taylor, Buyck, Reagan and Savell1999; Feuz et al., Reference Feuz, Umberger, Calkins and Sitz2004; Reicks et al., Reference Reicks, Brooks, Garmyn, Thompson, Lyford and Miller2011). In addition, standard beef production practices vary between countries and would also impact the quality of beef produced and therefore the relative importance in these markets. More work with balanced cross-over experimental designs would be needed to differentiate the effect of the country of origin of the consumer and the beef.
There were also indications within the results that cooking method may have an influence on the relative importance of the sensory scores. Much of the literature indicates that tenderness is the most important factor in determining consumer satisfaction (Huffman et al., Reference Huffman, Miller, Hoover, Wu, Brittin and Ramsey1996; Verbeke et al., Reference Verbeke, Van Wezemael, de Barcellos, Kügler, Hocquette, Ueland and Grunert2010). However, in this study tenderness had lower weightings and therefore was less important than flavour-liking in determining the quality grade for both the roast and slow cook, though the exact differences varied greatly. As tenderness and flavour have equal importance in consumer purchasing decisions for both steaks and roasts (Reicks et al., Reference Reicks, Brooks, Garmyn, Thompson, Lyford and Miller2011), this may indicate that these cooking methods resulted in a more consistent tenderness across the samples, thereby increasing the importance of flavour-liking in discriminating between the quality grades. A relative increase in the importance of flavour-liking was also seen for the samples prepared by the Korean barbeque method for this experiment, perhaps reflecting the thin slices reducing the importance of tenderness. This is similar to the low importance of tenderness found for the shabu shabu cooking method when compared with grill cooking methods in Japan (Polkinghorne et al., Reference Polkinghorne, Nishimura, Neath and Watson2014). However, the authors note that these differences have not been tested for significance.
The boundaries between the quality grades
The boundaries between the quality grades were similar between all groups, however, the higher (better-than-every-day to premium) and the lower (unsatisfactory to good-every-day) boundaries differed between countries. These small differences may have resulted from differences in how consumers of different countries use the scale to score meat. For example, the French consumers had a lower MQ4 score boundary between unsatisfactory and good-every-day than all of the other countries studied here and previously (Hocquette et al., Reference Hocquette, Van Wezemael, Chriki, Legrand, Verbeke, Farmer, Scollan, Polkinghorne, Rødbotten, Allen and Pethick2014). Yet, they also had one of the highest upper boundaries between better-than-every-day and premium, similar to those reported for the Japanese (83.1) and Australians (Hocquette et al., Reference Hocquette, Van Wezemael, Chriki, Legrand, Verbeke, Farmer, Scollan, Polkinghorne, Rødbotten, Allen and Pethick2014). As the experiment is designed to present all consumers with meat of a range of qualities, these boundaries indicate that the French consumers have a greater propensity to use the whole scale for scoring meat. In contrast, Polish consumers tended to avoid the extreme ends of the scale and the consumer scores are more likely to cluster around the middle. However, the authors can not discount the possibility that these are simply random differences between consumer groups, particularly as the discriminant analysis retained high accuracies across the data as a whole. Furthermore, the high accuracies of the discriminant analysis over all the data also indicates that, even if genuine, minor variation in the use of the scale between demographic groups when scoring beef is unlikely to be an important factor in the prediction of eating quality. Cooking method alone had no discernible influence on the boundaries between the quality grades.
The accuracy of using composite values to allocate samples to quality grades
For all the different cuts tested, the discriminant analysis was most accurate for the unsatisfactory and premium categories. This pattern was also seen for the South African and the Japanese consumers and for a larger group of Australian consumers (Watson et al., Reference Watson, Polkinghorne and Thompson2008a; Thompson et al., Reference Thompson, Polkinghorne, Gee, Motiang, Strydom, Mashau, Ng’ambi, deKock and Burrow2010; Polkinghorne et al., Reference Polkinghorne, Nishimura, Neath and Watson2011). These results indicate that the four sensory traits used in this study appropriately describes consumer scoring for the higher and lower grades, but further work would be needed to investigate if other factors are influencing the consumer determination of the intermediate quality grades. Alternatively, the variations in accuracy may simply reflect how certain consumers are when they grade a sample as either premium or unsatisfactory with the drop in accuracy representing a relative uncertainty when distinguishing between good-every-day and better-than-every-day. However, this pattern has not been consistently reported in previous work (Thompson et al., Reference Thompson, Polkinghorne, Gee, Motiang, Strydom, Mashau, Ng’ambi, deKock and Burrow2010; Polkinghorne et al., Reference Polkinghorne, Nishimura, Neath and Watson2011).
The average accuracy of 67% found in this study is very similar to the accuracy achieved in Australia (Watson et al., Reference Watson, Polkinghorne and Thompson2008a) and other reported accuracies such as 55% to 65% in South Africa, 68% in Korea and 60% to 67% in Japan (Thompson et al., Reference Thompson, Polkinghorne, Hwang, Gee, Cho, Park and Lee2008 and Reference Thompson, Polkinghorne, Gee, Motiang, Strydom, Mashau, Ng’ambi, deKock and Burrow2010; Polkinghorne et al., Reference Polkinghorne, Nishimura, Neath and Watson2011). This indicates that the approach is useful in determining quality grades for an eating quality guarantee system facing a diverse set of consumers and cooking methods.
The drop accuracy between the analysis using optimal weightings and the oMQ4 weightings was minimal, about 2%. This was similar to the reported values for the Korean consumers (1% to 7%) and South African consumers (3%) (Thompson et al., Reference Thompson, Polkinghorne, Hwang, Gee, Cho, Park and Lee2008 and Reference Thompson, Polkinghorne, Gee, Motiang, Strydom, Mashau, Ng’ambi, deKock and Burrow2010). By comparison, the drop accuracy when using the cMQ4 weightings was around 20%. This result shows that the oMQ4 weightings of 0.4×tenderness, 0.1×juiciness, 0.2×flavour-liking and 0.3×overall-liking would likely function well in a European eating quality grading system. However, it is important to note that the Australian model experienced a change in the relative importance of tenderness and flavour over time, we would speculate that a similar shift would occur if an equivalent model were to be established in Europe. This would have to be monitored by continued consumer testing to follow the evolution of the importance of the sensory scores in determining the MQ4 score and the quality grades over time.
Ability of a prediction model to increase satisfaction for the European consumer
Overall, the chance a consumer had an unsatisfactory eating experience in this experiment was around 25%, with some groups as high as 40%. The failure rate of beef was relatively consistent over country, cooking method, doneness and muscle type, and supports the theories that variable eating quality is one of the biggest factors negatively impacting the beef industry (Morgan et al., Reference Morgan, Savell, Hale, Miller, Griffin, Cross and Shackelford1991; Polkinghorne et al., Reference Polkinghorne, Thompson, Watson, Gee and Porter2008). Importantly, the carcasses selected for this study did not impact on these results as Farmer et al. (Reference Farmer, Bowe, Troy, Bonny, Birnie, Dell’Orto, Polkinghorne, Wierzbicki, de Roest, Scollan, Henchion, Morrison, Legrand, Roehe, Hocquette and Duhem2016) demonstrated in a subset of this data that the failure rate of beef did not change when variation in the carcasses was reduced using standard industry quality cut-off points such as animal age, sex, postmortem ageing and ultimate pH.
The discriminant analysis correctly recognised over 80% of the unsatisfactory samples. Identifying these samples in the industry would reduce the risk of a consumer having an unsatisfactory eating experience from 25% to 7%. As the current beef grading system in Europe is inadequate for the prediction of eating quality (Bonny et al., Reference Bonny, Pethick, Legrand, Wierzbicki, Allen, Farmer, Polkinghorne, Hocquette and Gardner2016b), other methods of predicting consumer satisfaction have been investigated. However, most have proven to have limited usefulness or have severe barriers to commercialisation. For example, muscle biochemistry can only explain a small part of beef quality (Renand et al., Reference Renand, Picard, Touraille, Berge and Lepetit2001; Chriki et al., Reference Chriki, Renand, Picard, Micol, Journaux and Hocquette2013; Bonny et al., Reference Bonny, Gardner, Pethick, Legrand, Polkinghorne and Hocquette2015). Similarly, the large volume of research that has been conducted into genomic and proteomic techniques has yielded only a relatively low efficiency to predict beef quality (Hocquette et al., Reference Hocquette, Legrand, Jurie, Pethick and Micol2012). In contrast, the commercialised prediction model used by MSA in Australia is based on carcass and animal traits collected at slaughter. It has been shown that such a system can accurately predict European consumer scores of beef quality, with minor modifications (Bonny et al., Reference Bonny, Hocquette, Pethick, Farmer, Legrand, Wierzbicki, Allen, Polkinghorne and Gardner2016a and Reference Bonny, Pethick, Legrand, Wierzbicki, Allen, Farmer, Polkinghorne, Hocquette and Gardner2016c).
Conclusion
These results highlight the urgent need of the European beef industry to address variable beef eating quality. Improving beef eating quality is achievable using an eating quality grading system modelled on the MSA system, as evaluated in this study. Over 80% of unsatisfactory beef was correctly identified by our analysis, and the chance that a consumer would have an unsatisfactory eating experience was reduced from 25% to 7%. In a commercialised system, consumer scores would need to be predicted using animal and carcass traits. This information would be used to greatly increase the consistency of the product available to the consumer and the redirection of the vast majority of low-quality product from the fresh beef supply to other markets.
Acknowledgements
This research was supported by Meat and Livestock Australia and Murdoch University. Data were obtained through the financial contributions of the European research project ProSafeBeef (contract no. FOOD-CT-2006-36241), the Polish ProOptiBeef Farm to Fork project funded by the EU Innovative (POIG.01.03.01-00-204/09), the French ‘Direction Générale de l’Alimentation’ and FranceAgriMer, the Irish Department of Agriculture Food and The Marine under the FIRM programme, and the Northern Ireland Department of Agriculture and Rural Development ‘Vision’ programme. Furthermore, this project would not have been possible without the practical support of the Association Institut du Charolais, the Syndicat de Défense et du promotion de la Viande de Boeuf de Charolles and the gourmet restaurants ‘Jean Denaud’ and representatives of the beef industry across Europe. The international travel required for this project has been funded by ‘Egide/Fast’ funds from the French and Australian governments, respectively (project no. FR090054) and by ‘Egide/Polonium’ funds from the French and Polish governments, respectively. The assistance and participation of the Beef CRC and Janine Lau (MLA, Australia), Alan Gee (Cosign, Australia), Ray Watson (Melbourne University, Australia) and John Thompson (UNE) are also gratefully acknowledged.