For much of the history of speech perception research, the traditional view has been that listeners automatically recover phonetic segments from the acoustic signal and use those segments for subsequent linguistic processing. According to this view, listeners collect from the speech signal temporally brief and spectrally distinct bits, called acoustic cues; in turn, those bits specify the consonants and vowels comprising the linguistic message that was heard (e.g., Cooper, Liberman, Harris, & Grubb, Reference Cooper, Liberman, Harris and Grubb1958; Stevens, Reference Stevens, David and Denes1972, Reference Stevens1980). This prevailing viewpoint spawned decades of research investigating which cues, and precisely which settings of those cues, define each phonetic category (Raphael, Reference Raphael, Pisoni and Remez2008). That recovered phonetic structure then functions as the key to other sorts of linguistic processing, according to traditional accounts (e.g., Chomsky & Halle, Reference Chomsky and Halle1968; Ganong, Reference Ganong1980; Luce & Pisoni, Reference Luce and Pisoni1998; Marslen-Wilson & Welsh, Reference Marslen-Wilson and Welsh1978; McClelland & Elman, Reference McClelland and Elman1986; Morton, Reference Morton1969). For example, the storage and retrieval of sequences of words or digits in a short-term memory buffer are believed to rely explicitly on listeners’ abilities to use a phonetic code in that storage and retrieval, a conclusion supported by the finding that recall is poorer for phonologically similar than for dissimilar materials (e.g., Baddeley, Reference Baddeley1966; Conrad & Hull, Reference Conrad and Hull1964; Nittrouer & Miller, Reference Nittrouer and Miller1999; Salame & Baddeley, Reference Salame and Baddeley1986).
As compelling as these traditional accounts are, however, other evidence has shown that forms of acoustic structure in the speech signal not fitting the classic definition of acoustic cues affects linguistic processing and does so in ways that do not necessitate the positing of a stage of phonetic recovery. In particular, talker-specific attributes of the speech signal can influence short-term storage and recall of linguistic materials. To this point, Palmeri, Goldinger and Pisoni (Reference Palmeri, Goldinger and Pisoni1993) presented strings of words to listeners and asked those listeners to indicate whether specific words toward the ends were newly occurring or repetitions of ones heard earlier. Results showed that decision accuracy improved when the repetition was spoken by the person who produced the word originally, indicating that information about the speaker's voice was stored separately but along with phonetic information, helping to render each item more distinct.
Additional evidence that talker-specific information modulates speech perception is found in the time it takes to make a phonetic decision. Mullennix and Pisoni (Reference Mullennix and Pisoni1990) showed that this time is slowed when tokens are produced by multiple speakers rather than a single speaker, indicating that some effort goes into processing talker-specific information and that such processing is independent of that involved in recovery of phonetic structure. Thus, regardless of whether its function is characterized as facilitative or as inhibitory for a given task, listeners apparently attend to structure related to talker identity in various psycholinguistic processes. Information regarding talker identity is available in the temporal fine structure of speech signals, structure that arises from the individual opening and closing cycles of the vocal folds and appears in spectrograms as vertical striations across the x axis.
SPEECH PERCEPTION THROUGH COCHLEAR IMPLANTS
One challenge to the traditional view of speech perception and linguistic processing described above arose when clinical findings began to show that listeners with severe to profound hearing loss who receive cochlear implants are often able to recognize speech better than might be expected if those traditional views were strictly accurate. Some adult implant users are able to recognize close to 100% of words in sentences (Firszt et al., Reference Firszt, Holden, Skinner, Tobey, Peterson, Gaggl, Runge-Samuelson and Wackym2004). The mystery of how those implant users manage to recognize speech as well as they do through their devices arises because the signal processing algorithms currently used in implants are poor at preserving the kinds of spectral and temporal structure in the acoustic signal that could be described as either acoustic cues or as temporal fine structure. Yet many deaf adults who choose to get cochlear implants can understand speech with nothing more than the signals they receive through those implants. The broad goal of the two experiments reported here was to advance our understanding of the roles played in linguistic processing of these kinds of signal structure, and in so doing, better appreciate speech perception through cochlear implants.
The primary kind of structure preserved by cochlear implants is amplitude change across time for a bank of spectral bands, something termed “temporal” or “amplitude” envelopes. The latter term is used in this article. In this signal processing, any kind of frequency-specific structure within each band is effectively lost. In particular, changes in formant frequencies near syllable margins where consonantal constrictions and open vowels intersect are lost, except when they are extensive enough to cross filtering bands. Those formant transitions constitute important acoustic cues for many phonetic decisions. Other sorts of cues, such as release bursts and spectral shapes of fricative noises, are diminished in proportion to the decrement in numbers of available channels. In all cases, temporal fine structure is eliminated. Nonetheless, degradation in speech recognition associated with cochlear implants is usually attributed to the reduction of acoustic cues, rather than to the loss of temporal fine structure, because fine structure has historically been seen as more robustly related to music than to speech perception, at least for nontonal languages like English (Kong, Cruz, Jones, & Zheng, Reference Kong, Cruz, Jones and Zeng2004; Smith, Delgutte, & Oxenham, Reference Smith, Delgutte and Oxenham2002; Xu & Pfingst, Reference Xu and Pfingst2003). However, the role of temporal fine structure in linguistic processing beyond recognition has not been thoroughly examined. Whether clinicians realize it or not, standard practice is currently based on the traditional assumptions outlined at the start of this report: if implant patients can recognize word-internal phonetic structure, the rest of their language processing must be normal. This study tested that assumption.
SIGNAL PROCESSING AND RESEARCH GOALS
For research purposes, speech-related amplitude envelopes (AEs) are typically derived by dividing the speech spectrum into a number of channels and half-wave rectifying those channels to recover amplitude structure across time. The envelopes resulting from that process are used to modulate bands of white noise, which lack frequency structure, and presented to listeners with normal hearing. That method, usually described with the generic term “vocoding,” was used in this study to examine questions regarding the effects of reduced acoustic cues and elimination of temporal fine structure on linguistic processing. For comparison, natural speech signals not processed in any way were presented in noise. This was done to have a control condition with diminishment in acoustic cues due to energetic masking that also preserved temporal fine structure. Thus, both conditions of signal degradation diminished available acoustic cues, but one also eliminated temporal fine structure while the other preserved it. The goal here was to compare outcomes across signal types in order to shed light on the extent to which disruptions in linguistic processing associated with AEs are attributable to deficits in the availability of phonetically relevant acoustic cues or to the loss of temporal fine structure.
The current study was not concerned with how well listeners can recognize speech from AEs. Numerous experiments have tackled that question, and have collectively shown that listeners with normal hearing can recognize syllables, words, and sentences rather well with only four to eight channels (e.g., Eisenberg, Shannon, Schaefer Martinez, Wygonski, & Boothroyd, Reference Eisenberg, Shannon, Schaefer Martinez, Wygonski and Boothroyd2000; Loizou, Dorman, & Tu, Reference Loizou, Dorman and Tu1999; Nittrouer & Lowenstein, Reference Nittrouer and Lowenstein2010; Nittrouer, Lowenstein, & Packer, Reference Nittrouer, Lowenstein and Packer2009; Shannon, Zeng, Kamath, Wygonski, & Ekelid, Reference Shannon, Zeng, Kamath, Wygonski and Ekelid1995). The two experiments reported here instead focused on the effects of this signal processing on linguistic processing beyond recognition, specifically on short-term memory, and the relationship of that functioning to listeners’ abilities to recover phonetic structure with these signals. A pertinent issue addressed by this work was how necessary it is for listeners to recover explicitly phonetic structure from speech signals in order to store and retrieve items in a short-term memory buffer. If either of the signal processing algorithms implemented in this study were found to hinder short-term memory, the effect could alternatively be by harming listeners’ abilities specifically to recover phonetic structure or by impairing perceptual processing through signal degradation. Outcomes of this study should provide general information about normal psycholinguistic processes and about how signal processing for implants might best be designed to facilitate language functioning in the real world where more than word recognition is required.
SPEECH PERCEPTION BY CHILDREN
The effects on linguistic processing of diminishment in acoustic cues and temporal fine structure were examined for both adults and children in these experiments because it would be important to know if linguistic processing through a cochlear implant might differ depending on listener age. In speech perception, children rely on (i.e., weight) components of the signal differently than do adults, so the possibility existed that children might be differently affected by the reduction of certain acoustic cues. In particular, children rely strongly on intrasyllabic formant transitions for phonetic judgments (e.g., Greenlee, Reference Greenlee1980; Nittrouer, Reference Nittrouer1992; Nittrouer & Miller, Reference Nittrouer and Miller1997a, Reference Nittrouer and Miller1997b; Nittrouer & Studdert-Kennedy, Reference Nittrouer and Studdert-Kennedy1987; Wardrip-Fruin & Peach, Reference Wardrip-Fruin and Peach1984). These spectral structures are greatly reduced in AE replicas of speech but are rather well preserved when speech is embedded in noise. Cues such as release bursts and fricative noises are likely to be masked by noise but are preserved to some extent in AEs. However, children do not weight these brief, spectrally static cues as strongly as adults do (e.g., Nittrouer, Reference Nittrouer1992; Nittrouer & Miller Reference Nittrouer and Miller1997a, Reference Nittrouer and Miller1997b; Nittrouer & Studdert-Kennedy, Reference Nittrouer and Studdert-Kennedy1987; Parnell & Amerman, Reference Parnell and Amerman1978). Consequently, children might be more negatively affected when listening to amplitude-envelope speech than adults are. Of course, it could be the case that children are simply more deleteriously affected by any kind of signal degradation than adults. This would happen, for example, if signal degradation creates greater informational masking (i.e., cognitive or perceptual loads) for inexperienced listeners. Comparison of outcomes for AEs and noise-embedded signals could help explicate the source of age-related differences in those outcomes, if observed.
In contrast, there are several developmental models that might actually lead to the prediction that children should attend more than adults do to the broad kinds of structure preserved by AEs (e.g., Davis & MacNeilage, Reference Davis and MacNeilage1990; Menn, Reference Menn, Bell and Hooper1978; Nittrouer, Reference Nittrouer2002; Waterson, Reference Waterson1971). For example, one study showed that infants reproduce the global, long-term spectral structure typical of speech signals in their native language before they produce the specific consonants and vowels of that language (Boysson-Bardies, Sagart, Halle, & Durand, Reference Boysson-Bardies, Sagart, Halle, Durand, Lindblom and Zetterstrom1986). Therefore, it might be predicted that children would not be as severely hindered as adults by having only the global structure represented in AEs to use in these linguistic processes because that is precisely the kind of structure that children mostly utilize anyway. This situation might especially be predicted to occur if the locus of any observed negative effect on short-term memory for AEs was found to reside in listeners’ abilities to recover explicitly phonetic structure. Acquiring sensitivity to that structure requires a protracted developmental period (e.g., Liberman, Shankweiler, Fischer, & Carter, Reference Liberman, Shankweiler, Fischer and Carter1974). Accordingly, it has been observed that children do not seem to store items in short-term memory using phonetic codes to the same extent that adults do (Nittrouer & Miller, Reference Nittrouer and Miller1999).
SUMMARY
The current study differed from earlier ones examining speech recognition for AEs in that recognition itself was not examined. Rather, this study examined the abilities of listeners to perform a psycholinguistic function using amplitude-envelope speech that they could readily recognize and compared those abilities to their performance for speech in noise. Performance on that linguistic processing task was then compared to performance on a task requiring explicit awareness of phonetic units. The question asked was whether a lack of acoustic cues and/or temporal fine structure had effects on linguistic processing independently of phonetic recovery. Accuracy in performance on the short-term memory and phonemic awareness tasks was the principal dependent measure used to answer this question. However, it was also considered possible that—even if no decrements in accuracy were found for one or both processed signals—there might be an additional perceptual load, leading to enhanced effort, involved in using these impoverished signals for such processes. The response time (RT) was measured as an index of effort. This has been shown to be a valid indicator of such effort (e.g., Cooper-Martin, Reference Cooper-Martin1994; Piolat, Olive, & Kellogg, Reference Piolat, Olive and Kellogg2005). If results showed that greater effort is required for linguistic processing with these signals it would mean that perceptual efficiency is diminished when listeners must function with such signals.
In summary, the purpose of this study was to examine whether there is a toll in accuracy and/or efficiency of linguistic processing when signals lacking acoustic cues and/or temporal fine structure are presented. Adults and children were tested to determine if they are differently affected by these disruptions in signal structure. It was simultaneously investigated whether listeners need to explicitly recover the phonetic structure from the speech signal in order to perform higher-order linguistic processes, such as storing and retrieving items in a short-term memory buffer.
EXPERIMENT 1: SHORT-TERM MEMORY
Listeners’ abilities to store acoustic signals in a short-term memory buffer are facilitated when speech rather than nonspeech signals are presented (e.g., Greene & Samuel, Reference Greene and Samuel1986; Rowe & Rowe, Reference Rowe and Rowe1976). That advantage for speech has long been attributed to listeners’ use of phonetic codes for storing items in the short-term (or working) memory buffer (e.g., Baddeley, Reference Baddeley1966; Baddeley & Hitch, Reference Baddeley, Hitch and Bower1974; Campbell & Dodd, Reference Campbell and Dodd1980; Spoehr & Corin, Reference Spoehr and Corin1978). Especially strong support for this position derives from studies revealing that typical listeners are able to recall strings of words more accurately when those words are nonrhyming rather than rhyming (e.g., Mann & Liberman, Reference Mann and Liberman1984; Nittrouer & Miller, Reference Nittrouer and Miller1999; Shankweiler, Liberman, Mark, Fowler, & Fischer, Reference Shankweiler, Liberman, Mark, Fowler and Fischer1979; Spring & Perry, Reference Spring and Perry1983). Because nonrhyming words are more phonetically distinct than rhyming words, the finding that recall is more accurate for nonrhyming words suggests that phonetic structure must account for the superior recall of speech over nonspeech signals. The goal of this first experiment was to examine the abilities of adults and children to store words in a short-term memory buffer when those words are either AEs or embedded in noise, two kinds of speech signals that should not be as phonetically distinct as natural speech, in this case due to the impoverished nature of the signals rather than to similarity in phonetic structure. Then, by comparing outcomes of this experiment to results of the second experiment, which investigated listeners’ abilities to recover phonetic structure from those signals, an assessment could be made regarding whether it was particularly the availability of phonetic structure that explained outcomes of this first experiment. The hypothesis was that short-term recall would be better for those signals that provided better access to phonetic structure.
The numbers of channels used to vocode the signals and the signal to noise ratios (SNRs) that were used were selected to be minimally sufficient to support reliable word recognition after training. These processing levels meant that listeners could recognize the words but restricted the availability of acoustic cues in the signal as much as possible. Earlier studies using either AEs or speech embedded in noise conducted with adults and children (Eisenberg et al., Reference Eisenberg, Shannon, Schaefer Martinez, Wygonski and Boothroyd2000; Nittrouer & Boothroyd, Reference Nittrouer and Boothroyd1990; Nittrouer et al., Reference Nittrouer, Lowenstein and Packer2009) provided initial estimates of the numbers of channels and the SNRs that should be used. Informal pilot testing helped to verify that the levels selected met the stated goals.
Environmental sounds (ESs) were also used in the current experiment. Short-term recall for ESs was viewed as a sort of anchor, designating the performance that would be expected when phonetic structure was completely inaccessible.
The recall task used in this first experiment was order recall, rather than item recall. In an order recall task, listeners are familiarized with the list items before testing. In this experiment, that design served an important function by ensuring that all listeners could recognize the items being used, in spite of being either AEs or embedded in noise.
RTs were measured and used to index perceptual load. Even if recall accuracy were found to be similar across signal types, it is possible that the effort required to store and recall those items would differ depending on signal properties. Including a measure of RT meant it was possible to examine whether differences in how long it takes to respond could explain anticipated differences in recall accuracy on short-term memory tasks for adults and children. Several studies have demonstrated that children are poorer at both item and order recall than adults, but none has examined whether that age effect is due to differences in how long it takes listeners to respond. The memory trace in the short-term buffer decays rapidly (Baddeley, Reference Baddeley2000; Cowan, Reference Cowan2008). There is evidence that children are slower to respond than adults, but that evidence comes primarily from studies in which listeners were asked to perform tasks with large cognitive loads, such as ones involving mental rotation or abstract pattern matching (e.g., Fry & Hale, Reference Fry and Hale1996; Kail, Reference Kail1991). Consequently, it is difficult to know the extent to which age-related differences for accuracy on memory tasks arises from generally slowed responding. This experiment addressed that issue.
Method
Listeners
Forty-eight adults between the ages of 18 and 40 and 24 8-year-olds participated. Adults were recruited from the university community, so all were students or staff members. Children were recruited from local public schools through the distribution of fliers to children in regular classrooms. Twice the number of adults participated because it seemed prudent to test adults at two SNRs when stimuli were embedded in noise: one that was the same as the ratio used with children, and one that was 3 dB poorer. The 8-year-olds ranged in age from 7 years, 11 months to 8 years, 5 months. The fliers that were distributed indicated that only typically developing children were needed for the study, and there was no indication that any children with cognitive or perceptual deficits volunteered.
None of the listeners or the children's parents reported any history of hearing or speech disorder. All listeners passed hearing screenings consisting of the pure tones 0.5, 1, 2, 4, and 6 kHz presented at 25 dB HL to each ear separately. Children were given the Goldman Fristoe 2 Test of Articulation (Goldman & Fristoe, Reference Goldman and Fristoe2000) and were required to score at or better than the 30th percentile for their age in order to participate. All children were error free. All children were also free from significant histories of otitis media, defined as six or more episodes during the first 3 years of life. Adults were given the reading subtest of the Wide Range Achievement Test 4 (Wilkinson & Robertson, Reference Wilkinson and Robertson2006), and all demonstrated better than a 12th-grade reading level.
Equipment and materials
All testing took place in a soundproof booth, with the computer that controlled stimulus presentation in an adjacent room. Hearing was screened with a Welch Allyn TM262 audiometer using TDH-39 headphones. Stimuli were stored on a computer and presented through a Creative Labs Soundblaster card, a Samson headphone amplifier, and AKG-K141 headphones. This system has a flat frequency response and low noise. Custom-written software controlled the audio and visual presentation of the stimuli. Order of items in a list was randomized by the software before each presentation. Computer graphics (presented at 200 × 200 pixels) were used to represent each word, letter, number, and ES. In the case of the first three of these, a picture of the word, letter or number was shown. In the case of ESs, the picture was of the object that usually produces the sound (e.g., a whistle for the sound of a whistle).
Stimuli
Four sets of stimuli were used for testing. These were eight ESs and eight nonrhyming consonant–vowel–consonant nouns, presented in three different ways: (a) as UP, (b) as AEs by creating eight-channel noise-vocoded versions of those productions (AE), and (c) as the natural productions presented in noise at 0 or −3 dB SNRs (NOI). These specific settings for signal processing and noise had resulted in roughly 60% to 80% correct recognition in earlier studies using open-set formats (Eisenberg et al., Reference Eisenberg, Shannon, Schaefer Martinez, Wygonski and Boothroyd2000; Nittrouer & Boothroyd, Reference Nittrouer and Boothroyd1990), and pilot testing for this study showed that with very little training adults and 8-year-olds recognized words in a closed-set format 100% of the time.
All stimuli were created with a sampling rate of 22.05 kHz, 10-kHz low-pass filtering, and 16-bit digitization. Word samples were spoken by a man, who recorded five samples of each word in random order. The words were ball, coat, dog, ham, pack, rake, seed, and teen. Specific tokens to be used were selected from the larger pool so that words matched closely in fundamental frequency, intonation, and duration. All were roughly 500 ms in length.
A MATLAB routine was used to create the eight-channel AE stimuli. All signals were first low-pass filtered with a high-frequency cutoff of 8000 Hz. Cutoff frequencies between channels were 0.4, 0.8, 1.2, 1.8, 2.4, 3.0, and 4.5 kHz. Each channel was half-wave rectified using a 160-Hz high-frequency cutoff, and results used to modulate white noise limited by the same bandpass filters as those used to divide the speech signal into channels.
The natural version of each word was also center-embedded in 980 ms of white noise with a flat spectrum at a 0 and −3 dB SNRs.
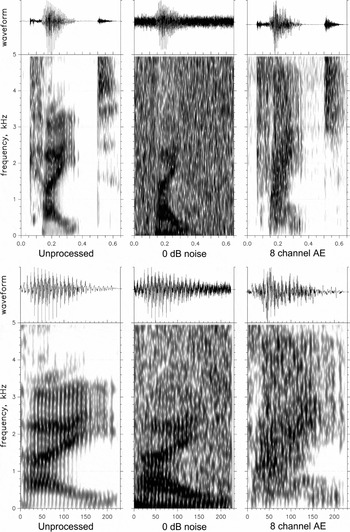
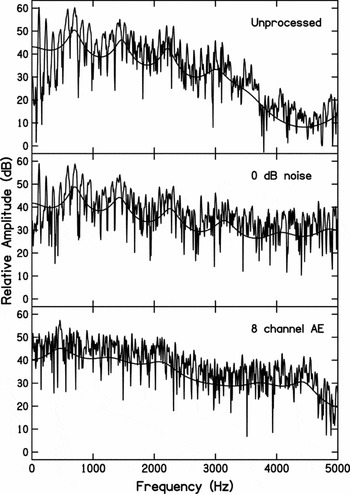
Spectrograms were obtained for a subset of the words in their UP, AE, and NOI conditions to glean a sense of what properties were preserved in the signal processing. Figure 1 shows waveforms and spectrograms of the word kite for these three conditions. The top waveforms and spectrograms show whole word files, and reveal that aspiration noise for the [k] and [t] releases were preserved by the AE signals, but not by the NOI stimuli. The bottom-most waveforms and spectrograms display only the vocalic portion of the word. These spectrograms reveal that neither formant structure nor temporal fine structure was well preserved in the AE signals, but both were rather well preserved when words were embedded in noise (NOI signals). Figure 2 further highlights these effects. This figure shows both linear predictive coding and fast Fourier transform spectra for 100 ms of the signal located in the relatively steady-state vocalic portion. Both the fine structure, particularly in the low frequencies, and the formants are well preserved for the NOI signal, but not for the AE version.
Waveforms and spectrograms for the word kite in the natural, unprocessed form, embedded in noise at a 0 dB signal to noise ratio, and as eight-channel amplitude envelopes. The topmost waveforms and spectrograms are for the entire word. The time in seconds is on the x axis. The bottommost waveforms and spectrograms are for the vocalic word portion only. The time in milliseconds is on the y axis.

Linear predictive coding and fast Fourier transform spectra for the same 100-ms section taken from the vocalic portion of the word kite.

The ESs were selected to be sounds that occur within most people's environment. These sounds were selected to differ from each other in terms of tonality, continuity, and overall spectral complexity. The specific sounds were a bird chirping, a drill, glass breaking, a helicopter, repeated knocking on a door, a single piano note (one octave above middle C), a sneeze, and a whistle being blown. These stimuli were all 500 ms long.
Samples of eight nonrhyming letters (F, H, K, L, Q, R, S, Y) were used as practice. These were produced by the same speaker who produced the word samples. The numerals 1 through 8 were also used for practice, but these were not presented auditorily, so digitized audio samples were not needed.
Eight-year-olds were tested using six instead of eight stimuli in each condition in order to equate task difficulty across the two listener groups. The words teen and seed were removed from the word conditions, the sneeze and helicopter sounds were removed from the sound condition, and the letters K and L and numerals 7 and 8 were removed from the practice conditions.
Procedures
All testing took place in a single session of roughly 45 min to 1 hr. The screening procedures were always administered first, followed by the serial recall task. Items in the serial recall task were presented via headphones at a peak intensity of 68 dB SPL. The experimenter always sat at 90 degrees to the listener's left. A 23-in. widescreen monitor was located in front of the listener, 10 in. from the edge of the table, angled so that the experimenter could see the monitor as well. A wireless mouse on a mousepad was located on the table between the listener and the monitor and was used by the listener to indicate the order of recall of word presentation. The experimenter used a separate, wired mouse when needed to move between conditions. Pictures representing the letters, words, or ESs appeared across the top of the monitor after the letters, words, or sounds were played over the headphones. After the pictures appeared, listeners clicked on them in the order recalled. As each image was clicked, it dropped to the middle of the monitor, into the next position going from left to right. The order of pictures could not subsequently be changed. Listeners had to keep their hand on the mouse during the task, and there could be no articulatory movement of any kind (voiced or silent) between hearing the items and clicking all the images. Software recorded both the order of presentation and the listener's answers and calculated how much time elapsed between the end of the final sound and the click on the final image.
Regarding the NOI condition, children heard words at only 0 dB SNR. Two groups of adults participated in this experiment, with each group hearing words at one of the two SNRs: 0 or −3 dB. Nittrouer and Boothroyd (Reference Nittrouer and Boothroyd1990) had found consistently across a range of stimuli that recognition accuracy for adults and children was equivalent when children had roughly 3 dB more favorable SNRs than adults, so this procedure was implemented to see if maintaining this difference would have a similar effect on processing beyond recognition.
Because there were four types of stimuli (UP, NOI, AE, and ES) there were 24 possible orders in which these stimulus sets could be presented. One adult or child was tested on each of these possible orders, mandating the sample sizes used. Again, adults were tested with either a 0 dB or a −3 dB SNR, doubling the number of adults needed. Testing with each stimulus type consisted of 10 lists, or trials, and the software generated a new order for each trial.
Before the listener entered the soundproof booth, the experimenter set up the computer so that stimulus conditions could be presented in the order selected for that listener. The first task during testing was a control task for the RT measure. Colored squares with the numerals 1 through 8 (or in the case of 8-year-olds, 1 through 6) were displayed in a row in random order across the top of the screen. The listener was instructed to click on the numerals in order from left to right across the screen. The experimenter demonstrated one time, and then the listener performed the task four times as practice. Listeners were instructed to keep their dominant hands on the wireless mouse and to click the numbers as fast as they comfortably could. After this practice session, the listener performed the task five times so a measure could be obtained of the time required for the listener to click on the number of items to be used in testing. The mean time it took for the listener to click on the numbers from left to right was used to obtain a “corrected” RT during testing.
Next, the listener was instructed to click the numerals in numerical order, as fast as they comfortably could. This was also performed five times and was done to provide practice clicking on images in an order other than left to right.
The next task was practice with test procedures using the letter strings. The experimenter explained the task and instructed the listener not to talk or whisper during it. The list of letters was presented over headphones, and then the images of the letters immediately appeared in random order across the top of the screen. The experimenter demonstrated how to click on each in the order heard as quickly as possible. The listener was then provided with nine practice trials. Feedback regarding the accuracy of recall was not provided, but listeners were reminded if need be to keep their hands on the mouse during stimulus presentation and to refrain from any articulatory movements until after the reordering task was completed.
The experimenter then moved to the first stimulus type to be used in testing, and made sure the listener recognized each item. To do this with words, all images were displayed on the screen, and the words were played one at a time over the headphones. After each word was played, the experimenter repeated the word and then clicked on the correct image. The software then displayed the images in a different order and again played each word one at a time. After each presentation, the listener was asked to repeat the word and click on the correct image. Feedback was provided if an error in clicking or naming the correct image was made on the first round. On a second round of presentation, listeners were required to select and name all images without error. No feedback was provided this time. If a listener made an error on any item, that listener was dismissed. For listeners who were tested with the AE or NOI stimuli before the UP words, practice with the UP words was provided first, before practice with the processed stimuli. This gave all listeners an opportunity to hear the natural tokens before the processed stimuli.
This pretest to make sure listeners recognized each item was done just prior to testing with each of the four stimulus sets. With the ES stimuli, however, the experimenter never gave the sounds verbal labels. When sounds were heard for the first time over headphones, each image was silently clicked. This was done explicitly to prevent listeners from using the name of the object making the sound to code these sounds in short-term memory. If a listener gave a sound a label, the experimenter corrected the individual, stating that the task should be conducted silently. Of course, there was no way to prevent listeners from doing so covertly.
Testing with 10 trials of the items took place immediately after the pretest with those items. After testing with each stimulus type, the labeling task described above was repeated to ensure that listeners had maintained correct associations between images and words or sounds through testing. If a listener was unable to match the image to the correct word or sound for any item, that individual's data were not included in the analyses.
The software automatically compared order recall to word or sound orders actually presented and calculated the number of errors for each list position (out of 10) and total errors (out of 80 or 60, depending on whether adults or children were tested). The software also recorded the time required for responding to each trial, and computed the mean time across the 10 trials within the condition. A corrected RT (cRT) for each condition was obtained for each speaker by subtracting the mean RT of the control condition from the mean RT for testing in each condition.
Results
All listeners were able to correctly recognize all items in all the processed forms, during both the pretest and posttest trials, so data from all listeners were included in the statistical analyses.
Adults performed similarly in the NOI condition regardless of which SNR they heard: in terms of accuracy, they obtained 59% correct (SD = 15.7%) at 0 dB SNR and 57% (SD = 16.3%) correct at −3 dB SNR. In terms of RTs, they took 4.09 s (SD = 1.58 s) at 0 dB SNR and 4.24 s (SD = 1.73 s) at –3 dB SNR. Two-sample t tests indicated that these differences were not significant (p > .10), so data were combined across the two adult groups in subsequent analyses.
Serial position
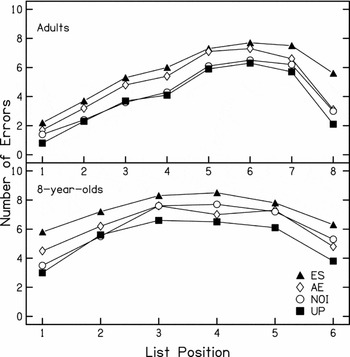
Figure 3 shows error patterns across list positions for each age group for each stimulus condition. Overall, adults made fewer errors than 8-year-olds and showed stronger primacy and recency effects. A major difference between adults and 8-year-olds was in the error patterns across conditions. For adults, there appears to be no difference between the UP and the NOI conditions, other than slightly stronger primacy and recency effects for the UP stimuli. Adults appear to have performed similarly for the ES and AE stimuli until the final position, where there was a stronger recency effect for the AE stimuli. Eight-year-olds appear to have performed similarly with the AE and NOI stimuli, and those scores fell between scores for the UP and ES stimuli. Only a slightly stronger primacy effect is evident for the NOI stimuli, compared to AE.
Errors (out of 10 possible) for serial recall in Experiment 1 for all list positions in all conditions and by all listener groups.

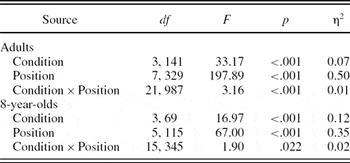
Because adults and 8-year-olds did the recall task with different numbers of items, it was not possible to do an analysis of variance (ANOVA) on the numbers of errors for stimuli in each list position with age as a factor. Instead, separate ANOVAs were done for each age group, with stimulus condition and list position as the within-subjects factors. Results are shown in Table 1. The main effects of condition and position were significant for both age groups. These results support the general observations that different numbers of errors were made across conditions and that the numbers of errors differed across list positions. The findings of significant Condition × Position interactions reflect the slight differences in primacy and recency effects across conditions.
Outcomes of separate analyses of variance performed on adult and child data for stimulus condition and list position in Experiment 1

Correct responding
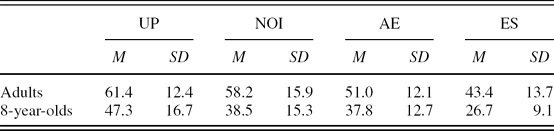
To investigate differences across conditions more thoroughly, the sum of correct responses across list positions was computed for each condition and transformed to percentage of correct items out of the total number presented (80 for adults and 60 for children). Table 2 shows mean percentages of items correctly recalled for each condition for each age group. Adults scored 13–20 percentage points higher than 8-year-olds did. For both age groups, scores were highest for UP and lowest for ES, with scores for AE and NOI stimuli somewhere in between. A two-way ANOVA with Age as the between-subjects factor and Condition as the within-subjects factor supported these observations: Age, F (1, 70) = 35.08, p < .001, and Condition, F (3, 210) = 43.94, p < .001, were both significant, but the Age × Condition interaction was not significant.
Mean and standard deviation percentage of correct responses across all list positions for adults and 8-year-olds for stimuli in Experiment 1

Note: UP, unprocessed; NOI, speech in noise; AE, eight-channel noise vocoded; ES, environmental sound.
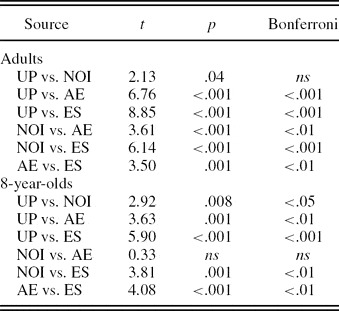
Although general patterns of results were similar for adults and children, age-related differences were found for the NOI and AE stimuli. As observed in Figure 3, adults’ scores for the UP and NOI conditions were nearly identical, while for 8-year-olds, scores on NOI and AE were nearly identical. These observations were confirmed by the results of a series of matched t tests, presented in Table 3. For adults, all comparisons were significant before Bonferroni corrects were applied, while for 8-year-olds, all comparisons were significant except for NOI versus AE. Because the four conditions resulted in six comparisons, Bonferroni corrections were used, which meant that p had to be less than or equal to .00833 to be the equivalent of p < .05 for a one-comparison test. When these corrections were applied, the difference in adults’ scores for UP and NOI ceased to be significant.
Outcomes of matched t tests performed on the percentage of correct responses for adults and 8-year-olds separately in Experiment 1

Note: For adults, df = 47; for 8-year-olds, df = 23. Precise p values are given for p < .10; ns, p > .10. UP, unprocessed; NOI, speech in noise; AE, eight-channel noise vocoded; ES, environmental sound.
RTs
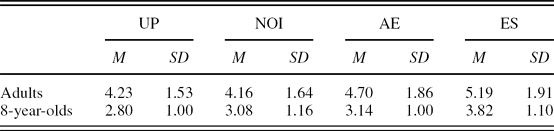
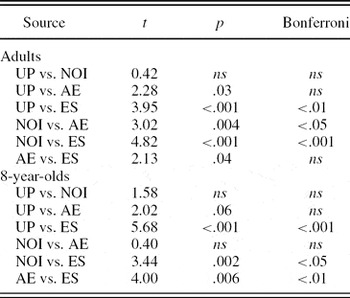
The RTs were examined as a way of determining whether there were differences in the perceptual load introduced by the two kinds of processed stimuli. Table 4 shows mean cRTs for both groups in each condition. Adults’ RTs appear to correspond to their accuracy scores in that the conditions in which they were most accurate show the shortest cRTs: times were similar for the UP and NOI conditions, longer for AE, and longest for ES. Similarly, cRTs for 8-year-olds appear to correspond to their accuracy scores in that times were shortest for UP, similar for NOI and AE, and longest for ES. However, a series of matched t tests revealed a slightly more nuanced picture. These outcomes are shown in Table 5. For adults, the pattern described above was supported, before Bonferroni corrections were applied. However, once those corrections were applied, the differences between UP and AE and between AE and ES were no longer significant. For 8-year-olds, differences in RTs between UP and NOI and UP and AE conditions did not reach statistical significance.
Mean and standard deviation corrected response times (s) for adults (eight items) and 8-year-olds (six items) for all conditions in Experiment 1

Note: UP, unprocessed; NOI, speech in noise; AE, eight-channel noise vocoded; ES, environmental sound.
Statistical outcomes of matched t tests performed on mean corrected response times (s) for adults and 8-year-olds separately in Experiment 1

Note: For adults, df = 47; for 8-year-olds, df = 23. UP, unprocessed; NOI, speech in noise; AE, eight-channel noise vocoded; ES, environmental sound.
Rate
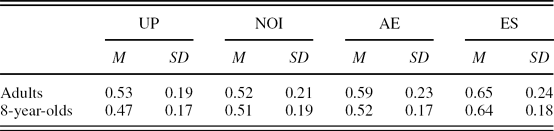
It is unclear from RTs shown in Table 4 whether adults have faster RTs than children because the task for each group involved a different number of items. To deal with this discrepancy, rate was computed by dividing cRTs by the number of items in the task. Before examining those metrics, however, rate for the control condition was examined to get an indication of simple rates of responding for adults and children. In that condition, adults responded at a rate of 0.49 s/item (SD = 0.11 s), whereas 8-year-olds were slightly slower, responding at a rate of 0.58 s/item (SD = 0.10 s). This age effect was significant, F (1, 70) = 11.15, p = .001.
Table 6 shows mean rates for each condition for adults and 8-year-olds. Rates appear to be similar across the two age groups, and a two-way ANOVA with Age as the between-subjects factor and Condition as the within-subjects factor confirmed this observation: Condition was significant, F (3, 210) = 18.62, p < .001, but the Age effect and the Age × Condition interaction were not significant. Thus, even though 8-year-olds were slightly slower at the control task, they responded at rates similar to those of adults during the test conditions.
Mean and standard deviation corrected rates (s/item) for adults and 8-year-olds for all conditions in Experiment 1

Note: UP, unprocessed; NOI, speech in noise; AE, eight-channel noise vocoded; ES, environmental sound.
Rate and accuracy
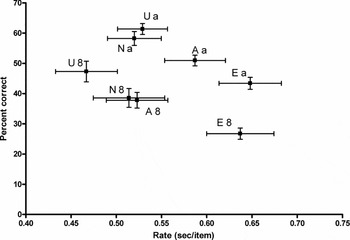
Finally, the question was addressed of whether rate of responding accounted for accuracy. Figure 4 shows the relationship between rate and accuracy. Overall, this graph reveals the general pattern of results. There is almost complete overlap in accuracy and rates for the NOI and AE stimuli for 8-year-olds. The strong correspondence in outcomes between the NOI and UP conditions for adults is also apparent. Furthermore, the differences in accuracy but similarity in rates between outcomes for children and adults are evident.
The relationship between rate (seconds/item) and percentage of correct responses in Experiment 1 in all conditions and by all listener groups. Error bars indicate standard errors of the mean. U, unprocessed signals; N, unprocessed signals in noise; A, amplitude envelopes; E, environmental sounds; a, adults; 8, 8-year-olds.

Some relationship between accuracy and rate of responding can be seen in the slightly negative slopes across the Group × Condition means shown in Figure 4. In order to examine this relationship more closely, correlations between rate and accuracy were computed in several ways: (a) for each age group and condition separately, (b) across all conditions for each age group separately, and (c) for both age groups within each condition. None of these correlation coefficients was significant, so it seems fair to conclude that rate could not account for accuracy, even though the two showed similar trends across conditions.
Discussion
This first experiment was conducted to examine how adults and children would perform with degraded signals on a task involving a linguistic process more complex than simple word recognition. At issue was the possibility that even when listeners are able to recognize words presented as processed signals, that signal processing might negatively affect higher-order linguistic processing.
It was not surprising that children were generally less accurate at recalling item order than were adults. This age effect was consistent across conditions but was not related to children having slower RTs than adults. Although there was a significant difference in baseline RTs between adults and children, it was small in size, and response rates during testing were equivalent for adults and 8-year-olds. Furthermore, correlations between accuracy and rate were not found to be statistically significant.
One of the most important outcomes of this experiment was the finding that both adult and child listeners were less accurate and slower at responding with AEs than with UP signals. This was true even though all listeners demonstrated perfect accuracy for recognizing the items. Consequently, it may be concluded that there is a “cost” to processing signals that lack acoustic cues and/or temporal fine structure, even when recognition of those signals is unhampered. At the same time, listeners in neither group performed as poorly or as slowly with the AEs as with ESs. That outcome means there must be some benefit to short-term memory for linguistically significant over nonspeech acoustic signals, even if the acoustic cues traditionally thought to support recovery of that structure are greatly diminished.
Several interesting outcomes were observed when it comes to speech embedded in noise. First, it was observed that adults’ performance was the same across SNRs differing by 3 dB, a difference that has been shown to affect accuracy of open-set word recognition by roughly 20% (Boothroyd & Nittrouer, Reference Boothroyd and Nittrouer1988). Thus, it could be concluded that as long as listeners can recognize the words, further linguistic processing is not affected. Of course, that conclusion might be challenged because adults performed differently on order recall for speech in noise and AEs, even though they could recognize the words in both conditions. The primary difference between these two conditions is that temporal fine structure was still available in the noise-embedded stimuli. Apparently, that structure had a protective function for adults’ processing of signals on this linguistic task, a finding that has been reported by others (e.g., Lorenzi, Gilbert, Carn, Garnier, & Moore, Reference Lorenzi, Gilbert, Carn, Garnier and Moore2006).
Second, an interesting result observed for the speech in noise signals was that a very distinct difference emerged in how adults and children performed with these signals. Adults’ performance was similar with these signals to their performance with UP signals, although not quite identical. It was only when Bonferroni corrections were applied that statistical significance in accuracy of responding for these two conditions disappeared. Nonetheless, it seems fair to conclude that as long as adults could recognize these signals in noise there was little decrement in linguistic processing. Children, however, showed a decrement in performance for speech in noise equal in magnitude to that observed for AEs. So, children were unable to benefit from the presence of temporal fine structure in the way that adults did.
However, there is an objection that might be raised to both general conclusions that (a) adults were less affected by signals embedded in noise than by AEs and (b) children were more deleteriously affected than adults by noise masking. That objection is that there really is no good way to assign a handicapping factor, so to speak, to different signal types or to the same signal type across listener age. Consequently, there is no way to know whether the same degree of uncertainty was introduced by these different conditions of signal degradation and if that uncertainty was similar in magnitude for adults and children. The only available evidence to address those concerns comes from earlier studies (Eisenberg et al., Reference Eisenberg, Shannon, Schaefer Martinez, Wygonski and Boothroyd2000; Nittrouer & Boothroyd, Reference Nittrouer and Boothroyd1990), which suggest that adults and 8-year-olds might reasonably be expected to perform similarly on open-set word recognition with eight-channel vocoded stimuli and stimuli in noise at the levels used here.
In summary, this experiment revealed some interesting trends regarding the processing of acoustic speech signals. When acoustic cues and temporal fine structure were diminished, linguistic processing above and beyond recognition was deleteriously affected for both adults and children. For adults, this effect appeared to be due primarily to the diminishment of acoustic cues; adults seemed to benefit from the continued presence of temporal fine structure. Children performed similarly with AEs and speech embedded in noise, suggesting that children might simply be negatively affected by any signal degradation. Such degradation may create a kind of informational masking for children that is not present for adults. However, the current experiment on its own could not provide conclusive evidence concerning what it is about AEs that accounted for the decrements in performance seen for adults and children. Neither was this experiment on its own able to shed light on the extent to which listeners were able to recover explicitly phonetic structure from the acoustic speech signal, and so the extent to which observed effects on recall might have been due to hindrances in using phonetic structure for coding and retrieving items from a short-term memory buffer. The next experiment was undertaken to examine the extent to which recovery of phonetic structure is disrupted for adults and children with these signal-processing algorithms. This information could help to determine if the negative effects observed for short-term memory can be directly attributed to problems recovering that structure.
EXPERIMENT 2: RECOVERING PHONETIC STRUCTURE
The main purpose of this second experiment was to determine if the patterns of results observed in Experiment 1 were associated with listeners’ abilities to recover phonetic structure from the signals they were hearing. To achieve that goal, a task requiring listeners to attend explicitly to phonetic structure within words was used. Some tasks requiring attention to that level of structure require only implicit sensitivity; these are tasks such as nonword repetition (e.g., Dillon & Pisoni, Reference Dillon and Pisoni2001). Others require explicit access of phonemic units, such as when decisions need to be rendered regarding whether test items share a common segment (e.g., Colin, Magnan, Ecalle, & Leybaert, Reference Colin, Magnan, Ecalle and Leybaert2007). The latter sort of task was used here, and the specific task used is known as final consonant choice (FCC). This task requires listeners to render a judgment of which word, out of a choice of three, ends with the same final consonant as a target word. It has been used previously (Nittrouer, Reference Nittrouer1999; Nittrouer, Shune, & Lowenstein, Reference Nittrouer, Shune and Lowenstein2011), and consists of 48 trials. As with Experiment 1, the stimuli were processed as AEs and as speech in noise. Unlike Experiment 1, each listener heard words with only one of the processing strategies, as well as in their UP form. This design was used because dividing the 48 trials in the task across three conditions would have resulted in too few trials per condition.
Based on the findings of Experiment 1, it could be predicted that adults would show similarly accurate and fast responses for the UP stimuli and words in noise. A decrement in performance with AEs would be predicted for adult listeners. Children would be expected to perform less accurately than adults overall. It would be expected that children would perform best for the UP stimuli and show similarly diminished performance with both the AEs and words in noise. Children were not necessarily expected to be slower to respond than adults.
Although these predictions were based on outcomes of Experiment 1, data collection for the two experiments actually occurred simultaneously but on separate samples of listeners. All listeners in each group needed to meet the same criteria for participation, and both groups consisted of typical language users. Listeners were randomly assigned to each experiment. Consequently, the groups were considered to be equivalent across experiments, so results could be compared across experiments. It would have been desirable to use the same listeners in both experiments, but the designs of the experiments militated against doing so. In particular, listeners in this second experiment, on phonemic awareness, could only hear stimuli in one processed condition, AEs or speech in noise, without decreasing the numbers of stimuli in each condition too greatly. In the experiment on short-term memory, listeners heard stimuli processed in both manners. There seemed no good way to control for the possible effects of unequal experience with the two kinds of signals across experiments, so the decision was made to use separate samples of listeners.
Finally, this second experiment was designed to measure differences in phonetic recovery among signal processing conditions, and not phonological processing abilities per se. Therefore, it was important to include only listeners with typical (age-appropriate) sensitivities to phonetic structure. To make sure that the 8-year-olds had phonological processing abilities typical for their age, they completed a second phonemic awareness task, phoneme deletion (PD), with UP speech only. In this task, the listener is required to provide the real word that would derive if a specified segment were removed from a nonsense syllable. This task is more difficult than the FCC task because the listener not only has to access the phonemic structure of an item, but also has to remove one segment from that structure, and blend the remaining parts. Including 8-year-olds who scored better than 1 SD below the mean for their age from previous studies (Nittrouer, Reference Nittrouer1999; Nittrouer et al., Reference Nittrouer, Shune and Lowenstein2011) provided assurance that all had typical phonological processing abilities. Adults were assumed to have typical phonological processing abilities, both because none reported any history of language problems and because all read at better than a 12th-grade level.
Method
Listeners
Forty adults between the ages of 18 and 40 and 49 eight-year-olds participated. The 8-year-olds ranged in age from 7 years, 11 months to 8 years, 5 months. All listeners were recruited in the same manner and met the same criteria for participation as those described in Experiment 1. Additionally, the 8-year-olds in this experiment were given the Peabody Picture Vocabulary Test, Third Edition (PPVT-III; Dunn & Dunn, Reference Dunn and Dunn1997) and were required to achieve a standard score of at least 92 (30th percentile). Eight-year-olds also completed a PD task. This task was used in previous studies (Nittrouer, Reference Nittrouer1999; Nittrouer et al., Reference Nittrouer, Shune and Lowenstein2011) where it was found that typically developing second graders scored a mean of 24.8 items correct (SD = 6.2) out of 32 items. The 8-year-olds in this study were required to achieve at least 18 correct, which is 1 SD below that mean, in order to participate.
Equipment and materials
Equipment was the same as that described in Experiment 1. Custom-written software controlled the audio presentation of the stimuli. Children used a piece of paper printed with a 16-square grid and a stamp as a way of keeping track of where they were in the stimulus training (see Procedures Section).
Stimuli
The FCC task consisted of 48 test trials and 6 practice trials. Words are listed in Appendix A. These words were spoken by a man, who recorded the samples in random order. The FCC words were presented in three different ways: as UP, eight-channel noise vocoded versions of those productions (AE), and natural productions presented in noise at 0 or −3 dB SNR (NOI). The AE and NOI stimuli were created using the same methods as those used in Experiment 1. All stimuli were presented at a sampling rate of 22.05 kHz with 10-kHz low-pass filtering and 16-bit digitization.
For the PD task, there were 32 test items and 6 practice items, all recorded by the same speaker as the FCC words. These words are provided in Appendix B.
Procedures
The arrangement of the listener and experimenter in the test booth differed for this experiment from the first. Instead of the experimenter being at a 90-degree angle to the listener, as was the case in Experiment 1, the experimenter sat across the table from the listener. The keyboard used by the experimenter to control stimulus presentation and record responses was lower than the tabletop, so the listener could not see what the experimenter was entering.
Adults were tested in a single session of 45 min, and 8-year-olds were tested in one session of 45 min and a second session of 30 min over 2 days. The first session was the same for adults and 8-year-olds. The screening procedures (hearing screening and the Wide Range Achievement Test or Goldman–Fristoe) were administered first. Then the listener was trained with either the AE or NOI stimuli. Half of the listeners heard the AE stimuli, and half heard the NOI stimuli. Adults heard the NOI stimuli at a −3 dB SNR, and 8-year-olds heard the NOI stimuli at a 0 dB SNR. Adults were tested at only one SNR here because equating abilities across age groups to recognize stimuli was presumed to be critical in this experiment with so many stimuli; the task seemed closer to open-set recognition than the task in the first experiment. Again, adults achieve similar open-set recognition scores to children with 3 dB poorer SNRs (Nittrouer & Boothroyd, Reference Nittrouer and Boothroyd1990).
The training consisted of listening to and repeating each of the 192 words to be used, first in its UP form and then in its processed form. The purpose of this training was to give listeners opportunity to become acquainted with the kind of processed signal they would be hearing during testing; it was not meant to teach each word explicitly in its processed form. Listeners were told they would be learning to understand a robot's speech. Eight-year-olds stamped a square in a 16-square grid every time 12 UP–processed word pairs were presented, just to give them an idea of how close to completion they were.
After training, a 10-word repetition task was administered in order to determine the mean time it took the listener to repeat a single word. The software randomly picked 10 UP words from the FCC word list. The experimenter instructed the listener to repeat each word as soon as possible after it finished playing. The experimenter pressed the space bar to play each word, and then pressed the space bar again as soon as the listener started to say the word. The time between the offset of each word and the experimenter's space-bar press served as a measure of RT. These 10 RTs were averaged for each listener as a control for measures of RT made during testing. It served as an indication of the mean time it took for the listener to respond simply by repeating a word and for the experimenter to press the space bar.
The decision was made to have the experimenter mark the end of the response interval rather than using an automated method, such as a voice key, because of the difficulties inherent in testing children. Their voices tend to be breathy and/or soft, which requires threshold sensitivity to be set low. At the same time, children often fidget or make audible noises such as loud breathing, all of which can trigger a voice key, especially when threshold to activation is low. Consequently, it was deemed preferable to use an experimenter-marked response interval. In this case, the same individual (the second author) collected all data, so RT was collected with only one judge. She kept her finger near the spacebar, so she could respond quickly. In any event, the time it generally took for her to hit that spacebar was calculated into the time that would be used as a correction for RTs collected during testing.
After collecting measurements for corrected time, the experimenter told the listener the rules of the FCC task. The listener was instructed to repeat a target word (“Say _____”), and then to listen to the three choice words and report as quickly as possible which one had the same ending sound as the target word. The listener was told to pay attention to the sounds, and not how the words were spelled. The experimenter presented three practice trials by live voice and provided feedback to the listener. The experimenter then started the practice module of the FCC software. The six practice items were presented in natural, UP form. The program presented the target word in the carrier phrase “Say _____.” After the listener repeated the word, the three word choices were presented. The listener needed to say which of the three words ended in the same sound as the target word as quickly as possible. For these practice items, the listener was given specific, detailed feedback if needed. Then testing was conducted with the computerized program and digitized samples. No feedback was given during testing.
The software randomly presented half of the 48 stimuli in the processed condition (AE or NOI) and half in the UP condition in random order, with the stipulation that no more than two items in a row could be from the same condition. The word “say” was always presented in the UP form. For the AE or NOI stimuli, listeners were given three chances to repeat the target word exactly. If they did not repeat the processed target word exactly after three tries, the experimenter told them the word and they said it. The experimenter then pressed a key on the keyboard that triggered the playing of the three word choices. These words were never repeated. The experimenter hit the space bar as soon as the listener started to vocalize an answer. The time between the offset of the third word and the listener's initiation of a response was recorded by the software. The experimenter recorded whether the listener's response was correct or incorrect in the software.
The measures collected by the software were used to calculate for each listener the percentage of correct answers, mean overall RT, and mean RT for correctly answered items and incorrectly answered items for the processed and UP conditions separately. For each listener, a cRT for each condition was obtained by subtracting the mean time of the 10 control trials from the mean actual RT. A cRT for correctly answered items (cCART) and incorrectly answered items (cWART) was obtained in the same way.
On the second day, 8-year-olds were given the PPVT-III and were tested on the PD task. Although these tasks involved inclusionary criteria for this experiment, they were given after the FCC task so the FCC test procedures would be the same for adults and children. If the PD task had been given first to children, they would have had more practice with phonemic awareness tasks than adults. When the PD task was introduced, the experimenter first explained the rules and gave examples via live voice. In this task, the listener repeats a nonsense word, and then is asked to say that word without one of the segments, or “sounds,” a process that turns it into a real word. For example, “Say plig. Now say plig without the ‘L’ sound.” The correct real word in this case would be pig. Six practice trials were provided, and the listener was given specific feedback if needed. Testing was then conducted with the 32 PD items. No feedback was given during testing. RT was not recorded for this task. The listener was given three chances to repeat the nonsense word correctly. If they could not repeat it correctly, the experimenter recorded that the listener was unable to repeat it and moved on to the next nonsense word. That item was consequently scored as incorrect. If the listener repeated the nonsense word correctly, the program then played the sound deletion cue (“Now say ____ without the ____ sound.”) The experimenter either entered that the listener said the correct real word, or typed the word that was said into the computer interface, and it was scored as incorrect.
Results
Nine 8-year-olds scored lower than 18 items correct on the PD task, so their data were excluded from the study, leaving 40 8-year-olds. Those 8-year-olds scored a mean of 26.4 items correct (SD = 3.3) on the PD task, similar to the mean of 24.8 (SD = 6.2) for typical second graders in Nittrouer et al. (Reference Nittrouer, Shune and Lowenstein2011). The mean PPVT-III standard score across the 40 8-year-olds included in the study was 115 (SD = 10), which corresponds to the 84th percentile.
All listeners were able to correctly repeat all the AE and NOI stimuli during the training with the 192 words that were used in testing. Listeners generally repeated all words correctly when presented as targets during testing, as well. The most words any listener needed to have presented by the experimenter was 3, with a mean of 1.2 across listeners. In all cases, this was due to small errors in vowel quality, so none of these errors would have impacted listeners’ abilities to make consonant judgments had the experimenter not told them the target. Nonetheless, the option of excluding results from trials on which the listener was unable to correctly repeat the target was considered, so scores for percent correct on the overall FCC task were compared with those trials included and excluded. The greatest difference in scores occurred for 8-year-olds listening to NOI stimuli, and that difference was only 1.31 percentage points. All statistics were run with and without results for these trials, and no differences in results were found. Consequently the decision was made to report results with all trials included.
Correct responding
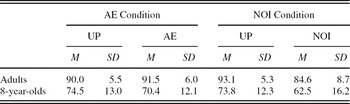
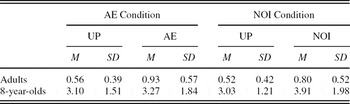
Table 7 shows the percentage of correct answers for adults and children for each condition. Both groups of listeners (AE and NOI) had nearly identical scores for the UP stimuli, with adults scoring 15% to 19% better than 8-year-olds. Because adults scored above the 90th percentile with the UP and AE stimuli, arcsine transforms were used in all statistical analyses. A two-way ANOVA with Age and Condition as between-subjects factors was done on results from the UP stimuli for listeners in the two condition groups to ensure there were no differences in results for those stimuli. That analysis was significant for Age, F (1, 76) = 57.54, p < .001, but not significant for Condition or the Age × Condition interaction (p > .10). This confirms observations that 8-year-olds made more errors than adults, but there was no difference between listeners as a function of which kind of processed stimuli they heard.
Mean and standard deviation percentage of correct responses for adults and 8-year-olds for stimuli in Experiment 2

Note: AE, eight-channel noise vocoded; NOI, speech in noise; UP, unprocessed.
Scores for the AE condition appear similar to UP scores, but scores for the NOI condition were about 11% lower than for UP, for both adults and 8-year-olds. A two-way ANOVA was performed on scores for these processed stimuli with Age and Condition as between-subjects factors. The main effect of Age was significant, F (1, 76) = 77.23, p < .001, as was the main effect of Condition, F (1, 76) = 10.66, p = .002, confirming that listeners performed differently with the two kinds of processed stimuli. The Age × Condition interaction was not significant, indicating that the difference across conditions was similar for both age groups.
Finally, scores were compared for the UP versus processed stimuli (AE or NOI) for each age group. Looking first at the AE condition, matched t tests performed on the UP versus AE scores for each age group separately were not significant. However, differences in scores for the UP versus NOI stimuli were statistically significant for both adults, t (19) = 4.41, p < .001, and for 8-year-olds, t (19) = 2.71, p = .014. For this sort of phonemic awareness task, performance was negatively affected by signals being embedded in noise, but not by being processed as AEs. That was true for adults and 8-year-olds.
RT for all trials
For the 10 control trials, the mean time for repeating words was 0.26 s (SD = 0.08 s) for adults and 0.31 s (SD = 0.08 s) for 8-year-olds. Even though this difference was small (0.05 s), it was significant for age, F (1, 76) = 8.55, p = .005. Children responded more slowly than adults, but not by very much.
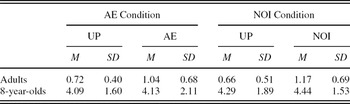
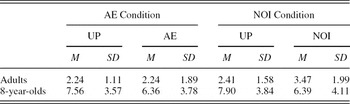
Table 8 shows mean cRTs for each group for selecting the word with the same final consonant as the target. For this measure, the difference between adults and 8-year-olds is striking: for the UP stimuli, adults took less than a second to respond while 8-year-olds took more than 4 s. These longer RTs could indicate that children required greater cognitive effort to complete the task, especially considering that adults’ and children's RTs on the control task differed by only 0.05 s. As with correct responding, cRTs for the UP stimuli were similar regardless of whether listeners additionally heard AE or NOI stimuli. This similarity was confirmed using a two-way ANOVA on cRTs for UP stimuli, with age and condition as factors: age was significant, F (1, 76) = 149.8, p < .001, but neither condition nor the Age × Condition interaction was significant.
Mean and standard deviation corrected response times (s) for adults and 8-year-olds for all stimuli in Experiment 2

Note: AE, eight-channel noise vocoded; NOI, speech in noise; UP, unprocessed.
Next, a two-way ANOVA was performed on cRTs for the two sets of processed stimuli. Age was significant, F (1, 76) = 104.56, p < .001, but neither condition nor the Age × Condition interaction was significant. This outcome means that even though listeners were more accurate with AE than with NOI stimuli, they were no faster to respond.
RTs for each age group were also examined separately. Adults had longer cRTs for the AE and NOI stimuli than they did for the UP stimuli. This was confirmed by matched t tests performed on cRTs for UP versus AE stimuli, t (19) = 3.21, p = .005, and UP versus NOI stimuli, t (19) = 4.25, p < .001. These longer RTs for processed stimuli indicate that greater cognitive effort was required to complete the task when stimuli were processed in some way. For the AE stimuli, these results mean that even though adults responded with the same level of accuracy as for the UP stimuli, it required greater effort. For the NOI stimuli, adults were both less accurate and slower than with the UP stimuli.
Eight-year-olds did not show any significant differences in cRTs for the AE and NOI stimuli, compared to the UP stimuli. This was confirmed by nonsignificant results for matched t tests performed on cRTs for UP versus AE stimuli and UP versus NOI stimuli. These results for 8-year-olds suggest that recovering explicitly phonetic structure from the acoustic speech signal is something that is intrinsically effortful for children, even for UP stimuli.
RT for correct and incorrect answers
In addition to looking at the overall RTs, the RTs for cCARTs only and cWARTs only were computed in order to examine the relative contributions of each to cRTs. Table 9 shows mean cCARTs for each age group. Adults remained faster than 8-year-olds, and cCARTs for UP stimuli appear similar across the two conditions. This was confirmed using a two-way ANOVA on cCARTs for UP stimuli with Age and Condition as factors: Age was significant, F (1, 76) = 125.49, p < .001, but neither Condition nor the Age × Condition interaction was significant.
Mean and standard deviation corrected response times (s) for correct answers only for adults and 8-year-olds for all stimuli in Experiment 2

Note: AE, eight-channel noise vocoded; NOI, speech in noise; UP, unprocessed.
As with the results for cRTs, adults had the shortest cCARTs for the UP stimuli and longer cCARTs for the AE and NOI stimuli. Results from matched t tests were significant for both UP versus AE, t (19) = 4.25, p < .001, and UP versus NOI, t (19) = 2.71, p = .01. Even when adults could derive the correct answer, their RTs were significantly longer with processed stimuli. Eight-year-olds had similar cCARTs for UP and AE stimuli but longer cCARTs for NOI stimuli. A matched t test for UP versus AE was not significant, but one for UP versus NOI was t (19) = 2.16, p = .04. Children were less accurate when responding to the NOI stimuli, and when they were able to answer correctly, it took them a little more time to respond. This was true even though overall cRTs did not differ for UP and NOI stimuli.
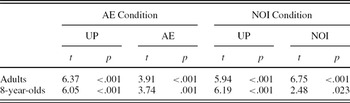
The results for cWARTs, shown in Table 10, reveal that both adults and 8-year-olds were much slower at responding when they responded incorrectly. This suggests that listeners were spending time thinking about their responses, rather than just quickly picking an answer. Table 11 shows matched t tests for cCART versus cWART for each age and condition separately. All were significant, so indicate that adults and children alike responded more slowly when they were wrong, and that was true across all conditions.
Mean and standard deviation corrected response times (s) for incorrect (wrong) answers only for adults and 8-year-olds for all stimuli in Experiment 2

Note: AE, eight-channel noise vocoded; NOI, speech in noise; UP, unprocessed.
Statistical outcomes of matched t tests performed on mean corrected response times (s) for correct versus incorrect (wrong) answers for adults and 8-year-olds separately in Experiment 2

Note: All groups, df = 19. AE, eight-channel noise vocoded; NOI, speech in noise; UP, unprocessed.
Discussion
The purpose of Experiment 2 was to examine how well adults and children were able to recover phonetic structure from AEs and words embedded in noise. Results of this experiment were meant to be combined with outcomes from Experiment 1 in order to examine the hypothesis that listeners need to be able to recover that phonetic structure for subsequent storage and retrieval of items in short-term memory.
Results of this second experiment indicate that both adults and children were able to recover phonetic structure equally well for UP speech and AEs, but embedding speech in noise led to decrements in performance. This was surprising, especially for adults: on the short-term memory task, adults had shown no performance decrement for noise-embedded speech, but did for AEs. These findings across experiments contradict traditional views of how the phonological loop operates to facilitate short-term memory (e.g., Baddeley & Hitch, Reference Baddeley, Hitch and Bower1974; Baddeley, Thomson, & Buchanan, Reference Baddeley, Thomson and Buchanan1975) because the condition that facilitated easiest and most efficient recovery of phonetic structure did not produce the best short-term memory results.
Looking only at adults’ results for this second experiment, it is clear they were able to recover phonetic structure from the AEs, even though those signals lacked both temporal fine structure and some acoustic cues, especially the ones associated with formant transitions. Likely this access to phonetic structure was facilitated by the mid- to high-frequency cues preserved in the AEs. Those sorts of cues are generally thought to play a strong role in consonant identity for adult listeners. However, this process of retrieving phonetic structure required greater cognitive effort for AEs than for UP signals. Even when responses were correct, adults’ RTs were slower for AEs, suggesting either that consonantal cues were not preserved perfectly in the AEs and/or signal degradation increased the perceptual load (i.e., greater informational masking). For signals embedded in noise, adults were both less accurate and slower to respond than they were with UP signals. This was probably due to energetic masking of the acoustic cues to consonant identity.
Children showed similar accuracy with UP stimuli and AEs but poorer performance with words embedded in noise. Although not quite as dramatic as the complete reversal of results seen for adults, this finding for children was surprising because they had similar outcomes with both sorts of degraded stimuli on the short-term recall task of Experiment 1. Another interesting aspect of children's response patterns was that there were no differences in overall RTs across signal conditions. That outcome suggests it is always effortful for children to recover phonetic structure, no matter what the signal properties are. As with Experiment 1, baseline RTs for children differed very little from those of adults, indicating they could generate a simple motor response rapidly. In contrast, RTs for providing the word choice showed large age effects: children were much slower than adults, a finding that is more similar than those of Experiment 1 (where no age effects were found) to other studies showing that children are slower than adults on tasks with large cognitive components (Fry & Hale, Reference Fry and Hale1996; Kail, Reference Kail1991).
GENERAL DISCUSSION
This study was designed to investigate linguistic processing with speech signals that have been altered in some way, primarily to address the question of whether being able to recover phonetic structure from speech signals is sufficient to ensure typical functioning on other linguistic processes. The motivation for this investigation was to advance our understanding of how patients with cochlear implants process speech. Many of these individuals perform well on word-recognition tasks administered in the clinic, which suggests they can recover word-internal phonetic structure reasonably well. Nonetheless, it remains unclear whether or not that clinical performance is enough to ensure that other kinds of linguistic processing are typical. To address this concern, AEs were derived from natural speech signals and used to modulate bands of noise. Although not perfect, this kind of signal provides a structural analog of what is available from implant processors. For comparison purposes, speech signals were also embedded in noise. Spectrographic analysis revealed that AEs preserved some of the mid- and high-frequency signal components that are considered to be acoustic cues to consonant identity. However, AEs were quite poor at representing either dynamic formant structure or temporal fine structure. In contrast, when words were embedded in noise, the mid- and high-frequency cues preserved in the AEs were obliterated, but formant structure and temporal fine structure were rather well preserved.
A second, but related, focus of the current series of experiments was on more general questions regarding the kinds of signal structure that support linguistic processing for listeners. Traditional models of higher order linguistic processes, including working memory for linguistic materials, suggest that being able to recover explicitly phonetic structure from speech signals is a necessary and sufficient condition for these other operations. By comparing outcomes for the kinds of signals described above, it was possible to test this traditional view.
Two experiments were conducted. The first looked at listeners’ abilities to code strings of items into a short-term memory buffer and immediately recall the order of those items. This task is considered to be higher order than word recognition because another cognitive function, working memory, is necessary to its operation. The second experiment examined listeners’ abilities to select the correct word out of three choices that ended in the same sound as a target word. This task unequivocally requires recovery of phonetic structure to reach a correct decision. Looking at results across these two experiments was done to address the related questions of whether being able to recover phonetic structure is necessary and sufficient to being able to store and retrieve items in short-term memory and whether there is signal structure not related to phonetic retrieval that supports short-term memory for linguistic signals.
Before this work was conducted, one potential outcome of the first experiment on short-term memory was that listeners might perform with degraded signals, particularly the AEs, just as they do for nonspeech signals. That outcome was considered possible given the lack in AEs of the spectral and temporal details that characterize speech. These are properties such as the temporal fine structure that arises from laryngeal activity and well-defined formants. However, both adults and children performed significantly better with both sorts of processed speech signals than with the nonspeech ESs. This finding suggests that even these impoverished speech signals are likely processed by the central auditory system as speech-like, and that is enough to accrue at least some of the advantage found for linguistic over nonlinguistic signals in working memory.
Adults’ outcomes
Results from adults help extend theories regarding how perception works in psycholinguistic tasks. In the short-term memory experiment, accuracy of adults’ recall was similar for UP signals and speech in noise, and poorer for AEs. On the phonemic awareness task, exactly the opposite pattern of results was observed. Adults performed indistinguishably in terms of accuracy for UP signals and AEs, and more poorly for the speech in noise condition. If we take performance on the phonemic awareness task as a valid indicator of listeners’ abilities to recover phonetic structure, the conclusion must be reached that access to that structure does not ensure typical performance in other linguistic processes. Conversely, difficulty recovering phonetic structure, in this case for speech in noise, does not necessarily hinder adults’ abilities to store and retrieve words in a short-term memory buffer. The temporal fine structure preserved when speech is embedded in noise (at least at the levels used in this study) apparently helps listeners (at least adults) with other sorts of linguistic processes.
Another contradiction between the two experiments for adults was that the time required for them to recall word order in Experiment 1 was not significantly longer (when Bonferroni corrections were applied) for AEs than for UP signals, even though significantly longer times were needed to recover phonetic structure in Experiment 2. Again this finding suggests that listeners may not necessarily be recovering phonetic units prior to storing words in a short-term memory buffer. Of course, one potential constraint on this conclusion is that separate samples of listeners were used in the two experiments. Even though these samples were equivalent in demographic terms, there is no way to know for certain if they were precisely the same. Future investigation should try to replicate these findings using a within-subjects design.
Taken together, these results reveal a clear disassociation in adults’ performance for recovering phonetic structure and performing a higher order linguistic task. Although surprising perhaps in the strength of the effect, this result was not completely unpredicted. Work by others has shown that listeners, at least adults, can and do shift their attention among sources of information available during speech processing, depending on the kind of processing load introduced (Mattys, Brooks, & Cooke, Reference Mattys, Brooks and Cooke2009). In a similar vein, it was found here that different sorts of signal structure were recruited and brought to bear on different kinds of psycholinguistic functions. Thus, it may be that the sensory information listeners use may differ depending on the language function being performed. Traditional acoustic cues may be the primary workhorse when the recovery of phonetic structure is required. For other language processes, such as storing and retrieving words in a short-term memory buffer, it seems that listeners form a more robust representation using more and different components of the acoustic signal (e.g., Conway, Pisoni, & Kronenberger, Reference Conway, Pisoni and Kronenberger2009). This latter suggestion is not new (Goldinger, Reference Goldinger1996), but differs from descriptions of language processing more commonly offered by psycholinguists. According to traditional accounts, listeners rely on a small number cues to recover phonetic segments from the signal, which are in turn used for all subsequent linguistic processing (e.g., Chomsky & Halle, Reference Chomsky and Halle1968; Liberman, Delattre, Gerstman, & Cooper, Reference Liberman, Delattre, Gerstman and Cooper1968). According to this account, details such as those associated with laryngeal functioning are filtered out. The data collected from adults in this study are at odds with that perspective. Rather, these data support an account suggesting that words are stored in short-term memory buffers using very concrete, detailed auditory codes (Port, Reference Port2007). At the same time, that temporal fine structure seemed to serve no purpose in Experiment 2, where the perceptual goal was recovery and explicit examination of word-internal phonetic structure.
Children's outcomes
For children, a slightly different pattern of results was observed across experiments. As found for adults, words embedded in noise were the stimuli in Experiment 2 that presented problems when it came to recovering phonetic structure; AE versions of these words did not. Nonetheless, both kinds of signal processing hampered children's abilities to store and retrieve word order in short-term memory in Experiment 1. In both experiments, children's RTs were similar across all three speech conditions. In Experiment 1, these times were similar to those of adults; in Experiment 2, they were significantly slower. As with outcomes from adults, these cross-experiment results contradict common claims of how short-term memory operates, which hold that phonetic structure is critical to the process. If that were so, the processing condition that best supported recovery of phonetic structures (AEs) should have resulted in superior recall on the short-term memory task. That was not observed for either group of listeners.
Specifically regarding Experiment 2, results indicated that recovering phonetic structure from the speech signal does not happen as readily for children as for adults. Even these children who were 8 years of age, by which time reading is well on its way to being acquired, were slower than adults, and RTs were similar across stimulus types. Nonetheless, the signal information these children used in that process of recovering segmental structure was apparently the same as the information adults used, a conclusion based on the finding that children, like adults, were as accurate with AEs as with UP signals. Diminished performance was found only for signals embedded in noise. While the longer RTs suggest it was effortful for them, 8-year-olds were nonetheless able to use the mid- and high-frequency signal properties in the AEs to recover phonetic segments but were hindered when it came to the noise-embedded signals. Although substantial evidence shows that young children typically weight formant transitions more and the kinds of acoustic cues preserved by AEs less than adults, those results have most often been obtained with children younger than 8 years old. Younger children might very well demonstrate greater difficulty on phonological processing tasks with AEs, if they were tested.
Theoretical and clinical implications
There are numerous implications to be derived from these results. Regarding general psycholinguistic theory, evidence was found to indicate that acoustic structure not associated explicitly with phonetic units supports how adults code, store, and retrieve items from short-term memory. By contrast, only acoustic structure fitting the description of traditional acoustic cues seems pertinent to tasks requiring phonetic segmentation for adults. For children, any kind of signal degradation interfered with their abilities to perform the higher order linguistic task of storing and immediately retrieving words from a short-term memory buffer. That outcome suggests that the mechanism of effect might have been that these signal processing algorithms added a perceptual or cognitive load to the task for children, an effect that fits the definition of informational masking.
These outcomes also have implications regarding patients with cochlear implants. It is clear that performance on standard word-recognition tasks can not be relied on to gauge how well deaf patients using cochlear implants will function with more complex linguistic processing. Clinical tools involving higher-order processes need to be administered. Similarly, stronger efforts should be given to developing interventions for these patients that focus on linguistic processes other than word recognition, such as short-term memory (Kronenberger, Pisoni, Henning, Colson, & Hazzard, Reference Kronenberger, Pisoni, Henning, Colson and Hazzard2011). Finally, research attempting to develop new signal-processing strategies for cochlear implants should include more than phoneme or word recognition as dependent measures. The results of the current study clearly suggest that how the acoustic speech signal is processed will affect linguistic processing well beyond simple recognition. The kinds of signal structure used for one kind of linguistic function may differ from that used for other functions. Understanding the relationship between processing strategies used by auditory prostheses, such as a cochlear implants, and performance on linguistic tasks should be the focus of future investigations.
APPENDIX A
Items from the final consonant choice task

APPENDIX B
Items from the phoneme deletion task

ACKNOWLEDGMENTS
This work was supported by Research Grant R01 DC-00633 from the National Institute on Deafness and Other Communication Disorders, the National Institutes of Health (to S.N.). We thank Mallory Monjot for her help with stimulus creation and James Quinlan and Christopher Chapman for help with programming. Portions of this work were presented at the 159th Meeting of the Acoustical Society of America in Baltimore, Maryland, in April 2010.