Introduction
Savannas cover more than 50% of the African continent, featuring diverse tree cover and grasslands (Osborne et al. Reference Osborne, Charles-Dominique, Stevens, Bond, Midgley and Lehmann2018). Fires and herbivore activities not only limit the recruitment of savannah trees below a rainfall-based potential (Bond Reference Bond2008; Sankaran et al. Reference Sankaran, Hanan, Scholes, Ratnam, Augustine, Cade, Gignoux, Higgins, Le Roux, Ludwig, Ardo, Banyikwa, Bronn, Bucini, Caylor, Coughenour, Diouf, Ekaya, Feral, February, Frost, Hiernaux, Hrabar, Metzger, Prins, Ringrose, Sea, Tews, Worden and Zambatis2005) but also influence their structure and diversity (Bond and Keeley Reference Bond and Keeley2005). While studies indicate that woody vegetation in numerous non-protected savannas has changed due to fire regimes (i.e., intentional fires) (Júnior et al. Reference Júnior, Oliveira, Pereira and Turkman2014), the frequency of fire regimes (Eckhardt et al. Reference Eckhardt, van Wilgen and Biggs2000; Shackleton and Scholes Reference Shackleton and Scholes2000), and herbivore activities (Britts et al. Reference Britts, van Rooyen and van Rooyen2002; Rutina et al. Reference Rutina, Moe and Swenson2005) also show similar changes in cover and density of shrubs and trees in Kruger and Chobe National Parks. Although fire regimes play a critical role in maintaining savannas (Bond Reference Bond2008), the frequency of wildfires beyond historical fire intervals can damage plant community structure or reduce their populations in national parks and game reserves (Balfour and Howison Reference Balfour and Howison2001; Foster et al. Reference Foster, Barton, Robinson, MacGregor and Lindenmayer2017; Van Wilgen et al. Reference Van Wilgen, Govender and Biggs2007). While many savanna plants have adaptations to cope with fire, excessively frequent fires can increase tree mortality rates among small individuals (Gomes et al. Reference Gomes, Maracahipes, Marimon, Reis, Elias, Maracahipes-Santos, Hur Marimon-Junior and Eddie Lenza2014; Hoffmann and Solbrig Reference Hoffmann and Solbrig2003; Medeiros and Miranda Reference Medeiros and Miranda2005) and ultimately diminish the recruitment of woody species (Lenza et al. Reference Lenza, Abadia, Menegat, Lúcio, Maracahipes-Santos, Mews, dos Santos and Martins2017). Apart from frequent fires as one of the notable disturbances in protected areas, herbivore activities, especially by species like elephants, also contribute to the transformation of tree communities. For instance, studies in the Serengeti Mara woodland have shown that the African elephant Loxodonta africana can convert woodlands from one state to another (Dublin et al. Reference Dublin, Sinclair and McGlade1990) by causing changes in vegetation structure and composition (Calenge et al. Reference Calenge, Maillard, Gaillard, Merlot and Peltier2002; Rutina et al. Reference Rutina, Moe and Swenson2005). Such disturbances will not only affect the woody community but also impact the wildlife that utilize the vegetation as their food source, shelter, and breeding purposes. For instance, a study in Chobe National Park revealed that herbivore activities not only reduced the woodland cover but also transformed the woody species composition to shrublands, leading to a decrease in the amount of dry-season browse for impalas (Rutina et al. Reference Rutina, Moe and Swenson2005).
Studies have shown that invasive alien plant species (IAPS) pose a substantial threat to global plant diversity (Millennium Ecosystem Assessment 2005; Richardson et al. Reference Richardson, Pyšek, Rejmánek, Barbour, Panetta and West2000) by reducing native plant diversity and altering ecosystem processes (Blackburn et al. Reference Blackburn, Essl, Evans, Hulme, Jeschke, Kühn, Kumschick, Marková, Mrugała, Nentwig, Pergl, Pyšek, Rabitsch, Ricciardi, Richardson, Sendek, Vilà, Wilson, Winter, Genovesi and Bacher2014; Zenni and Simberloff Reference Zenni and Simberloff2013). These threats have been observed in South Africa’s National Parks (van Wilgen et al. Reference van Wilgen, Reyers, Le Maitre, Richardson and Schonegevel2007), the Afromontane regions (Jimu Reference Jimu2011), the Bvumba Mountains (Chakuya et al. Reference Chakuya and Mandisodza-Chikerema2023), as well as in Zimbabwe and Tanzania’s Ngorongoro Crater (Ngondya and Munishi Reference Ngondya and Munishi2021). The spread of IAPS has been reported to threaten native species in the Table Mountain National Park (Richardson et al. Reference Richardson, van Wilgen, Higgins, Trinder-Smith, Cowling and Mckell1996; van Wilgen Reference van Wilgen2012), Kruger National Park (Foxcroft et al. Reference Foxcroft, Richardson and Wilson2008, Reference Foxcroft, Spear, van Wilgen and McGeoch2019; Keet et al. Reference Keet, Datta, Foxcroft, Kumschick, Nichols, Richardson and Wilson2022), Hluhluwe-Imfolozi Game Reserve (Foxcroft et al. Reference Foxcroft, Van Wilgen, Baard and Cole2017), and the Cape Floristic Region (Cowling et al. Reference Cowling, Pressey, Rouget and Lombard2003) in South Africa. Consequently, the presence of IAPS such as Mentha longifolia and Chromolina odorata in Ghana’s Mole National Park (MNP) could threaten the native woody community.
Soil resources are recognised as key carriers of biodiversity and vital for ecosystem stability (Wuepper et al. Reference Wuepper, Pasquale Borrelli and Finger2020). However, they face degradation through erosion at an average global rate of 2.4 t/ha/yr (Wuepper et al. 2020). Soil erosion, involving the detachment, transportation, and deposition of surface materials, leading to features such as low surfaces, rills, gullies, and heaps of soil, is common in many protected areas (Krenz et al. Reference Krenz, Greenwood and Kuhn2021). In protected areas such as the Kruger and Mokala National Parks within African savanna biomes, water-induced soil erosion has been linked to diverse biophysical conditions and human activities related to land use, even though climate change could be exacerbating the susceptibility of national parks to soil erosion (Chapungu et al. Reference Chapungu, Nhamo, Dube and Chikodzi2023). Aside from water-induced erosion, post-fire-induced erosion has been identified as one of the major drivers of erosion at the global landscape scale (Noske et al. Reference Noske, Nyman, Lane, Francis, Rengers and Sheridan2024). Thus, given the location of Northern Ghana in a high conservation concern area (where low and unpredictable rainfall and extremely high temperatures are common), the MNP could equally be more vulnerable to soil erosion, potentially impacting the woody community and broader biodiversity components.
Despite being the largest park in West Africa, MNP, located in Ghana’s fire-prone Savannah Region, has continually faced frequent wildfires (Amoako et al. Reference Amoako, Issifu and Husseini2023; Sackey and Hale Reference Sackey and Hale2008) and herbivore activities (Ashiagbor and Danquah Reference Ashiagbor and Danquah2017). Recent studies have shown how the effect of prescribed burning contributed to changes in the wood community composition and structural attributes (Amoako et al. Reference Amoako, Issifu and Husseini2023). Aside from prescribed burning that originates from within the park (Mole National Park Management Plan 2005–2010), an informal discussion with the Park Manager (Mr Mahama, pers. comm.) revealed that frequent fires, especially those originating from park-adjacent communities, have increased in recent times, particularly during the dry season. These wildfires spread into the park from adjacent communities, particularly during land preparation for farming or when burning occurs to attract game for hunting and charcoal production. Although the occurrence of wildfires contributes to opening up the vegetation and stimulating the growth of juveniles or young recruits, their frequency of occurrence and changing regimes may not only have far-reaching impacts on the structure of the woody community by altering its composition and causing homogenization but also affect the ungulates that rely on the vegetation for their feed, shelter, and breeding grounds. As the regional population continues to grow, human pressures, combined with climatic impacts, are likely to undermine the ecological integrity of the park, which is situated within a high-conservation-concern ecosystem. There is already evidence of an emerging threat to similar protected areas in neighbouring Togo’s Savannah Region, which has witnessed substantial transformation of its woodland community into grassland and a reduction in the area of specific plant communities following illegal tree felling for charcoal and wood fuel production (Fousseni et al. Reference Fousseni, Marra, Wala, Batawila, Zhang, Xiu-Hai Zhao and Akpagana2012).
To date, scientific studies on the response of the woody community structure to various disturbance-related drivers in MNP are scant (e.g., Amoako et al. Reference Amoako, Issifu and Husseini2023; Sackey and Hale Reference Sackey and Hale2008). The mechanisms by which wildfires, herbivore activities, invasive alien plant species, erosion, and bare ground influence the woody community structure in the five vegetation types (i.e., the woodland, savanna forest, riparian forest, swamp forest, and the boval vegetation) in the park (Schmitt and Adu-Nsiah Reference Schmitt and Adu-nsiah1993) and (Torello-Raventos et al. Reference Torello-Raventos, Feldpausch, Veenendaal, Schrodt, Saiz, Domingues, Djagbletey, Ford, Kemp, Marimon, Junior, Lenza, Ratter, Maracahipes, Sasaki, Sonké, Zapfack, Taedoumg, Villarroel, Schwarz, Quesada, Ishida, Nardoto, Affum-Baffoe, Arroyo, Bowman, Compaore, Davies, Diallo, Fyllas, Gilpin, Hien, Johnson, Killeen, Metcalfe, Miranda, Steininger, Thomson, Sykora, Mougin, Hiernaux, Bird, Grace, Lewis, Phillips and Lloyd2013) remain unknown. Therefore, it is crucial to determine how the woody species respond to these disturbances and to propose the appropriate conservation measures needed, as the survival of wildlife is inextricably linked to the well-being of the park’s vegetation. This study aimed to determine how the woody species responded to wildfires, herbivory activities, invasive alien plant species, erosion, and bare ground in MNP. To achieve this, we posed the following questions: (1) Are there similarities in the species composition across the five vegetation types? (2) Are there variations in the patterns of species abundance and distribution among the five vegetation types? We hypothesised that the effects of wildfires, herbivory activities, invasive alien plant species, erosion, and bare ground on the tree community structure will differ across the five vegetation types, as individual species respond differently to various drivers (Jara-Guerrero et al. Reference Jara-Guerrero, González-Sánchez, Escudero and Espinosa2021; Sotelo-Caro et al. Reference Sotelo-Caro, Valencia-Díaz, Infante-Mata, Castillo-Campos and Flores-Palacios2023) and that (2) each vegetation type exhibits distinct signs of disturbance (for instance, shrubland and Boval vegetation are characterised by high levels of fire, while woodland displays significant signs of animal trampling).
Materials and methods
Study area
MNP is the largest savanna woodland national park in West Africa (Torello-Raventos et al. Reference Torello-Raventos, Feldpausch, Veenendaal, Schrodt, Saiz, Domingues, Djagbletey, Ford, Kemp, Marimon, Junior, Lenza, Ratter, Maracahipes, Sasaki, Sonké, Zapfack, Taedoumg, Villarroel, Schwarz, Quesada, Ishida, Nardoto, Affum-Baffoe, Arroyo, Bowman, Compaore, Davies, Diallo, Fyllas, Gilpin, Hien, Johnson, Killeen, Metcalfe, Miranda, Steininger, Thomson, Sykora, Mougin, Hiernaux, Bird, Grace, Lewis, Phillips and Lloyd2013). It is located in two physiographic regions: the savannah high plains, which constitute 65% of the entire park area and the Voltaian sandstone basin. The park is primarily managed for ecological conservation and recreation and comes under Category II of the IUCN protected area classification system (Dudley Reference Dudley2008). The dominant land cover within the park is that of the open/closed woodland Savannah, with grass undergrowth and open grassland found in areas with shallow soils (Burton Reference Burton2010; Schmitt and Adu-Nsiah Reference Schmitt and Adu-nsiah1993). The different vegetation types serve as a major source of forage, cover against predation, nesting/breeding sites for ungulates and birds (Nsor et al. Reference Nsor, Antobre, Mohammed and Mensah2018), and the protection of rivers and their tributaries from reduced erosion and the moderation of flooding. The park is situated in an area of high conservation concern, where recent cascading environmental and climatic factors may have contributed to transforming the vegetation of the National Park (Armah et al. Reference Armah, Yawson, Yengoh, Odoi and Afrifa2010; Jung and Kunstmann Reference Jung and Kunstmann2007; Laube et al. Reference Laube, Schraven and Awo2012).
MNP is state-owned and managed by the Wildlife Division of the Forestry Commission of Ghana and was gazetted in the year 1971. It covers an area of 4,577 km2 and lies within geographic coordinates of 9°12’–10°06’ North and 1°25’–2°17’ West with an elevation of 120 to 490 meters above sea level (Figure 1). The mean annual temperature is 28°C, which varies from 26°C in December to 31°C in March. The park is a part of the White Volta basin, and Mole and Lovi are two of the main rivers and streams that drain into the White Volta. The average annual rainfall is about 1100 mm, decreasing to 1000 mm in the north of the park (MNP 2016). The park has fairly undisturbed Guinea Savannah vegetation, with the dominant vegetation being open savannah woodland with grasses (Schmitt and Adu-Nsiah Reference Schmitt and Adu-nsiah1993). Short grasslands are found around shallow soils and iron pans and may reach 3 m high in the wet season. Narrow bands of the riverine forest also grow along most of the streams, swamps, floodplains, and grasslands (Schmitt and Adu-Nsiah Reference Schmitt and Adu-nsiah1993). The park is fairly flat, with a narrow escarpment running north-south. Soils are mostly plinthic ferrasols in the south and rhodic nitisols in the north, with the ferrasols often developing a hardened layer of the iron pan (MNP 2016).
Map of Ghana, showing the study area at Mole National Park in the Savanna Region. The five vegetation types in the park where plant data were collected are represented in different colours.

Woody sampling procedure
We initially laid a 1 km × 1 km grid of cells on the TM Landsat 4 image, covering all five vegetation types, with pairs of random numbers used to locate each sampling point. This was followed by a field survey to identify and mark out the different vegetation types on the topographic map of the study area, using a Garmin Etrex GPS. The identified vegetation types, referred here as the dominant plant cover or plant community type, in a geographical area in the park, include woodland, savannah forest, riparian forest, swamp forest, and boval vegetation (see supplementary 1 for a detailed description of the five vegetation types). Sampling was carried out in 125 plots across the five vegetation types (25 plots each per vegetation type), between February and May 2022. A stratified random sampling approach (Grabherr et al. Reference Grabherr, Reiter and Willner2003; Stohlgren et al. Reference Stohlgren, Coughenour and Chong1997) was used to assess plant species among the five vegetation types. This approach was to ensure that individuals of the sampled species population had an equal chance of being represented from all five vegetation types and to maximize species heterogeneity. Only trees of height ≥ 1.4 m above ground level and a DBH of ≥ 5 cm were sampled in plots with 20 × 20 m (400 m2) dimensions. We sampled twice, covering four months (i.e., February–May), and only newly identified species in the repeated sampling were recorded. This repeated sampling activity was necessary because by late April to May, the park experiences early rainfall, ushering in the beginning of the wet season. Thus, new saplings or juveniles begin to emerge. Tree cover abundance per plot was estimated and expressed in percentage terms using the Daubenmire cover-abundance scale (see Daubenmire Reference Daubenmire1959). Species frequency and presence/absence were also recorded. Plants were identified in situ up to the species level, with the aid of keys provided by Arbonnier (Reference Arbonnier2004). Specimens that could not be identified in the field were placed in a plant press and taken to the Resources Management Support Centre Herbarium of the Ghana Forestry Commission, for identification by a plant taxonomist.
Assessment of predictive variables
Disturbance-related drivers such as fire, herbivory, erosion, bare ground, and IAPS were identified and measured in plots where the plant species were sampled (Supplementary 2). A driver is defined according to the Millennium Ecosystem Assessment as any natural or human-induced factor that directly (physical and biological) or indirectly causes a change in an ecosystem (Carpenter et al. Reference Carpenter, Bennett and Peterson2006). A direct driver influences ecosystem processes, while an indirect driver operates more diffusely by changing one or more direct drivers (Nelson et al. Reference Nelson, Bennett, Berhe, Cassman, DeFries, Dietz, Dobermann, Dobson, Janetos, Levy, Marco, Nakicenovic, O'Neill, Norgaard, Petschel-Held, Ojima, Pingali, Watson and Zurek2006). Each of the identified drivers was then quantified by considering the scope and severity of the impact on the plant community per plot, by adopting the categorical approach provided by Salafsky et al. (Reference Salafsky, Salzer, Stattersfield, Hilton-Taylor, Neugarten, Butchart, Collen, Cox, Master, O'Connor and Wilkie2008) and Battisti et al. (Reference Battisti, Luiselli and Teofili2009). For ‘scope’, we referred to the percentage ratio of the plot per vegetation type affected by a specific driver within the last 5 years (Battisti et al. Reference Battisti, Luiselli and Teofili2009), while for ‘severity’, we referred to the degree to which a driver has impacted the integrity of the plant community within the last 5 years. Thus, a one-on-one field interview was conducted with the park manager and auxiliary staff of the park to verify whether all the identified disturbance-related drivers in this study persisted in the last 5 years and beyond (Battisti et al. Reference Battisti, Luiselli and Teofili2009). Following confirmation of the persistence of each driver, we proceeded to measure them in each sample plot where they occurred, in the five vegetation types. The scores for the scope of the drivers were assigned as follows: 4 (highest) = if the occurrence of the driver is found throughout 50% of the sample plot; 3 (moderate) = if the occurrence of the driver is spread in 15–50% of the sample plot; 2 (less moderate) = if the occurrence of the driver is scattered in 5–15% of the sample plot; and 1 (less) = if the occurrence of the driver is much localized (<5% of the sample plot) (Battisti et al. Reference Battisti, Luiselli and Teofili2009). For ‘Vitex chrysocarpaseverity’, a score of 4 was assigned if the driver impact led to severe damage on the plant structure or loss of species; 3 if the driver impact induced moderately severe damage on the plant structure; 2 if the driver impact induced moderate damage to the plant; and 1 if the driver induced little or no damage (Salafsky et al. Reference Salafsky, Salzer, Stattersfield, Hilton-Taylor, Neugarten, Butchart, Collen, Cox, Master, O'Connor and Wilkie2008). For altitude as a physical factor, a score of 1 to 4 was also assigned. Thus, a score of 1 = ≤ 100 – 150 m a.s.l; 2 = 151 – 200 m a.s.l; 3 = 201 – 300 m a.s.l; and 4 = 301 – ≥ 400 m a.s.l.
We finally calculated the ‘‘magnitude’, which is the combination (sum) of the value score for scope and severity assigned to a specific driver per plot and ranked from highest to lowest (Salafsky et al. Reference Salafsky, Salzer, Stattersfield, Hilton-Taylor, Neugarten, Butchart, Collen, Cox, Master, O'Connor and Wilkie2008). These anthropogenic drivers of change can either be added together, multiplied, or averaged since relative order does not change in arithmetic calculations (addition, multiplication, or average) (Salafsky et al. Reference Salafsky, Salzer, Stattersfield, Hilton-Taylor, Neugarten, Butchart, Collen, Cox, Master, O'Connor and Wilkie2008).
Statistical analysis
-
(1) Are there similarities in the species composition across the five vegetation types?
We initially tested for differences in species abundance, richness, and diversity among the five vegetation types, using a Kruskal–Wallis H test (a rank-based nonparametric test approach). Principal coordinate analysis (PCoA – also known as metric multidimensional scaling) was used to summarise the compositional distinctness of the vegetation categories using Euclidean dissimilarity on square-root transformed percentage cover scores (Gower Reference Gower1966). This was followed by an analysis of similarity (ANOSIM; Clarke and Warwick Reference Clarke and Warwick2001; McCune and Grace Reference McCune and Grace2002) with 999 permutations to test for differences in species composition among the five vegetation types. The ANOSIM statistic R is based on the difference of mean ranks between and within groups: cap R equals (r cap B minus cap R cap W) over (cap N (cap N minus 1 over 4)). A cap R minus value closer to ‘1.0’ indicates that species composition across the five vegetation types differs. In contrast, a cap R-value near ‘0’ indicates that high and low rankings are evenly distributed within and between the sampled vegetation. Cap R minus values less than 0 indicates that differences within groups are greater than those between groups (Clarke and Gorley Reference Clarke and Gorley2001). Once a significant difference was established across the five vegetation types, we proceeded to identify the taxon that best determines the dissimilarity among these vegetation types by computing similarity percentages (SIMPER) based on Bray–Curtis similarity, using a cut-off for low contributions of 70% (Somerfield and Clarke Reference Somerfield and Clarke2013). PERMANOVA (Anderson and Walsh Reference Anderson and Walsh2013) was used to test the null hypotheses that (a) community assemblages and structural attributes responding to these drivers will not be similar among the five vegetation types and (b) processes structuring plant assemblages will not vary among these vegetation types. PERMANOVA facilitates the analysis of beta diversity (variation in community structure) across multiple spatial or temporal scales, which is quantified directly by the components of variation (Anderson et al. Reference Anderson, Crist, Chase, Vellend, Inouye, Freestone, Sanders, Cornell, Comita and Davies2011).
Canonical correspondence analysis (CCA) (Kent and Coker Reference Kent and Coker1992; ter Braak Reference ter Braak, Jongman, ter Braak and Van Tongren1987 a, Reference ter Braak1987 b) was used to evaluate the influence of the disturbance-related drivers on species assemblages, measured in each of the 125 plots. CCA is a direct gradient analysis that incorporates correlation and regression between plant data and environmental factors (Kent and Coker Reference Kent and Coker1992; ter Braak and Prentice Reference ter Braak and Prentice1988) and extracts the most important variables from these two datasets (ter Braak and Verdonschot Reference ter Braak and Verdonschot1995). The Kruskal–Wallis test was also performed for differences in disturbance-related drivers across the five vegetation types.
-
(2) Are there variations in the pattern of species abundance and distribution among the five vegetation types?
Species abundance distribution patterns were quantified using the generalised Fisher’s logarithmic (GFL) series (Fisher et al. Reference Fisher, Corbet and Williams1943; Kempton Reference Kempton1975). This model was used to fit species abundance data, and each species was ranked in a declining abundance order (Magurran Reference Magurran2004). The GFL series was used because it gives a better overall fit for plant data than a log-normal model (Kempton Reference Kempton1975) and is superior to classical distribution plots for fitting (Preston Reference Preston1948), because they do not lose information and are not biased as a result of the grouping of species (Ulrich et al. Reference Ulrich, Ollik and Ugland2010). The GFL series model equation is provided below:
 $$\alpha \chi, \alpha {\chi ^2}/2,\alpha {\chi ^3}/3 \ldots \alpha {\chi ^n}/n$$
where αχ is the number of species predicted to have one individual, and αχ2 to have two individuals. We estimated χ from the iterative solution of:
 $$S/N = \left( {1 - \chi } \right)/\chi ( - ln(1 - \chi ))$$
where S = number of species, and N = number of individuals.
All analyses were conducted using the PAST version. 3.06 software package (Hammer et al. Reference Hammer, Harper and Ryan2001).
Results
Variability in woody species compositional distinctiveness across the five vegetation types
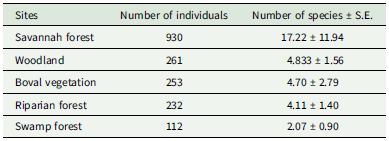
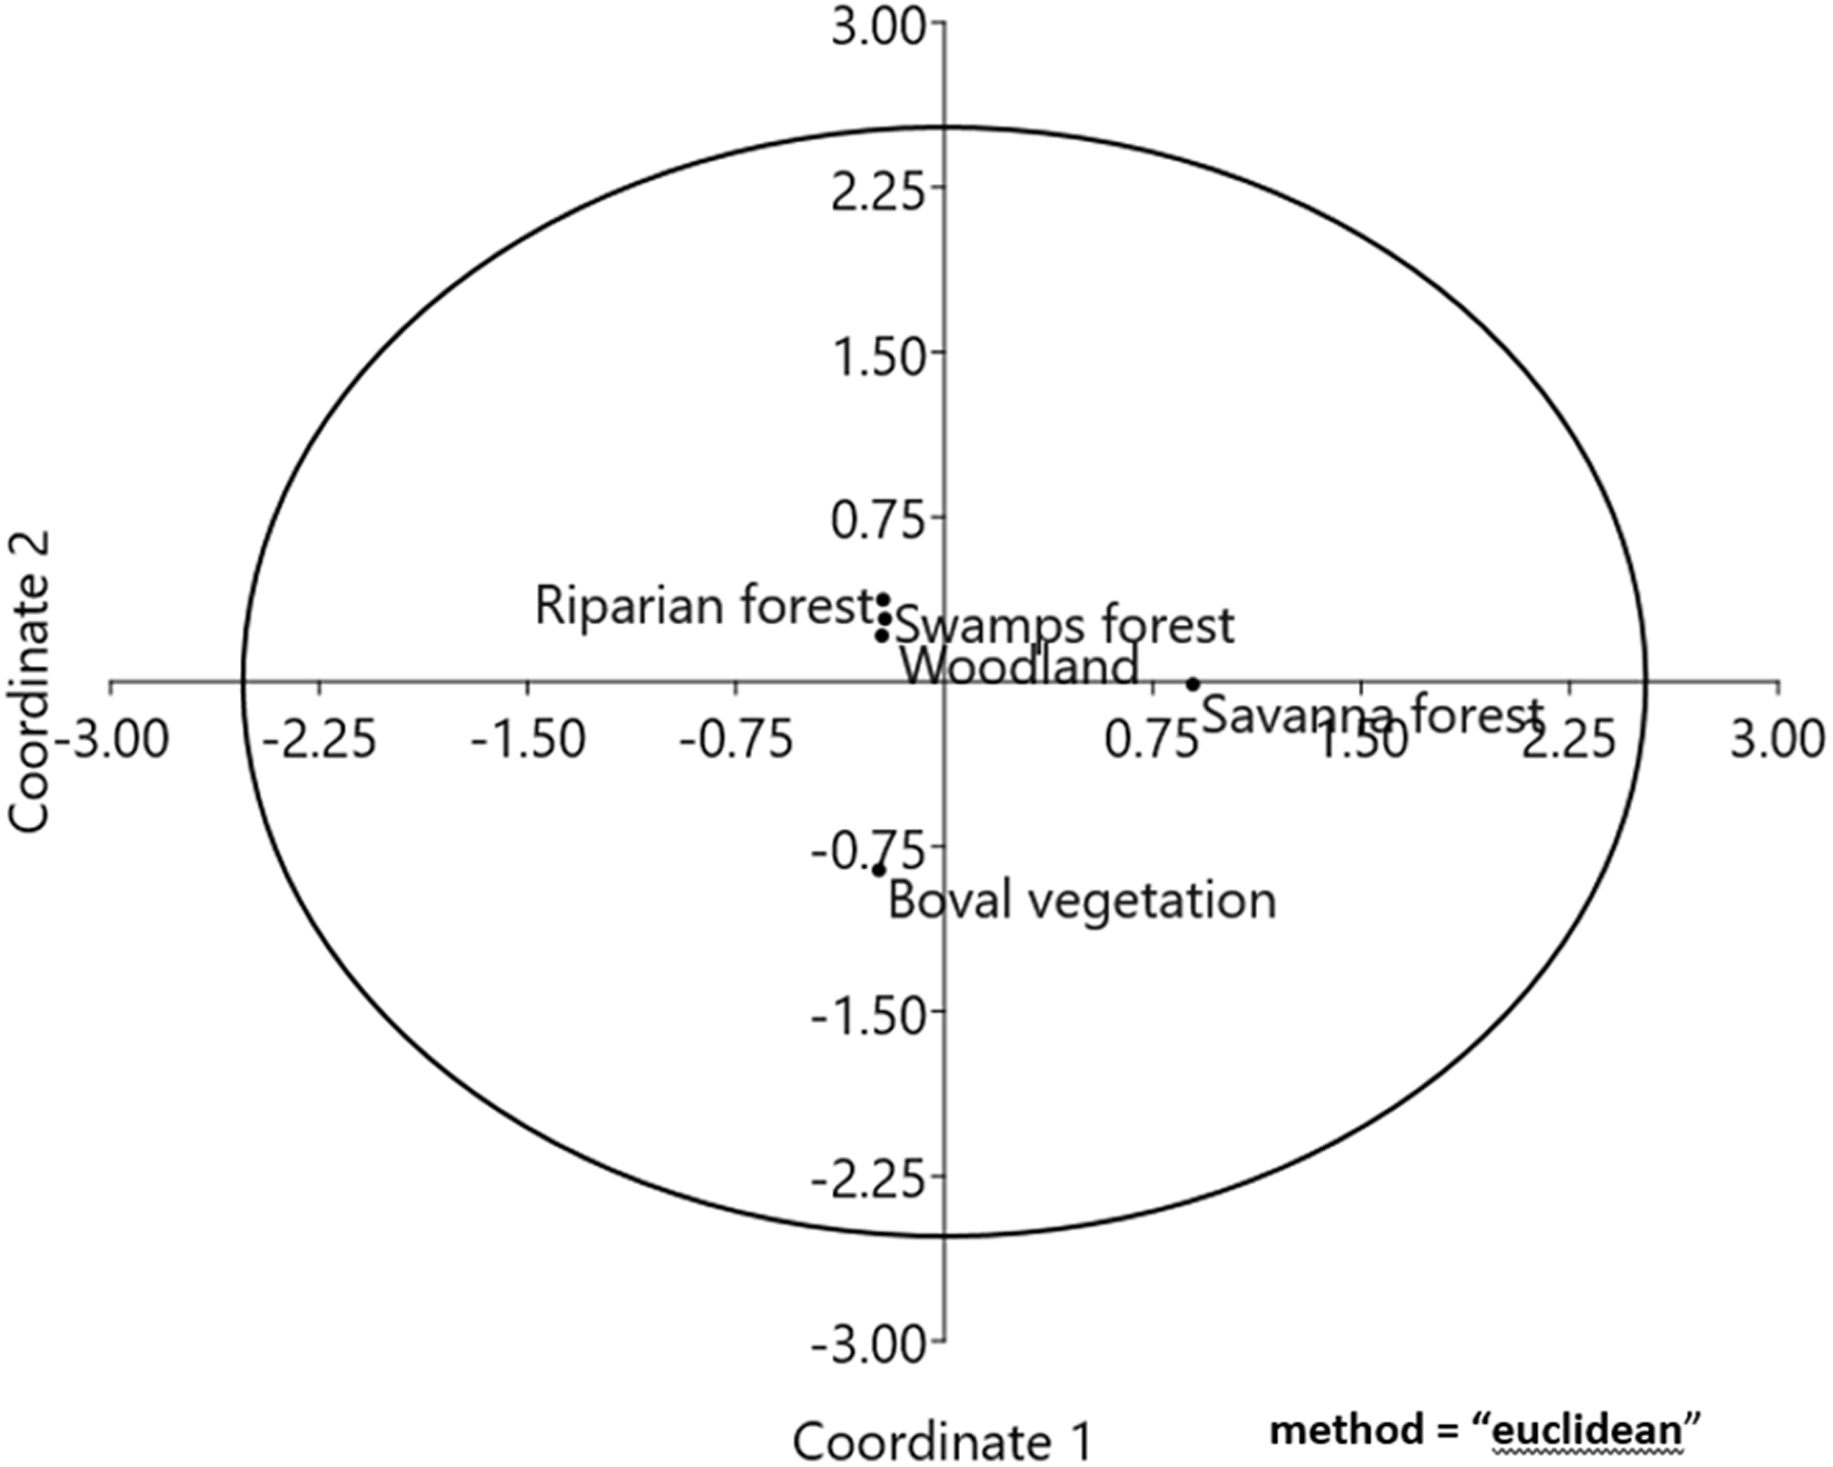
In total, we sampled 1,788 individuals from 54 species and 25 families across five vegetation types (see Appendix 1). Individual abundance varied significantly among the five vegetation types (KWχ 2 = 6.222, P < 0.08, Kruskal–Wallis’ test). The savannah forest recorded the highest number of individuals (n = 930, 16.8 ± S.E. 11.7 per 0.04 ha), while the swamp forest recorded the least number of individuals (n = 112, 2.0 ± 0.9 per 0.04 ha) (Table 1). Species median per hectare per vegetation type ranged from 17.2 ± S.E. 11.94 to 2.07 ± 0.90 (Table 1). Overall, the savanna forest recorded the highest number of species (Sobs = 17.2 ± S.E. 11.94 per 0.04 ha), despite being one of the sites affected by invasive alien species (Table 1). The swamp forest registered the fewest species (Sobs = 2.07 ± 11.94 per 0.04 ha). Trees, shrubs, and saplings constituted 86.4%, 10.7%, and 2.9%, respectively, of the total individuals sampled. The majority of species (21 sp., 20.4%) belonged to the Fabaceae family, followed by the Combretaceae (18 sp., 17.5%) and Rubiaceae (11 sp., 10.7%). The remaining families each contained fewer than 7 plant species (Appendix 1). Compositional similarity in relation to plant forms and species types, as indicated by principal coordinate analysis (PCoA), revealed that the five vegetation types (i.e., savanna forest, boval vegetation, woodland, riparian forest, and swamp forest) generally formed distinct areas in the ordination space, with slight overlap between the woodland and riparian forest vegetation types (Figure 2). The overlap in compositional distinctiveness suggests a similarity among the vegetation types. PERMANOVA demonstrated a significant difference in species composition (F-ratio = 3.0075, R² = 0.13, P = 0.019).
Number of species and individual abundances per hectare (0.04 ha) across the five vegetation types in Mole National Park

The principal coordinate analysis, showing the compositional distinctiveness in species sampled across the five vegetation types.

Response of woody species composition and abundance of individuals to disturbance-related drivers
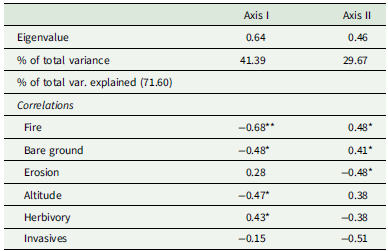
The CCA ordination diagram categorised species at the plot level based on their varied responses to disturbance-related drivers (Figure 3). We found that fire regimes, bare ground, invasive alien plant species, and erosion, derived from the first two axes of CCA ordination (I = 35% and II = 24%), explained 59% of the cumulative variance in species assemblages (Figure 3, Table 2). These disturbance-related drivers varied significantly across the five vegetation types (Hc = 68.35, P < 0.0001). Majority of the woody species in >50% of the 75 plots from the riparian forest, woodland, and boval vegetation types (upper and lower left of the ordination diagram), strongly correlated with wildfires (r = −0.68, P < 0.01), bare ground (r = −0.48, P < 0.05), and IAPS (r = −0.51, P < 0.05), along axis 1. Widespread fire regimes, alien invasives (e.g., Mentha longifolia, Chromolina odorata, and Tectona grandis) and bare ground, contributed to the presence of rarer species such as Afraegle paniculata (A. pani, n = 1), and Vitex chrysocarpa (V. chry, n = 1), Annona senegalensis (An. Sene, n = 1), Senegalia senegal (S. sene, n = 1), Isoberlinia doka (I. doka, n = 1), Burkea africana (B. Africa, n = 2), and Hymenocardia acida (H. acida, n = 3) that represented 8.7% of the total 54 species sampled (Figure 3; Appendix 1). However, the abundance of Detarium microcarpum (D. micro, n = 149), Terminalia avicennioides (T. avice, n = 58), Combretum adenogonium (C. adeno, n = 38), and Icacina senegalensis (I. sene, n = 31) was evidence of their positive association with fire regimes, invasive alien plant species, and bare ground.
Canonical correspondence analysis (CCA) diagram, showing the influence of disturbance-related drivers on species composition and coexistence in the 125 plots, across the five vegetation types. Plot codes represent the following: SVF = Savanna Forest; BOV = Boval vegetation; WDL = Woodland; Onwame riparian zones; RPF = Riparian Forest; and SWV = Swamp vegetation. Plant species are abbreviated as follows: Afzelia africana = A. africa; Bridelia ferruginea = B. ferru; Combretum mole = C. mole; Hymenocardia acida = H. acida; and Ziziphus mauritiana = Z. mauri (see Appendix 1 for all species and their abbreviated names). The arrows represent the disturbance-related drivers plotted, pointing in the direction of maximum change of the explanatory variables of the different sample plots. Disturbance-related drivers accounted for 59% (axes I = 35% and II = 24%) variability in woody community assemblages.

Summary of CCA axis lengths of species, showing the levels of correlation between axes and disturbance-related drivers, percentage variance of species, and species–disturbance relationship

Asterisks (*) = disturbance-related drivers that were significant. A correlation above/below ±0.70 is significant at ***P = 0.001; ±0.60 at **P = 0.01 and > 0.44 Monte-Carlo Pat *P = 0.05. Eigenvalues were significant for axes I (P < 0.01) and II (P < 0.002, Monte-Carlo P).
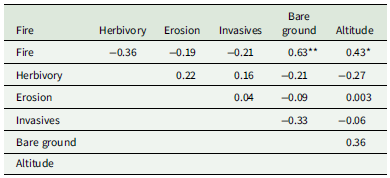
The remaining plots, primarily from the swamp and savanna forest vegetation types, correlated with IAPS (r = −0.51, P < 0.05), erosion (r = −0.48, P < 0.05), and herbivory (r = 0.43, P < 0.05) on axis II (upper and lower right of the ordination diagram). Ochna serrulate (n = 637), Diospyros mespiliformis (D. mespi, n = 102), Syzygium aqueum (S. aquem, n = 72), and Mitragyna inermis (M. inermis, n = 39) were the most abundant, compared to species such as Securidaca longipedunculata (S. long, n = 1) and Combretum mole (C. mole, n = 1), Strychnos innocua (S. innoc, n = 1) and Tamarindus indica (T. indica, n = 4) in the two vegetation types (Figure 3). Generally, the intensity of disturbances in the swamp and savanna forest vegetation types was largely moderate compared with the riparian forest, woodland, and the boval vegetation types. Intercorrelation between herbivory and erosion was not significant (r s = 0.22, P > 0.05), since not all plots in the swamp, riparian, and savanna forests showed signs of erosion as a result of severe herbivory activities, especially by the elephants and the buffalos (Table 3). Species that were found in the centre of the CCA diagram were tolerant to the average disturbance-related drivers in the five vegetation types.
Spearman rank correlation between disturbance-related drivers assessed in each of the five vegetation types

Significance of R values: *P < 0.05.
Variations in the pattern of species abundance and distribution among the five vegetation types
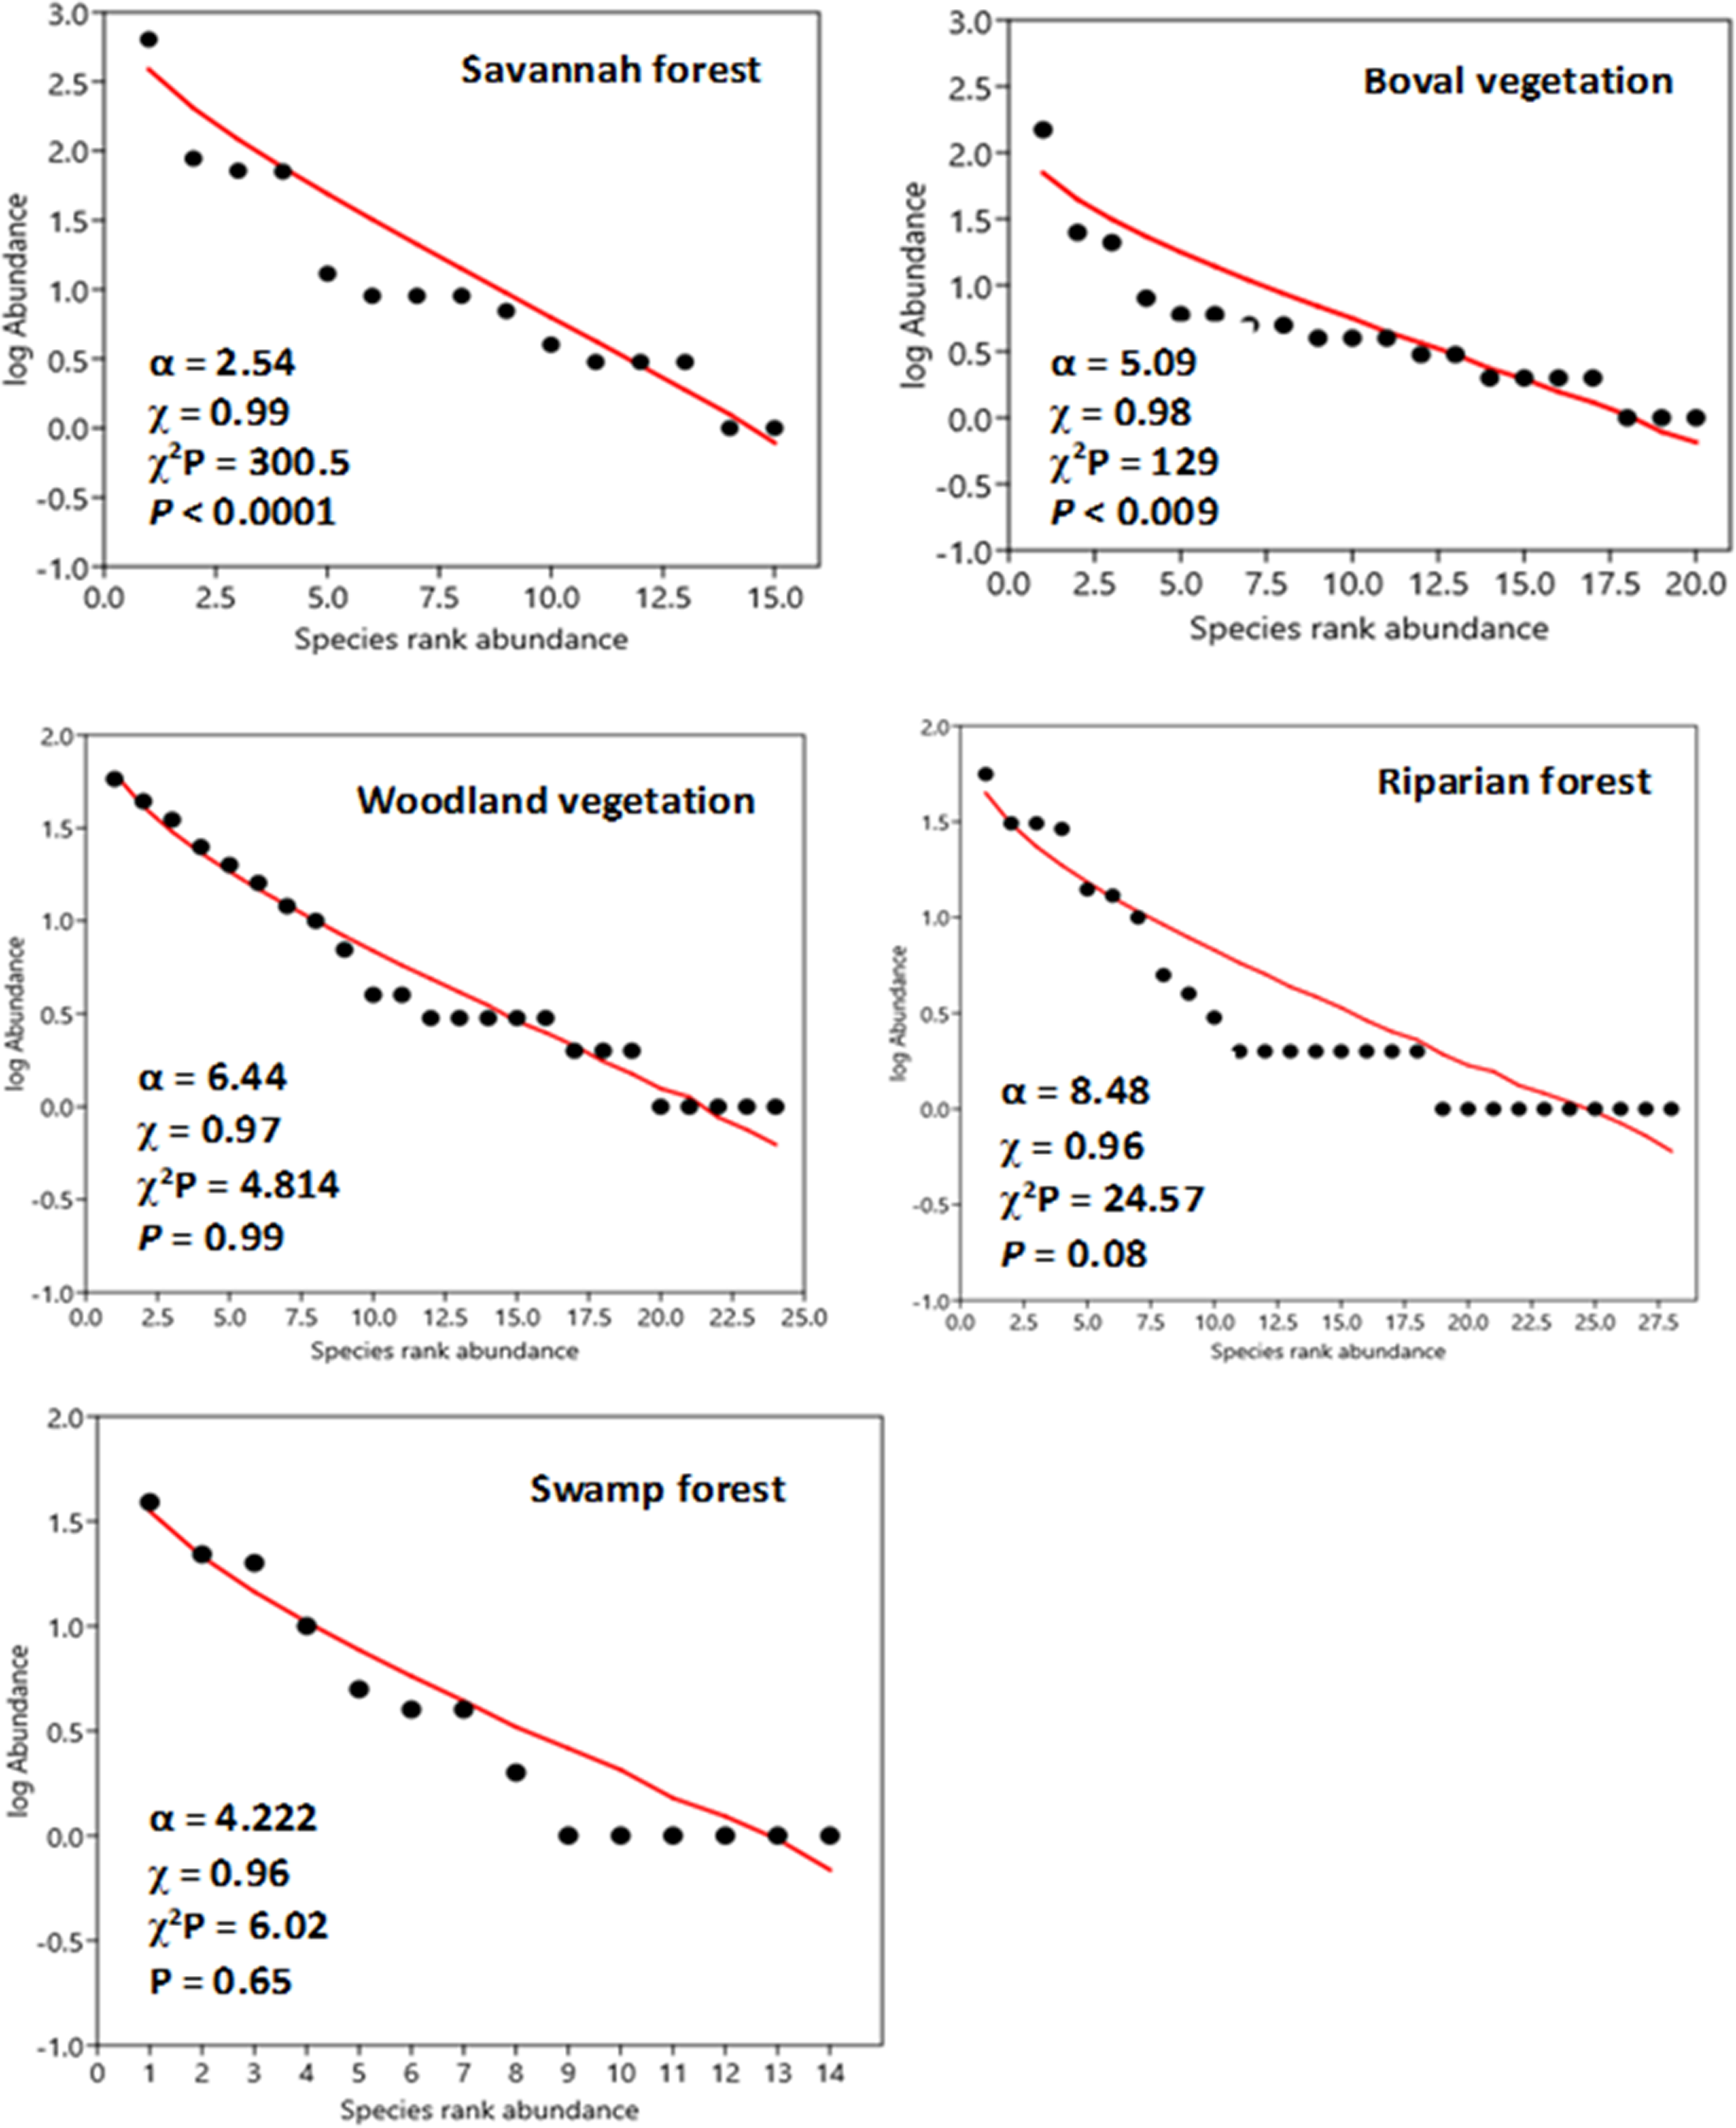
Species from the 125 plots across all five vegetation types were ranked from the most abundant to the least abundant along the χ-axis of the species abundance distribution (SAD) curve (Figure 4). Species distribution patterns generally reveal their variability in dominance, reflecting their relative success in competing for resources within their niche space. Overall, species distribution patterns among the five vegetation types did not differ significantly (slope of SAD: F-test = 1.175, P(regr) = 0.32, ANOVA interactions × species rank). Across the five vegetation types, we observed that species that were dominant with broad-based distribution were found in >50% of plots where disturbances were severe, yet they persisted, or in plots where disturbances were relatively less severe. The majority of these species were mature, with an average height of 6.5 m. On the other hand, less abundant species, with limited distribution, occurred in plots where disturbances were generally severe. Out of the 54 species recorded, only six species (i.e., Ochna serrulata in the savannah forest, Detarium microcarpum (boval vegetation), Vitellaria paradoxa (woodland vegetation), Diospyros mespiliformis (riparian forest), and Mitragyna inermis (swamp forest)) were ranked highest on the SAD curve, indicating their broad distribution and resilience to wildfires, invasive alien plant species, herbivory, and erosion (Figure 4). Among the rarer species ranked at the lower end of the SAD curves were Daniellia oliveri (the savannah forest), Afraegle paniculate (boval vegetation), Anogeissus leiocarpus (woodland vegetation), Afzelia africana (riparian forest), and Senegalia senegal (swamp forest). The majority of species found in the midsection of the SAD curves were proportionally abundant and fairly distributed across all five vegetation types. Comparing the variations in SAD along the regression curves aids in distinguishing their responses to disturbance-related drivers.
Log series model for species rank abundance distribution across the five vegetation types in the Mole National Park. Abundance is based on cumulative cover values per species per sampling site. Note that SADs are ordered in decreasing magnitude and plotted against their corresponding rank. Rarer species are found at the low end of the curve.
Discussion
Influence of disturbance-related drivers on species compositional distinctiveness and abundance across the five vegetation types
Our study sheds light on the growing concern regarding how disturbance-related drivers are shaping the tree community across five vegetation types in MNP, located in Ghana’s Savannah Region. Disturbance-related drivers not only play a key role in shaping plant community structure (Bentsi-Enchill et al. Reference Bentsi-Enchill, Damptey, Pappoe, Ekumah and Akotoye2022; Fakhry and Aljedaani Reference Fakhry and Aljedaani2020; Nsor et al. Reference Nsor, Mensah, Barnes and Akomatey2021) but also create spatial patterns of environmental heterogeneity in protected areas such as MNP. In this study, we observed that the dominance of Detarium microcarpum, Combretum adenogonium, Terminalia avicennioides, and Icacina senegalensis in the woodland and the boval vegetation types, where fire regimes, IAPS (e.g., Mentha longifolia and Chromolina odorata), and bare ground were widespread, compared with fewer species such as Afraegle paniculata, Vitex chrysocarpa, Annona senegalensis, Senegalia senegal, and Isoberlinia doka in the same vegetation types. This was probably due to the ability of the dominant set of species to tolerate the effects of these disturbance-related drivers, which may have existed over a long-term scale. When disturbances exceed the threshold tolerance of species, they tend to damage the plants, consequently affecting their survival. Nevertheless, the annual fire regimes in the Northern savannah ecosystem are among the processes that shape the structure of the woodland community. The majority of woody species, characterized by glabrous leaves and coarse bark traits, are thought to serve as adaptive mechanisms against the impacts of annual wildfire occurrences in the park. Several studies have demonstrated that plant responses to fire severity are measured through their resistance traits (i.e., thick bark) and resilience traits (i.e., regenerative organs and fire-cued recruitment) across fire-prone landscapes (e.g., Carvalho and Batalha Reference Carvalho and Batalha2013; Lawes et al. Reference Lawes, Keith and Bradstock2016). These functional traits, referred to as morpho-physio-phenological traits, influence adaptation through their effects on individual performance, including growth, survival, and reproduction (Schmitt et al. Reference Schmitt, Hérault, Ducouret, Baranger, Tysklind, Heuertz, Marcon, Saint Omer Cazal and Derroire2020; Violle et al. Reference Violle, Navas, Vile, Kazakou, Fortunel, Hummel and Garnier2007). They play a crucial role in how species respond to environmental changes and influence ecological processes (Lohbeck et al. Reference Lohbeck, Poorter, Paz, Pla, van Breugel, Martínez-Ramos and Bongers2012). Thus, considering the dynamics of species’ responses to disturbances in the three vegetation types, we can state that in a resource-constrained environment like the savannah ecosystem of northern Ghana, where anthropogenic activities and the impacts of climate change (erratic rainfall patterns and high temperatures) are severe, resistant and resilient tree species such as Detarium microcarpum, Syzygium aqueum, and Mitragyna inermis are likely to have a higher chance of survival compared to these singletons (e.g., Afraegle paniculata, Annona senegalensis, Afzelia africana, Senegalia senegal, Isoberlinia doka, and Securidaca longipedunculata). A similar study at the savanna–forest boundaries of southern Comoé National Park in the Ivory Coast observed the high potential of Anogeissus leiocarpus to regenerate under moderate to severe fire impact (Hennenberg et al. Reference Hennenberg, Goetze, Minden, Traoré and Porembski2005).
The fewest number of individuals in the swamp and the riparian forest vegetation types is largely attributed to erosion, widespread herbivory activities, and the presence of invasive alien plant species. Due to the availability of water nearly all year round in this vegetation type, the majority of wildlife species in the park find it more suitable to forage along its fringes. This process primarily leads to the trampling of the soil surface, rendering it loose and easily erodible. The eroded soils may harm plants through soil transport and deposition, consequently affecting their survival. The widespread presence of these invasive alien plant species, linked to their high dispersal capability, physiological plasticity, and rapid growth (David et al. Reference David, Thebault, Anneville, Duyck, Chapuis and Loeuille2017), may also have contributed to the decline of some indigenous species (e.g., Securidaca longipedunculata and Combretum mole). IAPS are widely known for their superior competitive advantage in resource exploitation over indigenous species. Mortensen et al. (Reference Mortensen, Danielson, Harpole, Alberti, Arnillas, Biederman, Borer, Cadotte, Dwyer, Hagenah, Hautier, Peri and Seabloom2018) study on the role of herbivores in plant diversity identified herbivory activities as a direct driver affecting vegetation composition and distribution, while Rai and Singh (Reference Rai and Singh2020) study identified IAPS as one of the major drivers of biodiversity loss. The authors further described how IAPS alters ecosystem services and socio-economic conditions through various mechanisms. The spread of IAPS has become a major driver of change in plant communities and plant–pollinator interactions across various biogeographical zones (Vanbergen et al. Reference Vanbergen, Espíndola and Aizen2018). Their capacity to impact native populations through direct predation or indirect trophic interactions (e.g., competition), resulting in alterations to food web structure, has been documented by researchers in the field of ecology (e.g., Andolina et al. Reference Andolina, Signa, Cilluffo, Iannucci, Mazzola and Vizzini2022).
Influence of disturbance-related drivers on the pattern of species abundance distribution among the five vegetation types
Studies have shown that analysing plant species distribution patterns along environmental gradients is important because it reveals species patterns in relation to environmental variation, thereby enhancing our understanding of their diversity and ecology (Toledo et al. Reference Toledo, Peña-Claros, Bongers, Alarcón, Balcázar, Chuviña, Leaño, Licona and Poorter2011). While our findings did not reveal any substantial differences in the species abundance distribution patterns across the five vegetation types, the slight variability in dominance at the plot level reflected their relative success in competing for resources, which was mediated by differing levels of driver impact intensities. Thus, the dominance and broad distribution of six species in each of the five vegetation types (i.e., Ochna serrulata in the savannah forest, Detarium microcarpum (boval vegetation), Vitellaria paradoxa (woodland vegetation), Diospyros mespiliformis (riparian forest), and Mitragyna inermis (swamp forest)) suggest their ability to withstand the occurrence of fire regimes, invasive alien plant species, herbivory activities, and erosion. Rarer or infrequent species, such as Daniellia oliveri (the savannah forest), Afraegle paniculate (boval vegetation), Anogeissus leiocarpus (woodland vegetation), Afzelia africana (riparian forest), and Senegalia senegal (swamp forest), were found in isolated patches, where the effects of fires, herbivory activities, and IAPS exceeded their threshold tolerance. The frequent occurrence of these disturbances tends to limit the abundance and distribution of many species, especially saplings or young recruits, that have not fully developed the resistance and resilience traits needed to overcome the increasing disturbances. Therefore, understanding how these species responded to the differing intensity levels of the disturbance-related drivers (i.e., species–environmental relationship) among the five vegetation types can serve as a bioindicator of the habitat conditions in the park and also predict their potential responses to future natural or human-induced drivers.
Conclusions
Disturbance-related drivers such as wildfires, erosion, herbivory, invasive alien plant species, and bare ground are among the factors that partly shaped the woody community composition and their distribution patterns in MNP. The findings in this study showed how the effect of fire regimes, invasive alien plant species, herbivory activities, erosion, and bare ground contributed to the general low abundances in the riparian and swamp forest vegetation types. From a species perspective, we observed that similar disturbance-related drivers led to the lowest individual abundance of species such as Afraegle paniculata, Vitex chrysocarpa, Annona senegalensis, Senegalia senegal, and Isoberlinia doka in the woodland and the boval vegetation types. However, the dominance and broad distribution of Detarium microcarpum, Combretum adenogonium, Terminalia avicennioides, and Icacina senegalensis from the same two vegetation types suggest their resistance to these disturbance-related drivers, particularly fire regimes, through the use of their fire-cued adaptive mechanisms. We conclude that in a resource-constrained environment like the savannah ecosystem of northern Ghana, the continuous expansion of these drivers may cause the majority of the rarer woody species to go extinct soon, while the few resistant and resilient species are likely to have their populations decreased.
Conservation implications of the study
Considering the ecological role of the woody plant community in MNP as a source of forage, shelter, and breeding ground for wild animals, as well as its contribution to balancing the local climate, park managers must establish suitable environmental conditions that enable the woody species not only to coexist but also to enhance richness and diversity, ultimately harnessing the park’s ecosystem functions. To achieve this, we recommend the following conservation measures for park managers to consider as part of their management guidelines: (1) prevent uncontrolled wildfires from spreading into the park from adjacent communities by constructing fire belts along the park’s boundaries and embarking on community education about the harmful effects of uncontrolled fires within the park; (2) adhere strictly to control or prescribed burning as a management tool for bush encroachment and stimulating early sprouting, ensuring that vegetation and soil microorganisms are not over-burned; (3) construct additional watering points at various locations to augment the current few in the park. This will help reduce ungulate overcrowding and frequent visits to the fewer existing water holes, curtailing ongoing damage to vegetation in the immediate surroundings and on frequently traversed paths to the waterholes; (4) consider reseeding eroded and bare ground areas in the park to curtail further soil degradation; and (5) adopt reafforestation with indigenous species as a conservation measure to replace vegetation destroyed by herbivory and fire activities, helping to amend eroded and bare ground areas of the park.
Supplementary material
The supplementary material for this article can be found at https://doi.org/10.1017/S0266467426100467
Data accessibility statement
Data are submitted as a supplementary file via the online submission portal.
Competing interests
The authors declare that there is no conflict or competing interest regarding the publication of this research article.
Declaration of funding
This research did not receive any specific funding.
Author contributions
Conceptualization: All authors contributed to the study ideas and formulation of the research goals.
Developing methods: Study design and field methods were performed by C.A.N., G.A., M.A., P.S., P.O., and B.B.K.
Conducting the research: Field data collection, plot demarcation, taxa identification, and literature review were performed by C.A.N., G.A., M.A., P.S., P.O., A.B., and B.B.K.
Data analysis: Statistical analysis of data was carried out by C.A.N., G.A., D.D., M.A., and P.S.
Data interpretation: Interpretation of the output of the statistical analysis was performed by C.A.N., G.A., P.S., P.O., A.B., and B.B.K.
Preparation of figures: Map of the study area, table formatting, and drawing of figures were performed by C.A.N., G.A., D.D., and A.B.
Writing
Co-writing the original draft, reviewing, commenting, and editing drafts of the manuscript were jointly carried out by C.A.N., M.A. D.D., and P.O. All authors read and approved the final manuscript.
APPENDICES
Appendix 1. Summary of plant species listed under each family. Notice that species under Fabaceae (29.6%) and Combretaceae (14.8%) were the most abundant